Gann

18 june Nifty50 brekout and Breakdown leval
CALL (CE) – Bullish triggers
↑ 24,437 – 24,547 : Safe‑zone long entry
↑ 24,672: Hold CE while above this mark
↑ 24,780 : Opening‑S1 breakout, keep holding CE
↑ 24,930.00 : Turns bias positive; fresh CE can be added
↑ 25,083.00 : Entry level for aggressive longs
↑ 25,318.00 : Short‑cover zone; strong upside momentum possible
PUT (PE) – Bearish triggers
↓ 25,318.00 : If price closes back under, shift to PE (safe)
↓ 25,083 : PE in the “risky” reversal zone
↓ 24,930 : Bias flips negative; keep/add PE
↓ 24,780 : Opening‑R1 break; hold PE
↓ 24,672 : Continue PE below this level
↓ 24,535 : Unwinding zone – watch for fast drops
↓ 24,437 : Final downside support; trail PEs here

EURUSD I Monday CLS I Model 1 I High risk I FOMC TomorowHey, Market Warriors, here is another outlook on this instrument
If you’ve been following me, you already know every setup you see is built around a CLS Footprint, a Key Level, Liquidity and a specific execution model.
If you haven't followed me yet, start now.
My trading system is completely mechanical — designed to remove emotions, opinions, and impulsive decisions. No messy diagonal lines. No random drawings. Just clarity, structure, and execution.
🧩 What is CLS?
CLS is real smart money — the combined power of major investment banks and central banks moving over 6.5 trillion dollars a day. Understanding their operations is key to markets.
✅ Understanding the behavior of CLS allows you to position yourself with the giants during the market manipulations — leading to buying lows and selling highs - cleaner entries, clearer exits, and consistent profits.
📍 Model 1
is right after the manipulation of the CLS candle when CIOD occurs, and we are targeting 50% of the CLS range. H4 CLS ranges supported by HTF go straight to the opposing range.
"Adapt what is useful, reject what is useless, and add what is specifically your own."
— David Perk aka Dave FX Hunter ⚔️
👍 Hit like if you find this analysis helpful, and don't hesitate to comment with your opinions, charts or any questions.

GBPUSD I Daily CLS I KL - OB I Model 1 I High riskHey, Market Warriors, here is another outlook on this instrument
If you’ve been following me, you already know every setup you see is built around a CLS Footprint, a Key Level, Liquidity and a specific execution model.
If you haven't followed me yet, start now.
My trading system is completely mechanical — designed to remove emotions, opinions, and impulsive decisions. No messy diagonal lines. No random drawings. Just clarity, structure, and execution.
🧩 What is CLS?
CLS is real smart money — the combined power of major investment banks and central banks moving over 6.5 trillion dollars a day. Understanding their operations is key to markets.
✅ Understanding the behavior of CLS allows you to position yourself with the giants during the market manipulations — leading to buying lows and selling highs - cleaner entries, clearer exits, and consistent profits.
📍 Model 1
is right after the manipulation of the CLS candle when CIOD occurs, and we are targeting 50% of the CLS range. H4 CLS ranges supported by HTF go straight to the opposing range.
"Adapt what is useful, reject what is useless, and add what is specifically your own."
— David Perk aka Dave FX Hunter ⚔️
👍 Hit like if you find this analysis helpful, and don't hesitate to comment with your opinions, charts or any questions.


RTH Setup - My potential everyday model.In the video we see my potential everyday model that I will be looking for, for the next 3-6 months.

DAX: Local Bearish Bias! Short!
My dear friends,
Today we will analyse DAX together☺️
The recent price action suggests a shift in mid-term momentum. A break below the current local range around 23,509.95 will confirm the new direction downwards with the target being the next key level of 23,389.15.and a reconvened placement of a stop-loss beyond the range.
❤️Sending you lots of Love and Hugs❤️

GOLD: Absolute Price Collapse Ahead! Short!
My dear friends,
Today we will analyse GOLD together☺️
The in-trend continuation seems likely as the current long-term trend appears to be strong, and price is holding below a key level of 3,394.60 So a bearish continuation seems plausible, targeting the next low. We should enter on confirmation, and place a stop-loss beyond the recent swing level.
❤️Sending you lots of Love and Hugs❤️

EUR/USD CRAZZYY BULLISH BIAS (SMC Perspective) | 1H Outlook🔍 Analysis Summary:
Price is consolidating above a clear demand zone after breaking previous structure to the upside.
We’ve seen liquidity engineered above the swing high (marked X), followed by internal structure developing.
I’m watching for a sweep into demand (grey zone) between 1.1520 – 1.1540, followed by a bullish reaction.
Expecting a bullish BOS (Break of Structure) on the lower timeframe to confirm continuation to 1.16340.
📌 Key Levels:
Demand Zone: 1.1520 – 1.1540
Liquidity Sweep: Above recent highs (1.1596)
Target Zone: 1.16340
Invalidation: Clean break below 1.1500
🗓️ Fundamental Drivers to Watch:
USD Weakness – Driven by:
Recent soft CPI & PPI data (cooling inflation)
Increased chances of Fed rate cuts (starting September 2025)
Risk-on market sentiment pushing money out of the USD
Upcoming News Events:
Wed 19 June – Fed Chair Powell Speaks 🗣️
→ Any dovish tone supports the bullish EUR/USD case
Thu 20 June – Initial Jobless Claims 📉
→ A higher-than-expected print could confirm labor market weakness = USD bearish
Fri 21 June – Flash Manufacturing/Services PMI (EUR & USD)
→ EUR strength + weak US data can fuel upside
🧠 My Plan:
Watch for a liquidity sweep into demand
Wait for bullish confirmation on M15 or M5
Target previous high & continuation toward 1.16340
💬 Follow for more SMC-based breakdowns. Let’s stay sharp and react, not predict.
#EURUSD #SMC #SmartMoney #LiquiditySweep #ForexTrading #OrderBlocks #sam_trades_smc #PriceAction #FOMC #Fed #USD

EURUSD: Will Go Up! Long!
My dear friends,
Today we will analyse EURUSD together☺️
The market is at an inflection zone and price has now reached an area around 1.15524 where previous reversals or breakouts have occurred.And a price reaction that we are seeing on multiple timeframes here could signal the next move up so we can enter on confirmation, and target the next key level of 1.15663.Stop-loss is recommended beyond the inflection zone.
❤️Sending you lots of Love and Hugs❤️

SILVER: The Market Is Looking Up! Long!
My dear friends,
Today we will analyse SILVER together☺️
The price is near a wide key level
and the pair is approaching a significant decision level of 36.903 Therefore, a strong bullish reaction here could determine the next move up.We will watch for a confirmation candle, and then target the next key level of 37.240 .Recommend Stop-loss is beyond the current level.
❤️Sending you lots of Love and Hugs❤️

BTC bullish rally before the fall?I am expecting a bullish Rally to the previous high since it's a third wave of current impulse I'm expecting BUY from here to the target mentioned. Will be exciting if any reversal signs occur. (BTC should touch 140,000+ in 2 months.)
entering buy from 107400
*A fall still pending* BITSTAMP:BTCUSD

USDCHF LONG FORECAST Q2 W25 D17 Y25USDCHF LONG FORECAST Q2 W25 D17 Y25
Professional Risk Managers👋
Welcome back to another FRGNT chart update📈
Diving into some Forex setups using predominantly higher time frame order blocks alongside intraday confirmation & breaks of structure.
Let’s see what price action is telling us today! 🔥
💡Here are some trade confluences📝
✅Weekly order block rejection
✅Daily order block rejection
✅15’ order block
✅Intraday bullish breaks of structure
🔑 Remember, to participate in trading comes always with a degree of risk, therefore as professional risk managers it remains vital that we stick to our risk management plan as well as our trading strategies.
📈The rest, we leave to the balance of probabilities.
💡Fail to plan. Plan to fail.
🏆It has always been that simple.
❤️Good luck with your trading journey, I shall see you at the very top.
🎯Trade consistent, FRGNT X


USDCAD LONG FORECAST Q2 W25 D17 Y25 12:18 GMT UPDATEUSDCAD LONG FORECAST Q2 W25 D17 Y25 12:18 GMT UPDATE
Professional Risk Managers👋
Welcome back to another FRGNT chart update📈
Diving into some Forex setups using predominantly higher time frame order blocks alongside confirmation breaks of structure.
💡Here are some trade confluences📝
✅1H order block
✅HTF 50 EMA
✅Intraday bullish breaks of structure to be identified
✅15’ order block identified
🔑 Remember, to participate in trading comes always with a degree of risk, therefore as professional risk managers it remains vital that we stick to our risk management plan as well as our trading strategies.
📈The rest, we leave to the balance of probabilities.
💡Fail to plan. Plan to fail.
🏆It has always been that simple.
❤️Good luck with your trading journey, I shall see you at the very top.
🎯Trade consistent, FRGNT X

AUDJPY SHORT FORECAST Q2 W25 D17 Y25AUDJPY SHORT FORECAST Q2 W25 D17 Y25
Professional Risk Managers👋
Welcome back to another FRGNT chart update📈
Diving into some Forex setups using predominantly higher time frame order blocks alongside confirmation breaks of structure.
Let’s see what price action is telling us today! 👀
💡Here are some trade confluences📝
✅Weekly Order block rejection
✅15' Order block
✅Daily order block identified
🔑 Remember, to participate in trading comes always with a degree of risk, therefore as professional risk managers it remains vital that we stick to our risk management plan as well as our trading strategies.
📈The rest, we leave to the balance of probabilities.
💡Fail to plan. Plan to fail.
🏆It has always been that simple.
❤️Good luck with your trading journey, I shall see you at the very top.
🎯Trade consistent, FRGNT X

GBPUSD SHORT FORECAST Q2 W25 D17 Y25GBPUSD SHORT FORECAST Q2 W25 D17 Y25
Professional Risk Managers👋
Welcome back to another FRGNT chart update📈
Diving into some Forex setups using predominantly higher time frame order blocks alongside confirmation breaks of structure.
Let’s see what price action is telling us today!
💡Here are some trade confluences📝
✅Weekly order block
✅15' order block
✅Intraday 15' break of structure
✅Tokyo ranges to be filled
🔑 Remember, to participate in trading comes always with a degree of risk, therefore as professional risk managers it remains vital that we stick to our risk management plan as well as our trading strategies.
📈The rest, we leave to the balance of probabilities.
💡Fail to plan. Plan to fail.
🏆It has always been that simple.
❤️Good luck with your trading journey, I shall see you at the very top.
🎯Trade consistent, FRGNT X

GBPJPY SHORT FORECAST Q2 W25 D17 Y25GBPJPY SHORT FORECAST Q2 W25 D17 Y25
Professional Risk Managers👋
Welcome back to another FRGNT chart update📈
Diving into some Forex setups using predominantly higher time frame order blocks alongside confirmation breaks of structure.
Let’s see what price action is telling us today!
💡Here are some trade confluences📝
✅Daily order block
✅15' order block
✅Intraday breaks of structure
✅Daily high rejection
🔑 Remember, to participate in trading comes always with a degree of risk, therefore as professional risk managers it remains vital that we stick to our risk management plan as well as our trading strategies.
📈The rest, we leave to the balance of probabilities.
💡Fail to plan. Plan to fail.
🏆It has always been that simple.
❤️Good luck with your trading journey, I shall see you at the very top.
🎯Trade consistent, FRGNT X

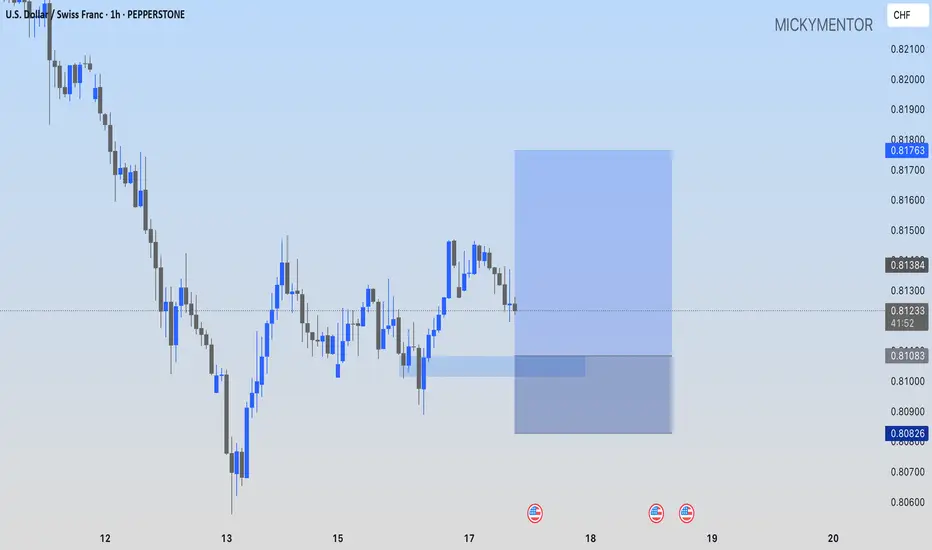
USDCHF: I'M GOING LONG AT 0.81083!!PEPPERSTONE:USDCHF I'm going long at 0.81083, looking at the 0.81763 as my target.
XAUUSD: June 17 Market Analysis and StrategyGold technical analysis
Daily chart resistance 3450, support below 3355
4-hour chart resistance 3420, support below 3372
1-hour chart resistance 3403, support below 3375
The recent rise and fall of gold is completely controlled by market news. The next move of Israel and Iran directly affects the rise and fall of gold. It rises under the stimulation of the escalation of the situation and begins to pull back when the situation eases. The long and short positions form a short-term tug-of-war pattern, but the fundamentals have not changed. Gold is still in a bull market.
Today's rebound high is in the 3405/03 area. This position has formed a top and bottom conversion position. It is bound to have a certain suppressive effect on the rebound of gold prices. You can refer to the 3403/05 area for shorting during the day. Pay attention to the vicinity of 3370 below. If you hold this support level, you can buy short-term. The intraday volatility is not expected to be large, which is suitable for fast-in and fast-out transactions!
SELL: 3402near SL: 3407
BUY: 3370near SL: 3365

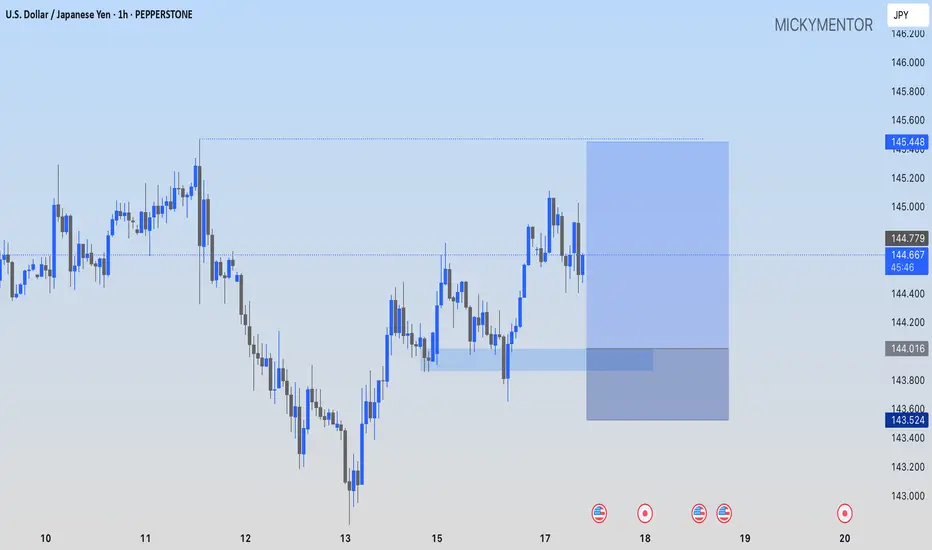
USDJPY: A BUY IDEAPEPPERSTONE:USDJPY I'm going long at 144.016, while keeping the 145.448 as my profit target.
#DYM/USDT#DYM
The price is moving within a descending channel on the 1-hour frame, adhering well to it, and is heading towards a strong breakout and retest.
We are experiencing a rebound from the lower boundary of the descending channel. This support is at 0.2552.
We are experiencing a downtrend on the RSI indicator, which is about to break and retest, supporting the upward trend.
We are heading towards stability above the 100 Moving Average.
Entry price: 0.2576
First target: 0.2642
Second target: 0.2714
Third target: 0.2808

#MYRIA/USDT#MYRIA
The price is moving within a descending channel on the 1-hour frame, adhering well to it, and is heading towards a strong breakout and retest.
We are experiencing a rebound from the lower boundary of the descending channel. This support is at 0.0013111.
We have a downtrend on the RSI indicator that is about to be broken and retested, supporting the upward trend.
We are in a trend of consolidation above the 100 moving average.
Entry price: 0.0013710
First target: 0.0014510
Second target: 0.0015333
Third target: 0.0016300
