#MYRIA/USDT#MYRIA
The price is moving within a descending channel on the 1-hour frame, adhering well to it, and is on its way to breaking it strongly upwards and retesting it.
We are experiencing a rebound from the lower boundary of the descending channel. This support is at 0.0013200.
We are experiencing a downtrend on the RSI indicator, which is about to break and retest, supporting the upward movement.
We are in a trend of consolidation above the 100 moving average.
Entry price: 0.0014000
First target: 0.0014300
Second target: 0.0014975
Third target: 0.0015800
Gann

EURCHF SHORT FORECAST Q2 W25 D17 Y25EURCHF SHORT FORECAST Q2 W25 D17 Y25
Professional Risk Managers👋
Welcome back to another FRGNT chart update📈
Diving into some Forex setups using predominantly higher time frame order blocks alongside confirmation breaks of structure.
Let’s see what price action is telling us today! 👀
💡Here are some trade confluences📝
✅Weekly 50EMA Rejection
✅15' Order block
🔑 Remember, to participate in trading comes always with a degree of risk, therefore as professional risk managers it remains vital that we stick to our risk management plan as well as our trading strategies.
📈The rest, we leave to the balance of probabilities.
💡Fail to plan. Plan to fail.
🏆It has always been that simple.
❤️Good luck with your trading journey, I shall see you at the very top.
🎯Trade consistent, FRGNT X

USDZAR-CAUTIOUS SELL strategy 6 hourly chart GANNthe pair is drifting lower in silent mode :) it feels we may have an attempt to break 17.7500 area and if successful on close, the possible should-head-shoulder top may be something to think about. Medium term i see still see higher, however, short-term we are not out of the woods as yet, and the USDX is under pressure as well, so like we will embark lower.
Strategy SELL @ 17.8150-17.8500 and take profit near 17.5750 for now.

GBPUSD SHORT FORECAST Q2 W25 D17 Y25GBPUSD SHORT FORECAST Q2 W25 D17 Y25
Professional Risk Managers👋
Welcome back to another FRGNT chart update📈
Diving into some Forex setups using predominantly higher time frame order blocks alongside confirmation breaks of structure.
Let’s see what price action is telling us today!
💡Here are some trade confluences📝
✅Weekly order block
✅15' order block
✅Intraday 15' break of structure
✅Tokyo ranges to be filled
🔑 Remember, to participate in trading comes always with a degree of risk, therefore as professional risk managers it remains vital that we stick to our risk management plan as well as our trading strategies.
📈The rest, we leave to the balance of probabilities.
💡Fail to plan. Plan to fail.
🏆It has always been that simple.
❤️Good luck with your trading journey, I shall see you at the very top.
🎯Trade consistent, FRGNT X

USDCAD LONG FORECAST Q2 W25 D17 Y25USDCAD LONG FORECAST Q2 W25 D17 Y25
Professional Risk Managers👋
Welcome back to another FRGNT chart update📈
Diving into some Forex setups using predominantly higher time frame order blocks alongside confirmation breaks of structure.
💡Here are some trade confluences📝
✅1H order block
✅HTF 50 EMA
✅Intraday bullish breaks of structure to be identified
✅15’ order block identified
🔑 Remember, to participate in trading comes always with a degree of risk, therefore as professional risk managers it remains vital that we stick to our risk management plan as well as our trading strategies.
📈The rest, we leave to the balance of probabilities.
💡Fail to plan. Plan to fail.
🏆It has always been that simple.
❤️Good luck with your trading journey, I shall see you at the very top.
🎯Trade consistent, FRGNT X

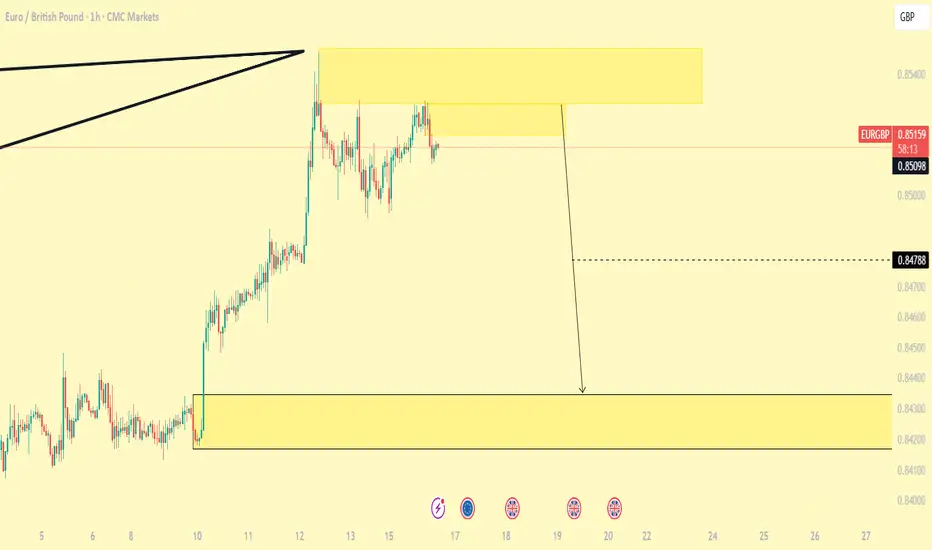
EURUSD SHORT FORECAST Q2 W25 D17 Y25EURUSD SHORT FORECAST Q2 W25 D17 Y25
Professional Risk Managers👋
Welcome back to another FRGNT chart update📈
Diving into some Forex setups using predominantly higher time frame order blocks alongside confirmation breaks of structure.
Let’s see what price action is telling us today!
💡Here are some trade confluences📝
✅Weekly order block rejection
✅15' order block
✅4 hour order block identified
✅Tokyo ranges to be filled
🔑 Remember, to participate in trading comes always with a degree of risk, therefore as professional risk managers it remains vital that we stick to our risk management plan as well as our trading strategies.
📈The rest, we leave to the balance of probabilities.
💡Fail to plan. Plan to fail.
🏆It has always been that simple.
❤️Good luck with your trading journey, I shall see you at the very top.
🎯Trade consistent, FRGNT X

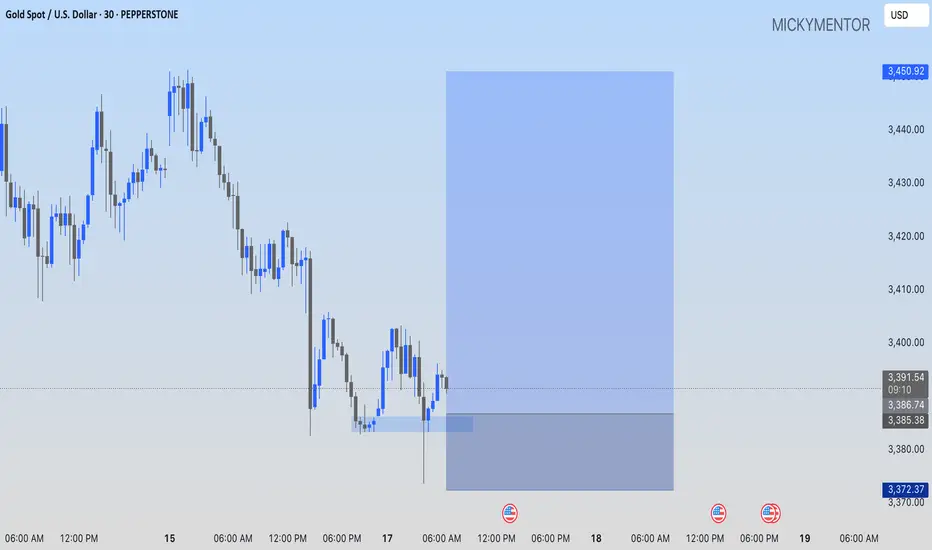
GOLD: A BUY OPPORTUNITY PEPPERSTONE:XAUUSD I'll long at 3386.74 price level while targeting the 3450.92 level.
EURCAD: AN OPPORTUNITY TO GO LONG.PEPPERSTONE:EURCAD Going long at current market price, my target is 1.57893

Geopolitics and Fed policies dominate the trend of gold prices
📌 Gold news
On Monday, boosted by the risk aversion of the Iran-Israel war, the gold price hit a high of 3452, but the continuity was not strong, and a series of other adjustments appeared; let's briefly sort it out:
1: Adjustment: Adjustment is normal. If the market rises, if the risk aversion does not continue to exert force, then the gold price can only return to technical adjustments. Therefore, Monday's adjustment trend and the decline trend are normal!
2: Risk aversion trend: The risk aversion trend will not be reversed for the time being! Once the war starts, it will not end easily; unless the interests of both sides are not damaged, the two sides agree to a ceasefire, but at present, the hope and probability are relatively small, so the risk aversion trend is the mainstream of the current global market;
3: The direction of the Iran-Israel war is nothing more than a few possibilities:
A: The war expands, the surrounding countries stand in line, and the US and Western imperialism join the battlefield; the war expands rapidly! At the same time, Iran is forced to block the Strait of Hormuz! This is a manifestation of escalating war;
B: Both sides, as well as the forces behind them, have calculated their interests, reached an agreement, and agreed to end the war conflict; this mainly depends on Iran's attitude; is it "powerful and unyielding", continuing to oppose the United States and imperialism; or is it pro-American, completely changing its identity, or changing its identity to submit to Israel and the United States;
To sum up: risk aversion eased slightly on Monday, but the overall global market is still risk-averse; technical adjustments are normal trends; but don't completely ignore the importance of risk aversion and risk aversion control because of technical adjustments; in addition, the subsequent results of the Middle East war are nothing more than the above two; what determines all this is the attitude of both sides;
📊Comment Analysis
Although the gold price fell below 3400 and the short-term trend changed, the general direction still remains bullish. In the future, it is still expected to hit the high point of 3500, but it is necessary to wait patiently for the bottom to stabilize before choosing the opportunity to buy the bottom. The current market is changing rapidly, and investors should adhere to the principle of following the trend and flexibly adjust their trading strategies.
💰Strategy Package
Short-term gold 3383-3393 long, stop loss 3372, target 3420-3440;
Short-term gold 3420-3430 short, stop loss 3435, target 3390-3370;
⭐️ Note: Labaron hopes that traders can properly manage their funds

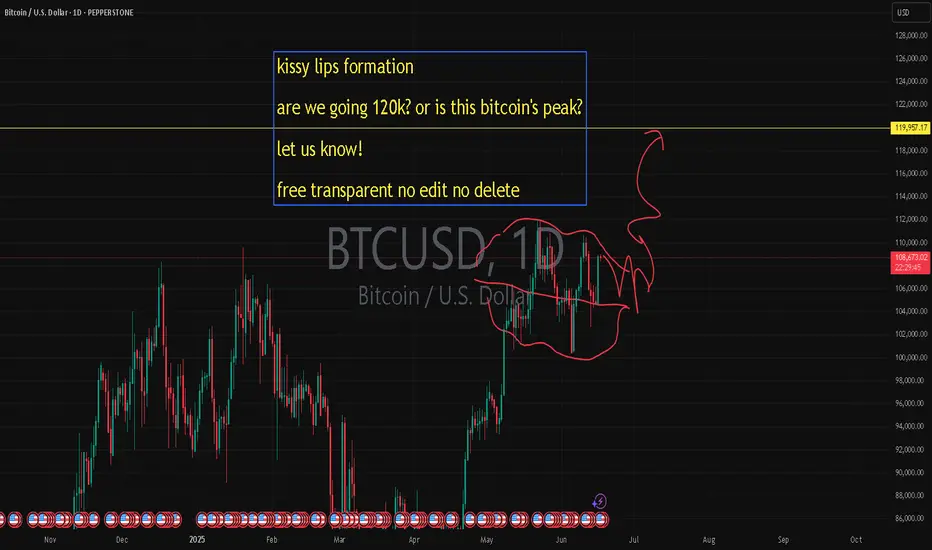
kissy lips formation are we going 120k? or is this btc's peak?kissy lips formation
are we going 120k? or is this bitcoin's peak?
let us know!
free transparent no edit no delete
🐉We value full transparency. All wins and fails fully publicized, zero edit, zero delete, zero fakes.🐉
🐉Check out our socials for some nice insights.🐉
information created and published doesn't constitute investment advice!
NOT financial advice
Fed Rate Decision May Trigger a Decline in Gold PricesDespite heightened tensions in the Middle East providing safe-haven support, gold failed to break through the 3450–3455 resistance zone today and instead pulled back to the 3400–3386 support area.
This decline was mainly driven by two factors:
Iran expressed willingness to resume nuclear talks, easing geopolitical tensions and weakening safe-haven demand.
Growing expectations that the Fed will keep rates unchanged this week strengthened the DXY, reducing gold's appeal.
That said, inflation concerns persist, offering medium-term support to gold. On the technical front, the 3378–3340 consolidation zone may serve as secondary support, while stronger trend support lies in the 3310–3289 range—a level that may only be tested under extreme bearish conditions.
For now, the primary support to watch is 3386–3373, with short-term rebound resistance around 3400–3420.
Trading Suggestion:
Ahead of the Fed’s rate decision tomorrow, consider buying on dips, as today’s decline may lead to a technical rebound. Then reassess the market’s response to key support and resistance levels to determine further action.

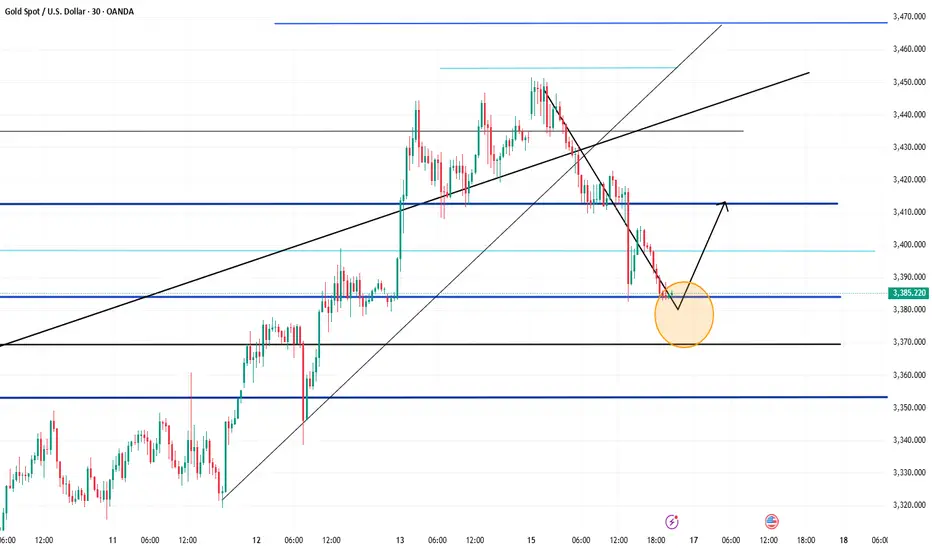
XAUUSDDaily uptrend looking for 3500 at least, its gonna take its time.
But we have also a internal uptrend, with this being said, on the lower timeframe, we will have a pull back

BTC is Bullish!Hello TradingView Family / Fellow Traders. This is Richard, also known as theSignalyst.
📈BTC has been overall bullish trading within the rising channel marked in blue.
Moreover, the red zone is a strong structure!
🏹 Thus, the highlighted blue circle is a strong area to look for buy setups as it is the intersection of structure and lower blue trendline acting as a non-horizontal support.
📚 As per my trading style:
As #BTC approaches the blue circle zone, I will be looking for bullish reversal setups (like a double bottom pattern, trendline break , and so on...)
📚 Always follow your trading plan regarding entry, risk management, and trade management.
Good luck!
All Strategies Are Good; If Managed Properly!
~Rich

US30: Strong Growth Ahead! Long!
My dear friends,
Today we will analyse US30 together☺️
The recent price action suggests a shift in mid-term momentum. A break above the current local range around 42,682.9 will confirm the new direction upwards with the target being the next key level of 42,855.1 and a reconvened placement of a stop-loss beyond the range.
❤️Sending you lots of Love and Hugs❤️

SILVER: Will Go Down! Short!
My dear friends,
Today we will analyse SILVER together☺️
The in-trend continuation seems likely as the current long-term trend appears to be strong, and price is holding below a key level of 36.344 So a bearish continuation seems plausible, targeting the next low. We should enter on confirmation, and place a stop-loss beyond the recent swing level.
❤️Sending you lots of Love and Hugs❤️

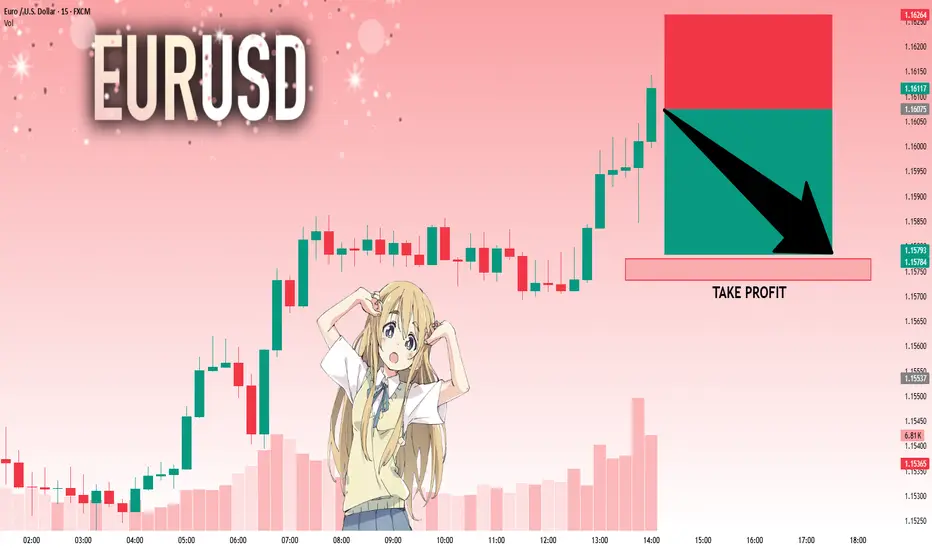
EURUSD: The Market Is Looking Down! Short!
My dear friends,
Today we will analyse EURUSD together☺️
The market is at an inflection zone and price has now reached an area around 1.16075 where previous reversals or breakouts have occurred.And a price reaction that we are seeing on multiple timeframes here could signal the next move down so we can enter on confirmation, and target the next key level of 1.15775..Stop-loss is recommended beyond the inflection zone.
❤️Sending you lots of Love and Hugs❤️
GOLD: Strong Bullish Sentiment! Long!
My dear friends,
Today we will analyse GOLD together☺️
The price is near a wide key level
and the pair is approaching a significant decision level of 3,393.80 Therefore, a strong bullish reaction here could determine the next move up.We will watch for a confirmation candle, and then target the next key level of 3,414.38.Recommend Stop-loss is beyond the current level.
❤️Sending you lots of Love and Hugs❤️

USDZAR-SELL strategy 3 Hourly chart Reg.ChannelThe pair has first moved higher due to the fundamental pressures, but seems to trade side ways to lower. Indicators tend to suggest lower levels again, and feel that 17.7500 area could be seen short-term.
Strategy SELL @ 17.9000-17.9500 and take profit near 17.7650 for now.

AUDJPY SHORT FORECAST Q2 W25 D16 Y25AUDJPY SHORT FORECAST Q2 W25 D16 Y25
Professional Risk Managers👋
Welcome back to another FRGNT chart update📈
Diving into some Forex setups using predominantly higher time frame order blocks alongside confirmation breaks of structure.
Let’s see what price action is telling us today! 👀
💡Here are some trade confluences📝
✅Weekly Order block rejection
✅15' Order block
✅Daily order block identified
🔑 Remember, to participate in trading comes always with a degree of risk, therefore as professional risk managers it remains vital that we stick to our risk management plan as well as our trading strategies.
📈The rest, we leave to the balance of probabilities.
💡Fail to plan. Plan to fail.
🏆It has always been that simple.
❤️Good luck with your trading journey, I shall see you at the very top.
🎯Trade consistent, FRGNT X

3M CLS I KL - FVG I Model 2 I Target 50% CLSHey, Market Warriors, here is another outlook on this instrument
If you’ve been following me, you already know every setup you see is built around a CLS Footprint, a Key Level, Liquidity and a specific execution model.
If you haven't followed me yet, start now.
My trading system is completely mechanical — designed to remove emotions, opinions, and impulsive decisions. No messy diagonal lines. No random drawings. Just clarity, structure, and execution.
🧩 What is CLS?
CLS is real smart money — the combined power of major investment banks and central banks moving over 6.5 trillion dollars a day. Understanding their operations is key to markets.
✅ Understanding the behavior of CLS allows you to position yourself with the giants during the market manipulations — leading to buying lows and selling highs - cleaner entries, clearer exits, and consistent profits.
📍 Model 1
is right after the manipulation of the CLS candle when CIOD occurs, and we are targeting 50% of the CLS range. H4 CLS ranges supported by HTF go straight to the opposing range.
"Adapt what is useful, reject what is useless, and add what is specifically your own."
— David Perk aka Dave FX Hunter ⚔️
👍 Hit like if you find this analysis helpful, and don't hesitate to comment with your opinions, charts or any questions.

Looking for an entry Since the Market just opened they're little opportunities, still have my eyes opened tho
