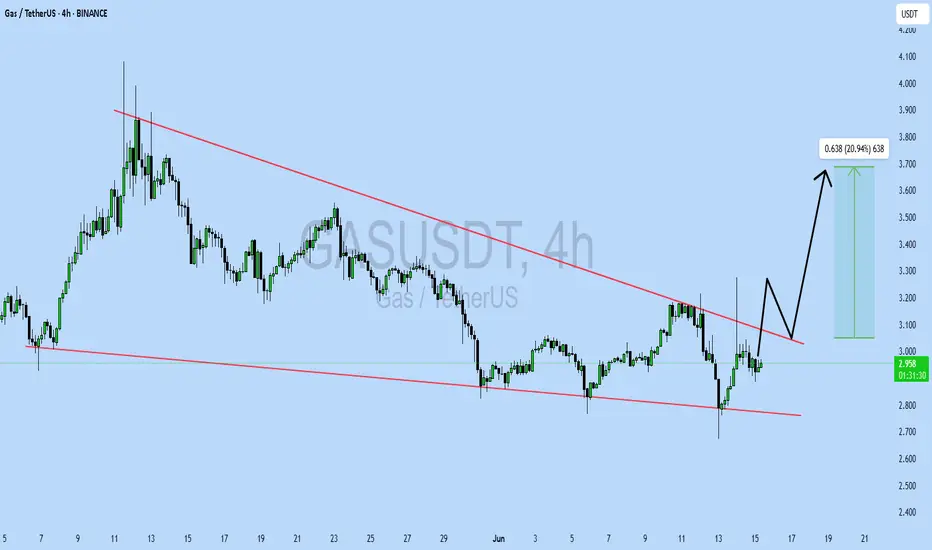
GASUSDT UPDATE
Pattern: Falling Wedge Breakout
Current Price: \$2.962
Target Price: \$3.70
Target % Gain: 20.27%
Technical Analysis: GAS has broken out of a falling wedge on the 4H chart, signaling bullish momentum. Price is retesting the breakout zone with a potential push towards \$3.70. Volume support and structure indicate continuation.
Time Frame: 4H
Risk Management Tip: Always use proper risk management.
Gann
AUDUSDWe have a bullish market with a weaker dollar. Price currently retraced to our H4 demand zone after BOS but price induced some bullish moment to create some Liquidity. Now that price has mitigated both the Liquidity and Demand Zone. We should expect price continuation (Bullish)

#SQT/USDT#SQT
The price is moving within a descending channel on the 1-hour frame, adhering well to it, and is on its way to breaking it strongly upwards and retesting it.
We are seeing a bounce from the lower boundary of the descending channel. This support is at 0.001278.
We have a downtrend on the RSI indicator that is about to break and retest, which supports the upward trend.
We are looking for stability above the 100 moving average.
Entry price: 0.0001298
First target: 0.0013189
Second target: 0.001352
Third target: 0.001390

#SOL/USDT#SOL
The price is moving within a descending channel on the 1-hour frame and is expected to break and continue upward.
We have a trend to stabilize above the 100 moving average once again.
We have a downtrend on the RSI indicator that supports the upward move by breaking it upward.
We have a support area at the lower limit of the channel at 148, acting as strong support from which the price can rebound.
Entry price: 153
First target: 156
Second target: 159
Third target: 162

#HOT/USDT#HOT
The price is moving within a descending channel on the 1-hour frame and is expected to break and continue upward.
We have a trend to stabilize above the 100 moving average once again.
We have a downtrend on the RSI indicator that supports the upward move with a breakout.
We have a support area at the lower boundary of the channel at 0.000945, acting as strong support from which the price can rebound.
Entry price: 0.000948
First target: 0.000984
Second target: 0.000998
Third target: 0.001020

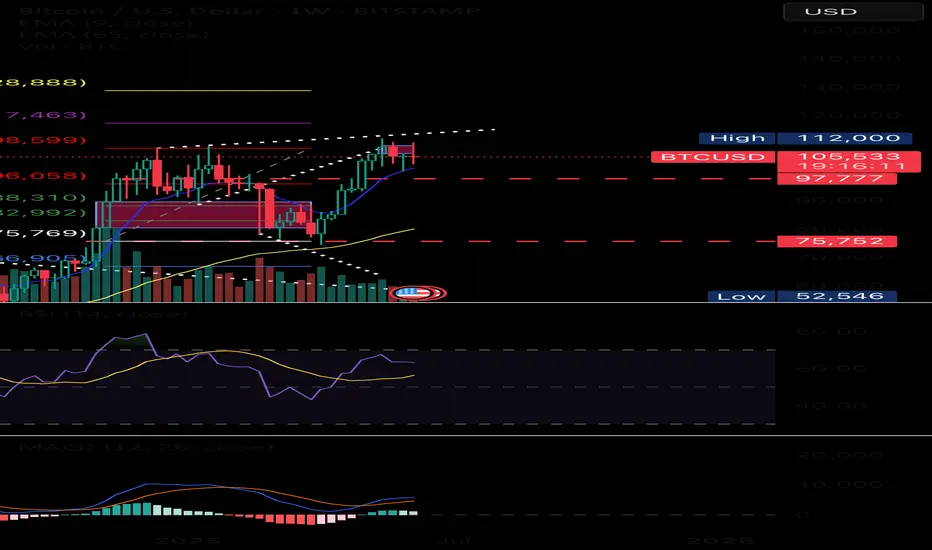
Bitcoin Bitcoin is showing strong momentum to keep moving up.
📊 But for it to truly explode, we need to see inflation spike past 3%.
🔥 Why? Because Bitcoin thrives in high-inflation environments it’s the hedge, the leverage, and the escape route.
#Bitcoin #Crypto #InflationHedge #BTC #Macroeconomics #TradingSignals

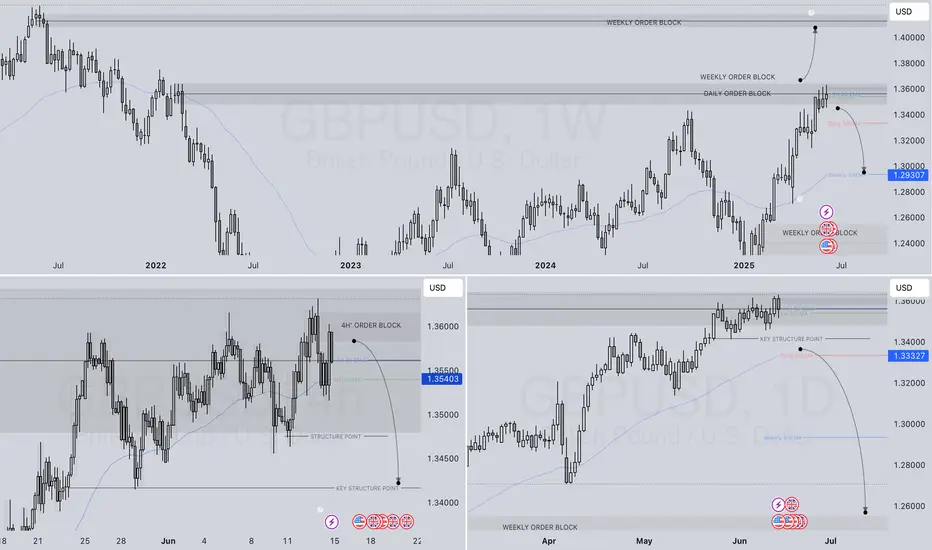
GBPUSD WEEKLY HTF FORECAST Q2 W25 Y25GBPUSD WEEKLY HTF FORECAST Q2 W25 Y25
Professional Risk Managers👋
Welcome back to another FRGNT chart update📈
Diving into some Forex setups using predominantly higher time frame order blocks alongside confirmation breaks of structure.
💭NOTE- If price closes above the key weekly/ daily order block with daily close- re evaluation will be required.
🔑 Remember, to participate in trading comes always with a degree of risk, therefore as professional risk managers it remains vital that we stick to our risk management plan as well as our trading strategies.
📈The rest, we leave to the balance of probabilities.
💡Fail to plan. Plan to fail.
🏆It has always been that simple.
❤️Good luck with your trading journey, I shall see you at the very top.
🎯Trade consistent, FRGNT X
EURUSD WEEKLY HTF FORECAST Q2 W25 Y25EURUSD WEEKLY HTF FORECAST Q2 W25 Y25
Professional Risk Managers👋
Welcome back to another FRGNT chart update📈
Diving into some Forex setups using predominantly higher time frame order blocks alongside confirmation breaks of structure.
💭NOTE- If price closes above the key weekly/ daily order block with daily close- re evaluation will be required.
🔑 Remember, to participate in trading comes always with a degree of risk, therefore as professional risk managers it remains vital that we stick to our risk management plan as well as our trading strategies.
📈The rest, we leave to the balance of probabilities.
💡Fail to plan. Plan to fail.
🏆It has always been that simple.
❤️Good luck with your trading journey, I shall see you at the very top.
🎯Trade consistent, FRGNT X

GBPJPY WEEKLY HTF FORECAST Q2 W25 Y25GBPJPY WEEKLY HTF FORECAST Q2 W25 Y25
Professional Risk Managers👋
Welcome back to another FRGNT chart update📈
Diving into some Forex setups using predominantly higher time frame order blocks alongside confirmation breaks of structure.
🔑 Remember, to participate in trading comes always with a degree of risk, therefore as professional risk managers it remains vital that we stick to our risk management plan as well as our trading strategies.
📈The rest, we leave to the balance of probabilities.
💡Fail to plan. Plan to fail.
🏆It has always been that simple.
❤️Good luck with your trading journey, I shall see you at the very top.
🎯Trade consistent, FRGNT X

NG1!: Target Is Down! Short!
My dear friends,
Today we will analyse NG1! together☺️
The price is near a wide key level
and the pair is approaching a significant decision level of 3.602 Therefore, a strong bearish reaction here could determine the next move down.We will watch for a confirmation candle, and then target the next key level of 3.569..Recommend Stop-loss is beyond the current level.
❤️Sending you lots of Love and Hugs❤️

$spyyieahh
Retest of mid line parallel.
Let's see how thos one works out, by 28 July we should see that touch of mid line and then boom or bust ?

USOIL: Absolute Price Collapse Ahead! Short!
My dear friends,
Today we will analyse USOIL together☺️
The recent price action suggests a shift in mid-term momentum. A break below the current local range around 73.387 will confirm the new direction downwards with the target being the next key level of 72.481.and a reconvened placement of a stop-loss beyond the range.
❤️Sending you lots of Love and Hugs❤️

NI225: Will Go Up! Long!
My dear friends,
Today we will analyse NI225 together☺️
The in-trend continuation seems likely as the current long-term trend appears to be strong, and price is holding above a key level of 37,817.93 So a bullish continuation seems plausible, targeting the next high. We should enter on confirmation, and place a stop-loss beyond the recent swing level.
❤️Sending you lots of Love and Hugs❤️

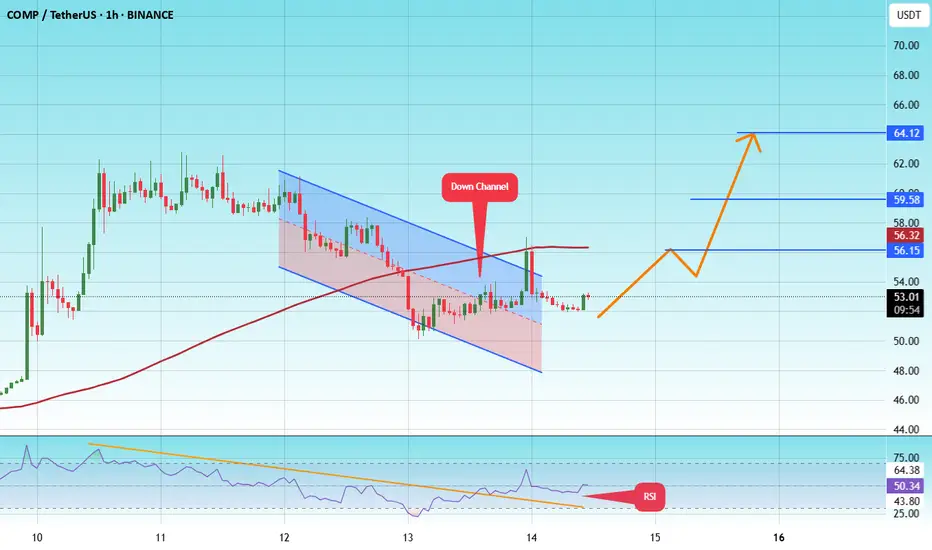
#COMP/USDT#COMP
The price is moving within a descending channel on the 1-hour frame and is expected to break and continue upward.
We have a trend to stabilize above the 100 moving average once again.
We have a downtrend on the RSI indicator that supports the upward move by breaking it upward.
We have a support area at the lower limit of the channel at 48, acting as strong support from which the price can rebound.
Entry price 53
First target 56
Second target 60
Third target 64
SOLANA SOL/USD Here's an important fan which shows me all the supports and resistances. Depends on the short-term move we'll realize the future. Ok thanks I'll try and call me back in time to see what the sho and I have no clue I think we

XAUUSDXAUUSD on a daily its on a uptrend, we will have probably on lowertimeframe a pullback but in mid-term we going for 3500.

DXY: Local Bullish Bias! Long!
My dear friends,
Today we will analyse DXY together☺️
The market is at an inflection zone and price has now reached an area around 97.757 where previous reversals or breakouts have occurred.And a price reaction that we are seeing on multiple timeframes here could signal the next move up so we can enter on confirmation, and target the next key level of 97.970.Stop-loss is recommended beyond the inflection zone.
❤️Sending you lots of Love and Hugs❤️

GOLD: Strong Growth Ahead! Long!
My dear friends,
Today we will analyse GOLD together☺️
The price is near a wide key level
and the pair is approaching a significant decision level of 3,431.19 Therefore, a strong bullish reaction here could determine the next move up.We will watch for a confirmation candle, and then target the next key level of 3,422.53.Recommend Stop-loss is beyond the current level.
❤️Sending you lots of Love and Hugs❤️

EURUSD: Will Go Up! Long!
My dear friends,
Today we will analyse EURUSD together☺️
The recent price action suggests a shift in mid-term momentum. A break above the current local range around 1.15537 will confirm the new direction upwards with the target being the next key level of 1.15800 and a reconvened placement of a stop-loss beyond the range.
❤️Sending you lots of Love and Hugs❤️

SILVER: The Market Is Looking Down! Short!
My dear friends,
Today we will analyse SILVER together☺️
The in-trend continuation seems likely as the current long-term trend appears to be strong, and price is holding below a key level of 36.303 So a bearish continuation seems plausible, targeting the next low. We should enter on confirmation, and place a stop-loss beyond the recent swing level.
❤️Sending you lots of Love and Hugs❤️

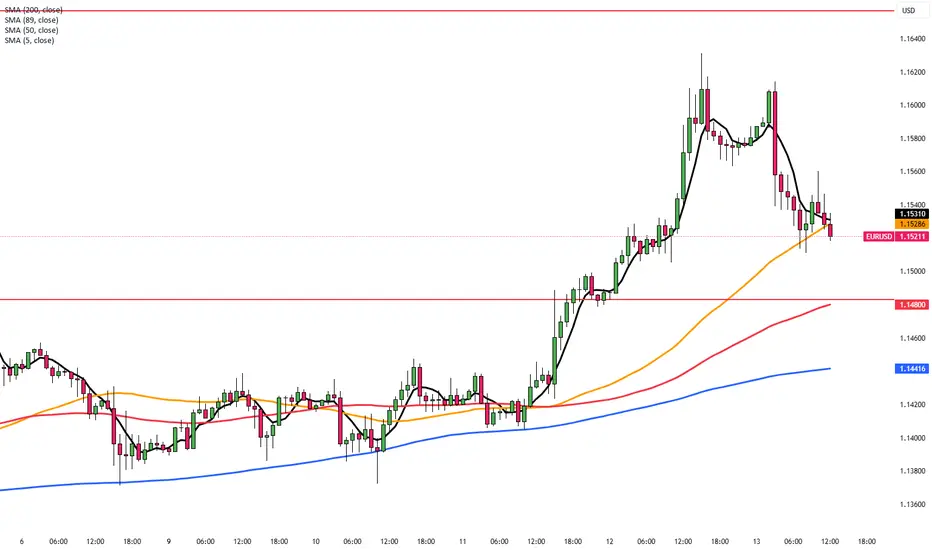
EUR/USD Slips on Geopolitical TensionsEUR/USD dropped to around 1.1530 on Friday, ending a four-day rally, as safe-haven demand lifted the US Dollar amid rising Middle East tensions.
Israel struck Iranian targets to weaken its nuclear program, prompting emergency measures. The US denied involvement but warned Iran not to target its assets.
Trump’s plan to expand steel tariffs from June 23 added trade uncertainty, while soft US inflation data kept Fed rate cut hopes alive.
Markets now await the US Michigan Sentiment report for further signals.
Resistance is located at 1.1580, while support is seen at 1.1460.
TELEKOM MALAYSIA going to rm8based on research report by
2025-06-13 TM
TELEKOM MALAYSIA BHD
6.60 8.15 +1.55 (23.48%) BUY RHB-OSK
now retracing to 0.618
predicting that it will go for the third wave untul 1.618 at RM8
