Infineon next big moveInfineon (IFX) – Potential Reversal at Trendline Support
Price has sharply corrected from the local highs around 38.7–39.0 EUR, reaching the major ascending trendline support in the 35.5–36.0 EUR demand zone.
🔹 Key points:
Strong upward trendline (blue) acting as dynamic support.
Price has reached a green demand box with confluence from previous structure.
MACD is bearish but momentum is oversold.
RSI at ~25 indicates oversold conditions with potential for a bounce.
Projected path: Possible short-term consolidation or retest of the trendline, followed by a bullish continuation towards 38.9, 39.2, and 39.5 EUR Fibonacci levels.
Targets: Fibonacci extensions at 1.272 (38.92 EUR), 1.618 (39.21 EUR), and the psychological 40 EUR zone if bullish momentum continues.
🔻 Invalidation: Clear breakdown below 34.98 EUR support (0.236 retracement) with volume confirmation could invalidate this reversal setup.
Gann

EURUSD: Strong Growth Ahead! Long!
My dear friends,
Today we will analyse EURUSD together☺️
The market is at an inflection zone and price has now reached an area around 1.17463 where previous reversals or breakouts have occurred.And a price reaction that we are seeing on multiple timeframes here could signal the next move up so we can enter on confirmation, and target the next key level of 1.17589.Stop-loss is recommended beyond the inflection zone.
❤️Sending you lots of Love and Hugs❤️

EURCAD Long TradeOANDA:EURCAD
Long trade, with my back testing of this strategy, it hits multiple possible take profits, manage your position accordingly.
TP-1: 1.59517
TP-2: 1.59726
This is good trade, don't overload your risk like greedy, be disciplined trader, this is good trade.
Use proper risk management
Looks like good trade.
Lets monitor.
Use proper risk management.
Disclaimer: only idea, not advice

NYA chart Posted The signal for the Top is hours away .7/24/7/26The chart posted is my work based on the golden ratio and SPIRAL calendar work .We will be hit by one of if not the highest ever solar storms from 7/24 to 7/26 I will be re shorting into this date And will look for the markets worldwide to see a massive event .I have been talking a massive earthquake and the markets to begin a drop into OCT 10 to the 20th . best of trades .Wavetimer

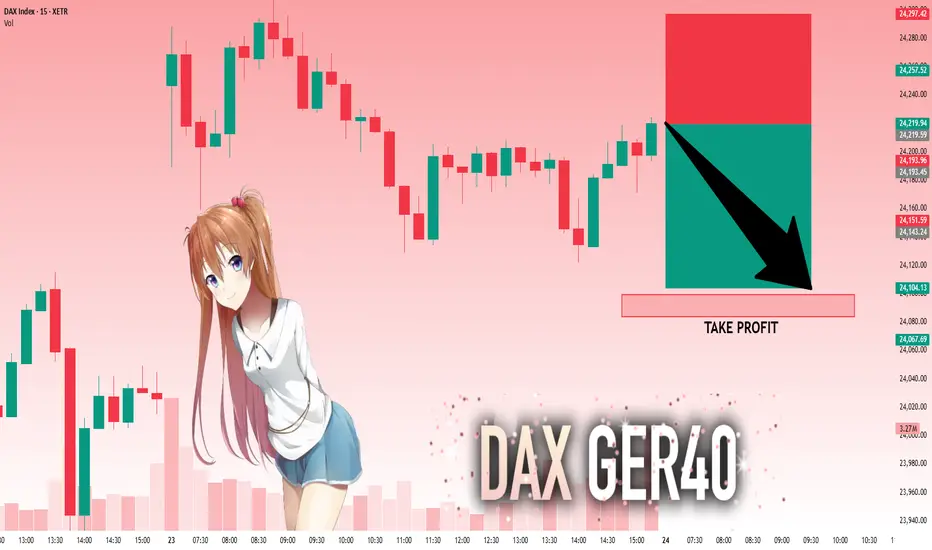
DAX: Target Is Down! Short!
My dear friends,
Today we will analyse DAX together☺️
The recent price action suggests a shift in mid-term momentum. A break below the current local range around 24,219.59 will confirm the new direction downwards with the target being the next key level of 24,099.27.and a reconvened placement of a stop-loss beyond the range.
❤️Sending you lots of Love and Hugs❤️
GOLD: Move Up Expected! Long!
My dear friends,
Today we will analyse GOLD together☺️
The in-trend continuation seems likely as the current long-term trend appears to be strong, and price is holding above a key level of 3,393.33 So a bullish continuation seems plausible, targeting the next high. We should enter on confirmation, and place a stop-loss beyond the recent swing level.
❤️Sending you lots of Love and Hugs❤️

EURUSD: Strong Growth Ahead! Long!
My dear friends,
Today we will analyse GOLD together☺️
The market is at an inflection zone and price has now reached an area around 1.17463 where previous reversals or breakouts have occurred.And a price reaction that we are seeing on multiple timeframes here could signal the next move up so we can enter on confirmation, and target the next key level of 1.17589.Stop-loss is recommended beyond the inflection zone.
❤️Sending you lots of Love and Hugs❤️

SILVER: Will Go Down! Short!
My dear friends,
Today we will analyse SILVER together☺️
The price is near a wide key level
and the pair is approaching a significant decision level of 39.520 Therefore, a strong bearish reaction here could determine the next move down.We will watch for a confirmation candle, and then target the next key level of 39.416..Recommend Stop-loss is beyond the current level.
❤️Sending you lots of Love and Hugs❤️

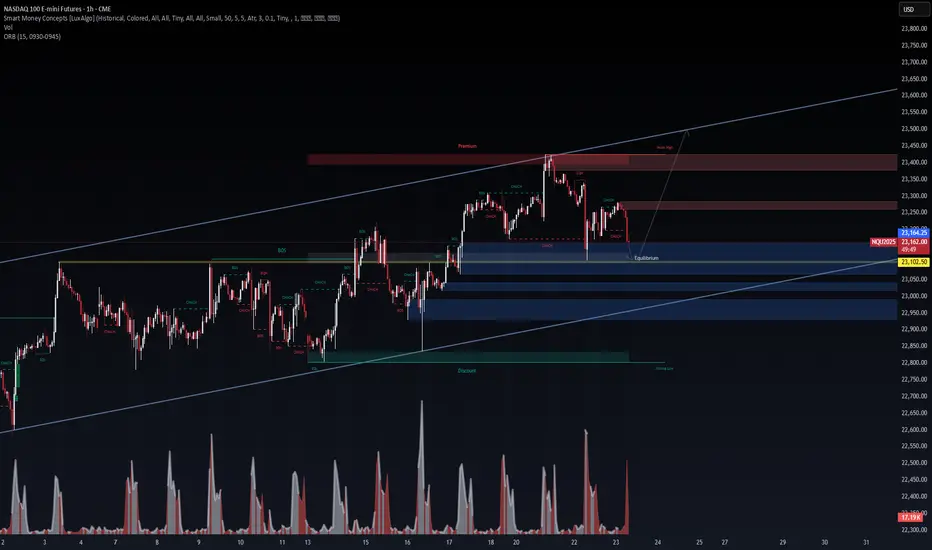
$NQ – Liquidity Sweep & Reversal Loading? NASDAQ Futures ( SEED_ALEXDRAYM_SHORTINTEREST2:NQ ) testing equilibrium support within a clean ascending channel structure. Recent price action swept local liquidity and reacted off the 1H EQ zone. Here's what we're seeing:
🔹 Key Smart Money Concepts (SMC)
Major CHoCH → BOS sequence confirms local bullish intent
Clean reaction off EQ demand zone with volume spike (13.97K)
Multiple EQHs and BOS chains → strong institutional footprint
Price holding above higher low structure, respecting channel support
🔹 Setup Bias (VolanX Protocol)
Long bias active above 23,050
Retest of EQ zone confirms order flow shift
Target zones:
🎯 PT1: 23,250
🎯 PT2: 23,440 (Premium zone)
🎯 PT3: 23,600+ upper trendline (if macro aligns)
🔹 Macro Note: Watch for bond yields + VIX + tech earnings this week. Any surprise upside catalyst could fuel a breakout to new highs.
🧠 This setup aligns with the VolanX DSS protocol. Execution window is open. Not financial advice.
#NASDAQ #NQ #Futures #SmartMoney #VolanX #TradingView #LiquiditySweep
XAUUSD: Market analysis and strategy on July 22.Gold technical analysis
Daily chart resistance level 3450, support level 3330
Four-hour chart resistance level 3420, support level 3375
One-hour chart resistance level 3402, support level 3375.
Gold rose sharply on Monday, fluctuated upward in the Asian session, and the NY market accelerated its rise, with the daily line rising sharply to 3400. The fundamentals of the bull market have not changed, and this time it is believed that the factor that triggered the unilateral rise is the expectation of the Fed's interest rate cut. Yesterday I mentioned that the 1-hour bottom structure appeared, and a new bullish opportunity appeared again!
Yesterday's idea was very clear. The Asian session stepped back to confirm the top and bottom conversion support level of 3344, and finally the NY market rose sharply, directly breaking through the key position of 3377.
Gold price stood firm at 3360, preparing to break through the key position of 3377 and then accelerate its rise. Yesterday's increase broke through the highest level in the past month. After all, the strength after the breakout after such a long period of volatility will not be small. In the previous few trading days, it returned to the previous high to complete the conversion of top and bottom. Today, pay attention to the support of the top and bottom conversion position of 3377. If it falls back during the day, you can continue to buy on dips based on the support of 3375. The bulls are accumulating momentum to break through the suppression of the 3400 mark. If it stands firm at 3400 after the breakthrough, it will be a large-scale increase.
In terms of intraday operations, buy more near 3377/75 after the retracement.
Buy: 3375 near
Buy: 3402near

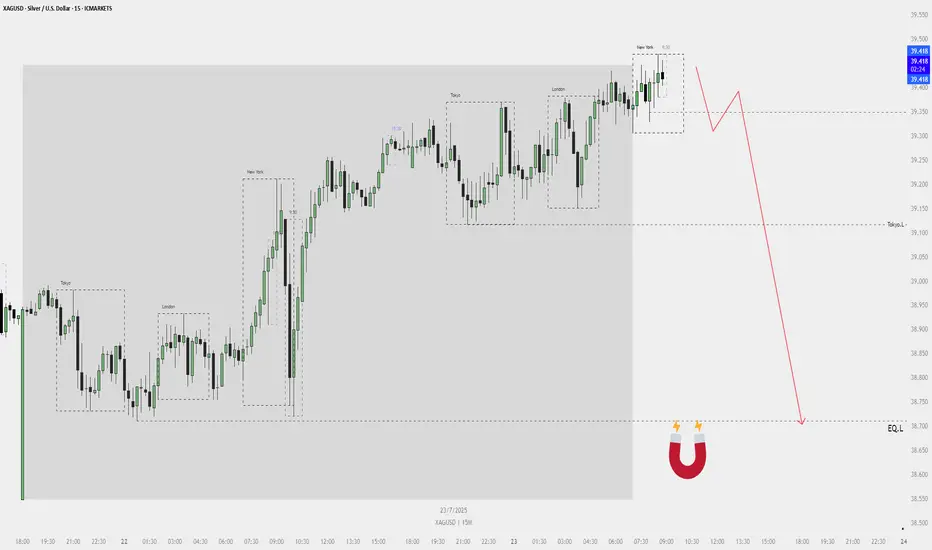
XAGUSD Sell Plan – 15M📉 XAGUSD Sell Plan – 15M
Bias: Bearish
Timeframe: 15-Minute
Date: July 23, 2025
🧠 Reasoning
Liquidity Grab: Price is sweeping short-term highs during New York open.
No More FVGs Above: Price seems to be exhausting upward momentum.
Magnet Below:
Equal lows (EQ_L) acting as a liquidity pool.
Tokyo low also lies below current price — another liquidity target.
High Probability Setup: Clean structure with a likely rejection from current premium zone.
🔴 Sell Strategy (Conceptual)
Wait for a minor liquidity grab or rejection wick to trap buyers.
Confirm a market structure shift or bearish order block.
Sell from that zone aiming for:
🎯 Target 1: Tokyo Low
🎯 Target 2: Equal Lows (Magnet zone)
⚠️ No SL/TP levels shown — trade based on structure and confirmation using your entry system (e.g., 5M DR, bearish FVG, etc.).
TRXUSDT Long SwingBINANCE:TRXUSDT Long Swing Trade, with my back testing of this strategy, it hits multiple possible take profits, manage your position accordingly.
This is good trade, don't overload your risk like greedy, be disciplined trader.
I manage trade on daily basis.
Use proper risk management
Looks like good trade.
Lets monitor.
Use proper risk management.
Disclaimer: only idea, not advice

NZDUSD Short SwingOANDA:NZDUSD Short Swing Trade, with my back testing of this strategy, it hits multiple possible take profits, manage your position accordingly.
This is good trade, don't overload your risk like greedy, be disciplined trader.
I manage trade on daily basis.
this is good trade, lets see, don't be greedy, risk what you can afford.
Use proper risk management
Looks like good trade.
Lets monitor.
Use proper risk management.
Disclaimer: only idea, not advice

update : BTC/USD : WATCH TIME
Bitcoin
7 minutes ago
BTC/USD: Phase 9 In Progress – Watch Time
0
7 minutes ago
BTC has completed its impulsive and correction phases. Now it’s deep into Phase 9, the distribution phase ...
🧭 Bias: Long
📆 Daily Cycle:
Phase 3: Apr 5 – May 26 (40 bars)
Phase 6: May 26 – Jul 2 (12 bars)
Phase 9: Jul 2 → Expected until Aug 6
Now forming 3 internal sub-cycles (1H chart) = as explained on the chart by green trend info lines.
📍 Buy Zone: 118098 – 118827
🛡️ Stop Loss: 117369
🎯 Target: 120850
📅 Before Friday, July 25.
reason: this is the dip it shouldn't goback
The market doesn’t care what you “feel.”
It respects the clock.

BTC/USD: Phase 9 In Progress – Watch TimeBTC has completed its impulsive and correction phases. Now it’s deep into Phase 9, the distribution phase ...
🧭 Bias: Long
📆 Daily Cycle:
Phase 3: Apr 5 – May 26 (40 bars)
Phase 6: May 26 – Jul 2 (12 bars)
Phase 9: Jul 2 → Expected until Aug 6
Now forming 3 internal sub-cycles (1H chart) = as explained on the chart by green trend info lines.
📍 Buy Zone: 118098 – 118827
🛡️ Stop Loss: 117369
🎯 Target: 120850
📅 Before Friday, July 25.
reason: this is the dip it shouldn't goback
The market doesn’t care what you “feel.”
It respects the clock.

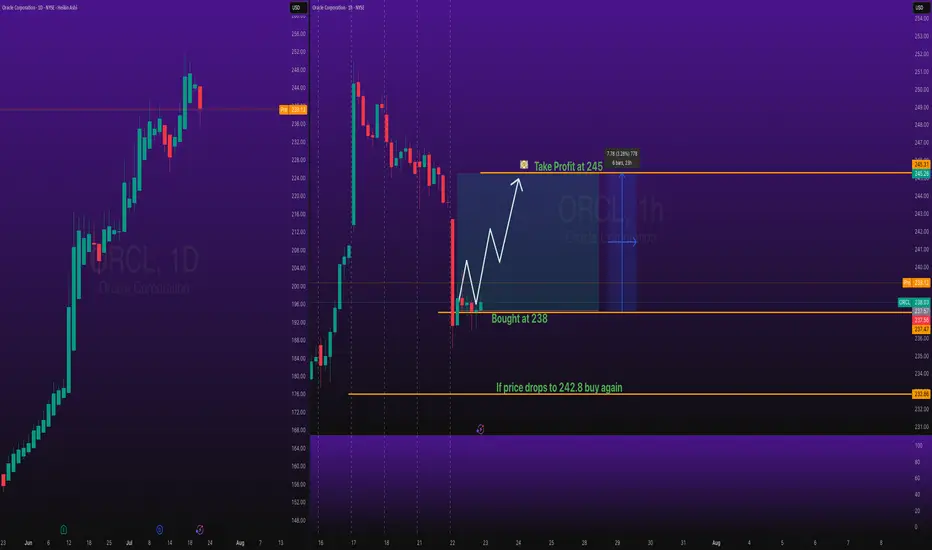
Oracle Buy Trade with Take Profit Stocks SPOT ACCOUNT:
NYSE:ORCL stocks my buy trade with take profit.
This is my SPOT Accounts for Stocks Portfolio.
Trade shows my Buying and Take Profit Level.
Spot account doesn't need SL because its stocks buying account
USD/JPY FORCAST 23-7📉 On the daily timeframe, price action confirms a potential start of a new bearish cycle.
🔄 Previous Cycle Breakdown:
Phase 3 (Impulsive Downtrend):
📅 Jan 8 → Mar 6
⏱️ ~41 daily candles
Phase 6 (Correction):
📅 Mar 6 → Mar 30
⏱️ ~20 daily candles
Phase 9 (Distribution/Exhaustion):
📅 ~16 daily candles, ending Apr 21
This marked the completion of a full cycle, triggering a shift in behavior.
🔁 What happened next?
A Reaccumulation / Manipulation phase began immediately after the cycle ended — which is normal after full cycle completion.
This reaccumulation lasted around 62 daily candles, building up pressure and liquidity.
> 80% of market movement is corrective or consolidative.
Only 20% (or less) is pure trend.
If you’re only looking for trends, you’re missing the actual map.
⚠️ Current Outlook: on the 1hr timeframe
As we now enter the final time pivot of the month — specifically beginning July 22 at 16:00 —
the market is signaling the start of a new Phase 3 (bearish impulsive wave).
usd/jpy may reach 141.453 before 1st of August.
I think this is the time to sell usd , or buy any other currencies or metal against usd
What’s your view? Are you trading with time or against it?

update : usd/jpy forcast 23th Jul📉 On the daily timeframe, price action confirms a potential start of a new bearish cycle.
🔄 Previous Cycle Breakdown:
Phase 3 (Impulsive Downtrend):
📅 Jan 8 → Mar 6
⏱️ ~41 daily candles
Phase 6 (Correction):
📅 Mar 6 → Mar 30
⏱️ ~20 daily candles
Phase 9 (Distribution/Exhaustion):
📅 ~16 daily candles, ending Apr 21
This marked the completion of a full cycle, triggering a shift in behavior.
🔁 What happened next?
A Reaccumulation / Manipulation phase began immediately after the cycle ended — which is normal after full cycle completion.
This reaccumulation lasted around 62 daily candles, building up pressure and liquidity.
> 80% of market movement is corrective or consolidative.
Only 20% (or less) is pure trend.
If you’re only looking for trends, you’re missing the actual map.
⚠️ Current Outlook: on the 1hr timeframe
As we now enter the final time pivot of the month — specifically beginning July 22 at 16:00 —
the market is signaling the start of a new Phase 3 (bearish impulsive wave).
usd/jpy may reach 141.453 before 1st of August.
I think this is the time to sell usd , or buy any other currencies or metal against usd
What’s your view? Are you trading with time or against it?

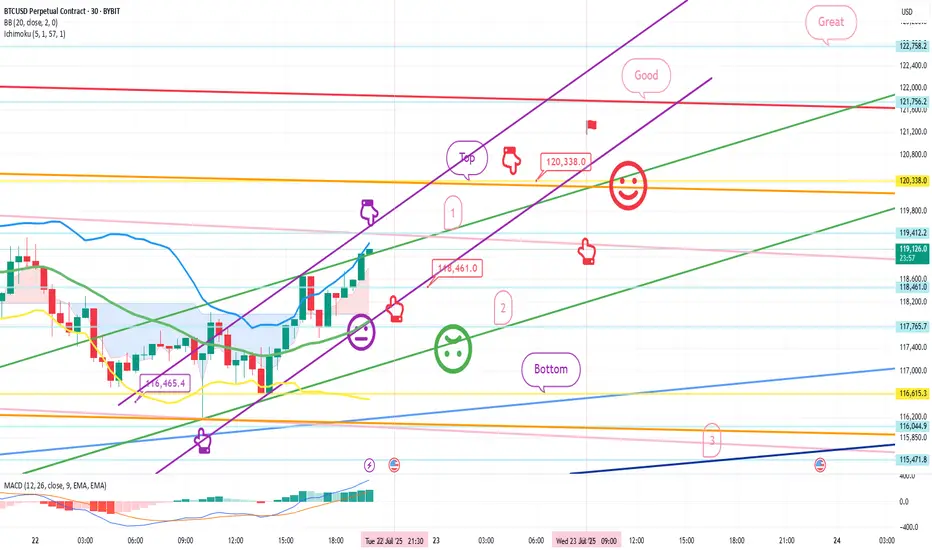
July 22 Bitcoin Bybit chart analysisHello
It's a Bitcoin Guide.
If you "follow"
You can receive real-time movement paths and comment notifications on major sections.
If my analysis was helpful,
Please click the booster button at the bottom.
This is Bitcoin's 30-minute chart.
Nasdaq indicators will be released at 9:30 in a little while.
Although Bitcoin's mid-term pattern is broken,
it looks like a strong upward trend based on signals and candlestick positions.
In the case of Nasdaq, the 6-hour and 12-hour charts MACD dead cross is in progress,
and even if there is no plunge and only a sideways movement,
it seems likely that today's strategy will be successful.
In the bottom left, from the analysis article on the 18th,
the final long position entry point of $116,465.4 Bottom
is connected as is.
*Red finger movement path
One-way long position strategy
1. $118,461.9 long position entry section / green support line breakout, stop loss price
2. $120,338 long position 1st target -> Good, Great in order of target price
See the 1st section at the top as a touch section for an upward wave rather than a short position entry,
and if this section breaks through right away, an upward trend can be connected.
If the purple parallel line support line is maintained without breaking away,
there is a possibility of a vertical rise.
If the top section is touched,
after the first liquidation,
it would be good to use the 1st section to re-enter a long position.
The 2nd section at the bottom is important,
and if it is pushed to this section according to the movement of Nasdaq today,
it can fall strongly.
Please check the real-time support line shape.
From the breakout, Bottom -> 3 sections are open.
If you touch the 3rd section after tomorrow, the mid-term pattern will be restored.
This is the 12+ day section.
Up to this point, I ask that you simply use my analysis for reference and use only.
I hope that you will operate safely with the principle of trading and stop loss.
Thank you.
SELL PLAN – XTIUSD (15M)📉 SELL PLAN – XTIUSD (15M)
🗓️ Date: 23 July 2025
⏱️ Timeframe: 15-Minute
🔍 Context & Reasoning:
HTF Supply Zone (Red Zone)
Price entered the red HTF zone (noted as “4H T2,3,4”) and showed rejection.
This zone aligns with potential 4H Fair Value Gaps / Supply.
Sweep & Rejection
Liquidity sweep above previous highs followed by immediate bearish reaction.
Entry Confirmation
Bearish engulfing candle formed inside the HTF zone.
Price closed below 15M EMA (blue line) showing bearish momentum.
Dealing Range Valid
DR formed after rejection of the HTF zone.
Short-term bullish FVG created and violated.
Bearish FVG confirms continuation.
🎯 Entry Details:
Entry Price: ~66.12
Stop Loss: ~66.58 (Above HTF rejection zone)
Take Profit: ~65.12 (Near Weekly TP level)
🧠 Confluences:
Rejection from 4H Supply
Price closed below EMA
Clear swing failure / liquidity grab
DR confirmation on 15M
Multiple FVGs and breaker structure supporting the move
📌 Risk Management:
Risk-to-Reward: 1:2+
Risk per trade: Max 1%
If in drawdown: Use 0.5%

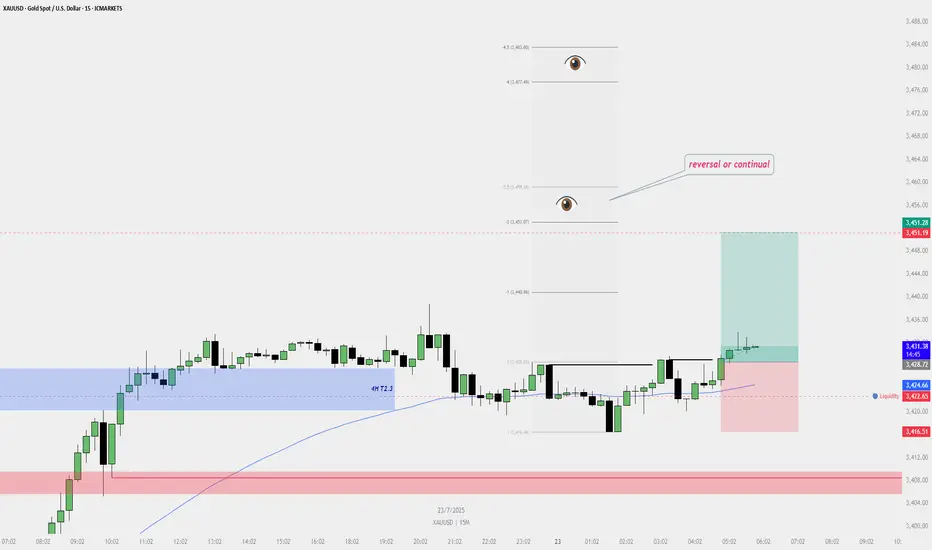
Buy Plan – XAUUSD (Gold Spot) | 15M Chart📈 Buy Plan – XAUUSD (Gold Spot) | 15M Chart
Entry Reason:
Price reclaimed liquidity below the internal range and formed a bullish shift in structure. A valid bullish dealing range was confirmed, supported by the 200 EMA and 4H T2.3 zone.
✅ Entry Zone:
➤ Entry taken after confirmation above short-term swing high
➤ Liquidity sweep confirmed below M15 consolidation
➤ Bullish FVG + support from HTF zone
🎯 Target:
TP1: 3,440.86 (1R)
TP2: 3,451.07 to 3,459.18 (Eyes above – possible reversal or continuation zone)
🛑 Stop Loss:
Placed below most recent swing low: 3,416.51
Below liquidity & invalidation of bullish structure
🧠 Bias:
Bullish (short-term continuation expected)
Reclaim above EMA and HTF zone respected
📌 Key Notes:
Watch price behavior near 3,451.07–3,459.18 for potential reversal or breakout
If price fails to maintain strength above 3,440, consider locking partial profits
Monitor 15M and 1H structure for any sign of internal break
DAX / DE30 Long Day TradeXETR:DAX / ICMARKETS:DE30 taking a pullback towards up, catching this pullback.
These are good levels if you trade nicely.
Use proper risk management
Looks like good trade.
Lets monitor.
Use proper risk management.
Disclaimer: only idea, not advice

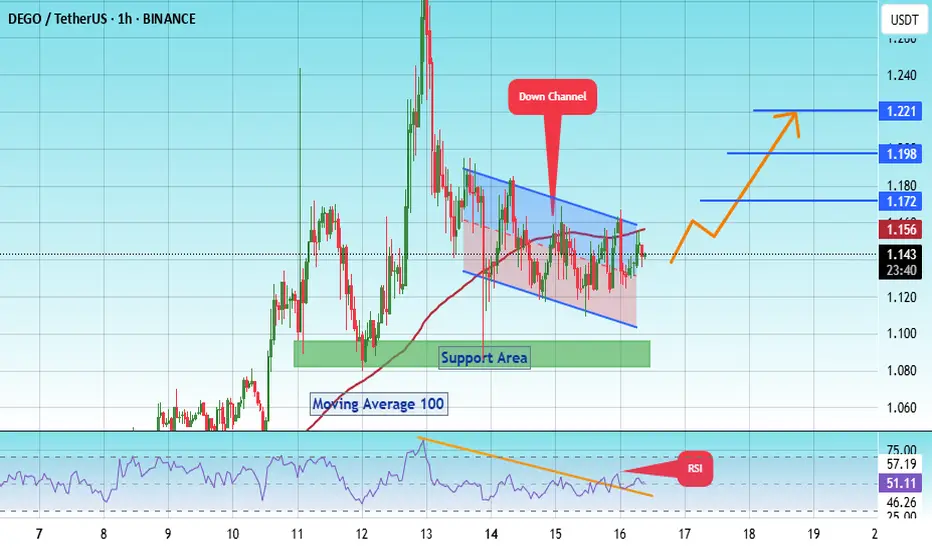
#DEGO/USDT – Bullish Breakout Setup | 1H Chart Analys#DEGO
The price is moving within a descending channel on the 1-hour frame, adhering well to it, and is heading for a strong breakout and retest.
We are experiencing a bounce from the lower boundary of the descending channel. This support is at 1.10.
We have a downtrend on the RSI indicator that is about to be broken and retested, supporting the upside.
There is a major support area in green at 1.08, which represents a strong basis for the upside.
Don't forget a simple thing: ease and capital.
When you reach the first target, save some money and then change your stop-loss order to an entry order.
For inquiries, please leave a comment.
We are in a consolidation trend above the 100 Moving Average.
Entry price: 1.14.
First target: 1.17.
Second target: 1.20.
Third target: 1.22.
Don't forget a simple thing: ease and capital.
When you reach the first target, save some money and then change your stop-loss order to an entry order.
For inquiries, please leave a comment.
Thank you.