EURJPY SHORT FORECAST Q2 W24 D10 Y25EURJPY SHORT FORECAST Q2 W24 D10 Y25
Professional Risk Managers👋
Welcome back to another FRGNT chart update📈
Diving into some Forex setups using predominantly higher time frame order blocks alongside confirmation breaks of structure.
Let’s see what price action is telling us today! 👀
💡Here are some trade confluences📝
✅Weekly 50 EMA target
✅15' Order block identification
✅Daily Order block rejection
✅Ultimate high short
🔑 Remember, to participate in trading comes always with a degree of risk, therefore as professional risk managers it remains vital that we stick to our risk management plan as well as our trading strategies.
📈The rest, we leave to the balance of probabilities.
💡Fail to plan. Plan to fail.
🏆It has always been that simple.
❤️Good luck with your trading journey, I shall see you at the very top.
🎯Trade consistent, FRGNT X
Gann

USDCAD SHORT FORECAST Q2 W24 D10 Y25🔥👀USDCAD SHORT FORECAST Q2 W24 D10 Y25
TECHNICAL HOTPICK ! 💥💥
Professional Risk Managers👋
Welcome back to another FRGNT chart update📈
Diving into some Forex setups using predominantly higher time frame order blocks alongside confirmation breaks of structure.
💡Here are some trade confluences📝
✅4H order block rejection
✅HTF 50 EMA
✅Intraday bearish breaks of structure to be identified
✅15’ order block identified
🔑 Remember, to participate in trading comes always with a degree of risk, therefore as professional risk managers it remains vital that we stick to our risk management plan as well as our trading strategies.
📈The rest, we leave to the balance of probabilities.
💡Fail to plan. Plan to fail.
🏆It has always been that simple.
❤️Good luck with your trading journey, I shall see you at the very top.
🎯Trade consistent, FRGNT X

USDCHF LONG FORECAST Q2 W24 D10 Y25👀 USDCHF LONG FORECAST Q2 W24 D10 Y25
🔥HOT PICK ALERT 🔥
Professional Risk Managers👋
Welcome back to another FRGNT chart update📈
Diving into some Forex setups using predominantly higher time frame order blocks alongside intraday confirmation & breaks of structure.
Let’s see what price action is telling us today! 🔥
💡Here are some trade confluences📝
✅Weekly order block rejection
✅Daily order block rejection
✅15’ order block
✅Intraday bullish breaks of structure
🔑 Remember, to participate in trading comes always with a degree of risk, therefore as professional risk managers it remains vital that we stick to our risk management plan as well as our trading strategies.
📈The rest, we leave to the balance of probabilities.
💡Fail to plan. Plan to fail.
🏆It has always been that simple.
❤️Good luck with your trading journey, I shall see you at the very top.
🎯Trade consistent, FRGNT X

EURUSD SHORT FORECAST Q2 W24 D10 Y25EURUSD SHORT FORECAST Q2 W24 D10 Y25
Professional Risk Managers👋
Welcome back to another FRGNT chart update📈
Diving into some Forex setups using predominantly higher time frame order blocks alongside confirmation breaks of structure.
Let’s see what price action is telling us today!
💡Here are some trade confluences📝
✅Weekly order block
✅15' order block
✅4 hour order block
✅Tokyo ranges to be filled
🔑 Remember, to participate in trading comes always with a degree of risk, therefore as professional risk managers it remains vital that we stick to our risk management plan as well as our trading strategies.
📈The rest, we leave to the balance of probabilities.
💡Fail to plan. Plan to fail.
🏆It has always been that simple.
❤️Good luck with your trading journey, I shall see you at the very top.
🎯Trade consistent, FRGNT X

GBPUSD SHORT FORECAST Q2 W24 D10 Y25GBPUSD SHORT FORECAST Q2 W24 D10 Y25
Professional Risk Managers👋
Welcome back to another FRGNT chart update📈
Diving into some Forex setups using predominantly higher time frame order blocks alongside confirmation breaks of structure.
Let’s see what price action is telling us today!
💡Here are some trade confluences📝
✅Weekly order block
✅15' order block
✅Intraday 15' break of structure
✅Tokyo ranges to be filled
🔑 Remember, to participate in trading comes always with a degree of risk, therefore as professional risk managers it remains vital that we stick to our risk management plan as well as our trading strategies.
📈The rest, we leave to the balance of probabilities.
💡Fail to plan. Plan to fail.
🏆It has always been that simple.
❤️Good luck with your trading journey, I shall see you at the very top.
🎯Trade consistent, FRGNT X

#ARB/USDT#ARB
The price is moving within a descending channel on the 1-hour frame and is expected to break and continue upward.
We have a trend to stabilize above the 100 moving average once again.
We have a downtrend on the RSI indicator, which supports the upward move by breaking it upward.
We have a support area at the lower limit of the channel at 0.3210, acting as strong support from which the price can rebound.
Entry price: 0.3250
First target: 0.3406
Second target: 0.3510
Third target: 0.3667

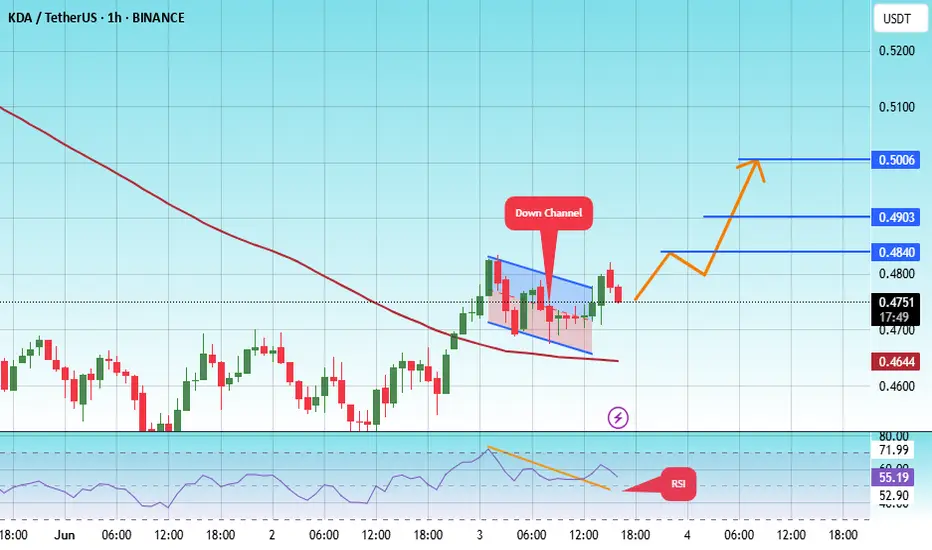
#KDA/USDT#KDA
The price is moving within a descending channel on the 1-hour frame, adhering well to it, and is heading for a strong breakout and retest.
We are experiencing a rebound from the lower boundary of the descending channel. This support is at 0.4670.
We are experiencing a downtrend on the RSI indicator, which is about to break and retest, supporting the upward trend.
We are looking for stability above the 100 Moving Average.
Entry price: 0.4764
First target: 0.4840
Second target: 0.4900
Third target: 0.5000
#PEOPLE/USDT#PEOPLE
The price is moving within a descending channel on the 1-hour frame, adhering well to it, and is heading for a strong breakout and retest.
We are seeing a bounce from the lower boundary of the descending channel, which is support at 0.02420.
We have a downtrend on the RSI indicator that is about to be broken and retested, supporting the upward trend.
We are looking for stability above the 100 Moving Average.
Entry price: 0.02475
First target: 0.02650
Second target: 0.02780
Third target: 0.02930

#PEOPLE/USDT#PEOPLE
The price is moving within a descending channel on the 1-hour frame and is expected to break and continue upward.
We have a trend to stabilize above the 100 moving average once again.
We have a downtrend on the RSI indicator, which supports the upward move by breaking it upward.
We have a support area at the lower limit of the channel at 0.01980, acting as strong support from which the price can rebound.
Entry price: 0.02040
First target: 0.02086
Second target: 0.02135
Third target: 0.02185

CHECK GBPJPY SIGNAL READ CAPTION( gbpjpy) BUY zone
( trade satup )
entry point (194.933) to (195.103) 📊
first tp (195.440)📊
2nd target (195.800) 📊
last target (196.200) 📊
stop loss (194.615)❌

#DOGS/USDT#DOGS
The price is moving within a descending channel on the 1-hour frame and is expected to break and continue upward.
We have a trend to stabilize above the 100 moving average once again.
We have a downtrend on the RSI indicator that supports the upward move with a breakout.
We have a support area at the lower boundary of the channel at 0.0001400, acting as strong support from which the price can rebound.
Entry price: 0.0001412
First target: 0.0001465
Second target: 0.0001511
Third target: 0.0001570

Trading Gold with Leverage: Smart or Dangerous?XAUUSD trading (Gold vs. US Dollar) is a popular choice among global traders due to its high liquidity, strong volatility, and profit potential. One of the tools that help traders amplify their returns is financial leverage. However, using leverage also carries significant risks if not managed properly. So, what exactly is leverage in XAUUSD trading? Should you use it? Let’s explore the advantages and disadvantages below.
1. What is Leverage in XAUUSD Trading?
Leverage is a financial tool that allows traders to control a larger position in the market than the capital they actually own. For example, with 1:100 leverage, you only need $1,000 to trade a position worth $100,000.
In the XAUUSD market, brokers often offer leverage ranging from 1:50 to 1:500, or even up to 1:2000—depending on their risk policies and regulations.
2. Pros of Using Leverage in XAUUSD Trading
🔹 Amplifies Potential Profits
Leverage allows traders to maximize profits with a relatively small amount of capital. When the market moves in the expected direction, the gains can be multiplied significantly.
🔹 Lower Capital Requirement
Instead of needing $10,000 to trade 1 lot of gold, a trader may only need $100–$500 depending on the leverage. This lowers the entry barrier and offers greater flexibility in capital management.
🔹 Enables Strategy Diversification
With the same amount of capital, traders can open multiple positions across different timeframes or strategies. Leverage allows for broader portfolio diversification while still maintaining control over total risk.
🔹 Takes Advantage of Short-Term Opportunities
Gold markets often react strongly to news and economic data. Leverage lets traders capitalize on short-term price swings, enabling faster profits without needing to hold positions long-term.
3. Cons and Risks of Using Leverage in XAUUSD Trading
Risk of Account Blowout
The higher the leverage, the lower the safety margin. A small market move against the position can trigger a margin call or stop-out, resulting in a full loss of the initial capital.
Emotional and Psychological Stress
High leverage often leads traders to gamble instead of follow a strategy, increasing the likelihood of emotional decisions and impulsive trading behaviors.
Difficult to Manage During Volatility
XAUUSD is a highly volatile asset, especially during U.S. sessions or major news releases (like CPI, Fed announcements, NFP). Over-leveraging can lead to rapid losses in seconds during sudden price spikes.
Increased Emotional Pressure
When using high leverage, every small fluctuation feels significant, causing stress and encouraging poor decisions—like exiting too early or revenge trading.
4. Conclusion: Should You Use Leverage in XAUUSD Trading?
Yes, but only with a disciplined and strategic approach.
Use moderate leverage (e.g. 1:100 or lower if you're a beginner)
Always set clear stop-loss and take-profit levels
Risk no more than 2% of your account per trade
Avoid “all-in” trades and don’t let emotions dictate position size
In Summary
Leverage in XAUUSD trading is a double-edged sword. Used wisely, it accelerates your profit potential. Used recklessly, it can wipe out your account in moments. The key is to trade with discipline, knowledge, and a solid plan to harness the power of leverage without falling into its traps.

Trader Abdullah Masood Yu.TuIO/USDT pair on a 15-minute chart, and it looks like you're using LuxAlgo Fair Value Gaps, key levels/zones, and a lot of structural plotting to identify trade opportunities.
Observations:
Current Price: ~0.799 USDT
Just Rejected: From a significant 4H bearish fair value gap (FVG) zone around 0.807–0.820
Support Zones Below: Several green zones and liquidity blocks are stacked between 0.74–0.78
Key Resistance: Around 0.810–0.820
Label “TURTLE FK”** around 0.792 suggests a prior liquidity or manipulation area (possibly a sweep zone)
What You Can Do Now:
🔴 Bearish Case (Short Bias):
If you believe the rejection from the 4H FVG holds:
Short Entry Around 0.799–0.807 (if price pulls back again)
Stop-Loss: Just above the FVG zone (e.g., 0.821)
Target 1: ~0.792 (“TURTLE” zone — potential liquidity sweep)
Target 2: ~0.774
Final Target: Deeper green liquidity area around 0.750–0.740
You could also look for a break in structure on lower timeframes for added confirmation.
🟢 Bullish Case (Long Bias):
If you think the retracement is temporary and price will reclaim the FVG:
Long Entry: Only if price reclaims above 0.807 with strong volume
Stop-Loss: Below 0.793
Target 1: 0.817 (top of the FVG)
Target 2: 0.830 (clean breakout)
Neutral Plan (If You’re Unsure):
Wait for price to decisively break above 0.807 or fall below 0.789
Consider setting alerts at:
📈 > 0.807 (bullish breakout confirmation)
📉 < 0.789 (bearish breakdown into lower liquidity zones)

XAUUSDXAUUSD rejected the daily uptrend so we gonna keep pushing to the upside
Next stop its 3500 at least

10 june Nifty50 brekout and Breakdown leval
🔼 Call Option (CE) Buy Levels:
Above 25,030 (Risky Zone)
"10m hold CE by RISKY ZONE"
Above 25,190 (Positive Trade View Zone)
Confirm bullishness and enter CE trades cautiously.
25,270"Above 10m hold CE by zone" – Strong confirmation.
25,390"Above 10m Closing Shot cover Possible" – Higher breakout level.
🔽 Put Option (PE) Buy Levels:
Below 25,030
"Below 10m hold PE by Zone"
Below 25,190
"Below nigetive trade view" – Sentiment turning bearish.
25,270 Below 10m PE by Risky Zone" – Confirmation of downward pressure.
Below 25,390 10m PE By Safe Zone" – Strong PE entry.
✅ Extra Key Zones:
Opening Support: 25,070
Opening Resistance: 25,030
CE Safe Zone: Above 24,970
Below 24,970: Possible unwinding (strong downside)

Silver's Next Supercycle: $200+ by 2031?Silver has twice hit the $50 mark — once in 1980 and again in 2011. Today, it trades around $35, but the technical landscape is shifting fast.
At Vital Direction, our long-term Elliott Wave and Gann analysis signals a major breakout cycle already underway.
🌀 Wave structure suggests a multi-year impulsive rally
📐 Gann angles align with historic turning points
💥 Target: $200+ by 2031 (conservative)
⚙️ Backed by growing industrial demand, inflation risks, and monetary instability
This isn’t just a metal — it’s a macro opportunity.
