AUDUSD Q3 | D23 | W30 | Y25📊AUDUSD Q3 | D23 | W30 | Y25
Daily Forecast🔍📅
Here’s a short diagnosis of the current chart setup 🧠📈
Higher time frame order blocks have been identified — these are our patient points of interest 🎯🧭.
It’s crucial to wait for a confirmed break of structure 🧱✅ before forming a directional bias.
This keeps us disciplined and aligned with what price action is truly telling us.
📈 Risk Management Protocols
🔑 Core principles:
Max 1% risk per trade
Only execute at pre-identified levels
Use alerts, not emotion
Stick to your RR plan — minimum 1:2
🧠 You’re not paid for how many trades you take, you’re paid for how well you manage risk.
🧠 Weekly FRGNT Insight
"Trade what the market gives, not what your ego wants."
Stay mechanical. Stay focused. Let the probabilities work.
FRGNT
Gann

AUDCAD Q3 | D23 | W30 | Y25📊AUDCAD Q3 | D23 | W30 | Y25
Daily Forecast🔍📅
Here’s a short diagnosis of the current chart setup 🧠📈
Higher time frame order blocks have been identified — these are our patient points of interest 🎯🧭.
It’s crucial to wait for a confirmed break of structure 🧱✅ before forming a directional bias.
This keeps us disciplined and aligned with what price action is truly telling us.
📈 Risk Management Protocols
🔑 Core principles:
Max 1% risk per trade
Only execute at pre-identified levels
Use alerts, not emotion
Stick to your RR plan — minimum 1:2
🧠 You’re not paid for how many trades you take, you’re paid for how well you manage risk.
🧠 Weekly FRGNT Insight
"Trade what the market gives, not what your ego wants."
Stay mechanical. Stay focused. Let the probabilities work.
FRGNT

GBPUSD Q3 | D23 | W30 | Y25📊GBPUSD Q3 | D23 | W30 | Y25
Daily Forecast🔍📅
Here’s a short diagnosis of the current chart setup 🧠📈
Higher time frame order blocks have been identified — these are our patient points of interest 🎯🧭.
It’s crucial to wait for a confirmed break of structure 🧱✅ before forming a directional bias.
This keeps us disciplined and aligned with what price action is truly telling us.
📈 Risk Management Protocols
🔑 Core principles:
Max 1% risk per trade
Only execute at pre-identified levels
Use alerts, not emotion
Stick to your RR plan — minimum 1:2
🧠 You’re not paid for how many trades you take, you’re paid for how well you manage risk.
🧠 Weekly FRGNT Insight
"Trade what the market gives, not what your ego wants."
Stay mechanical. Stay focused. Let the probabilities work.
FRGNT

EURUSD Q3 | D23 | W30 | Y25📊EURUSD Q3 | D23 | W30 | Y25
Daily Forecast🔍📅
Here’s a short diagnosis of the current chart setup 🧠📈
Higher time frame order blocks have been identified — these are our patient points of interest 🎯🧭.
It’s crucial to wait for a confirmed break of structure 🧱✅ before forming a directional bias.
This keeps us disciplined and aligned with what price action is truly telling us.
📈 Risk Management Protocols
🔑 Core principles:
Max 1% risk per trade
Only execute at pre-identified levels
Use alerts, not emotion
Stick to your RR plan — minimum 1:2
🧠 You’re not paid for how many trades you take, you’re paid for how well you manage risk.
🧠 Weekly FRGNT Insight
"Trade what the market gives, not what your ego wants."
Stay mechanical. Stay focused. Let the probabilities work.
FRGNT

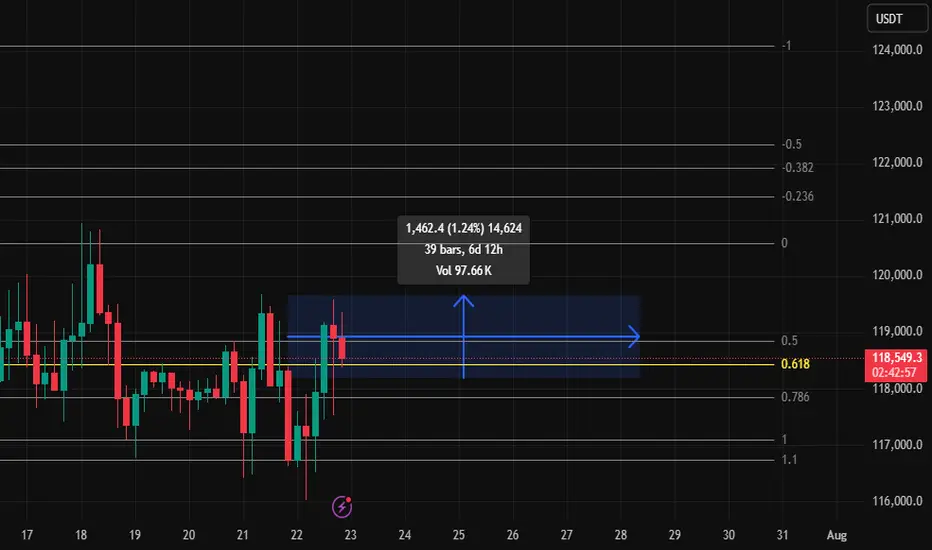
Can BTC Reclaim 118,700?1% a day can near 400% my life.
I Spot Longed BTC looking for a 1% up, might take awhile but, BTC is king, I will wait. and when it hits, a couple of memes have retraced on the daily, I will be looking for more riskier memes for a higher %pump.
USCAD Q3 | D23 | W30 | Y25📊USCAD Q3 | D23 | W30 | Y25
Daily Forecast🔍📅
Here’s a short diagnosis of the current chart setup 🧠📈
Higher time frame order blocks have been identified — these are our patient points of interest 🎯🧭.
It’s crucial to wait for a confirmed break of structure 🧱✅ before forming a directional bias.
This keeps us disciplined and aligned with what price action is truly telling us.
📈 Risk Management Protocols
🔑 Core principles:
Max 1% risk per trade
Only execute at pre-identified levels
Use alerts, not emotion
Stick to your RR plan — minimum 1:2
🧠 You’re not paid for how many trades you take, you’re paid for how well you manage risk.
🧠 Weekly FRGNT Insight
"Trade what the market gives, not what your ego wants."
Stay mechanical. Stay focused. Let the probabilities work.
FRGNT

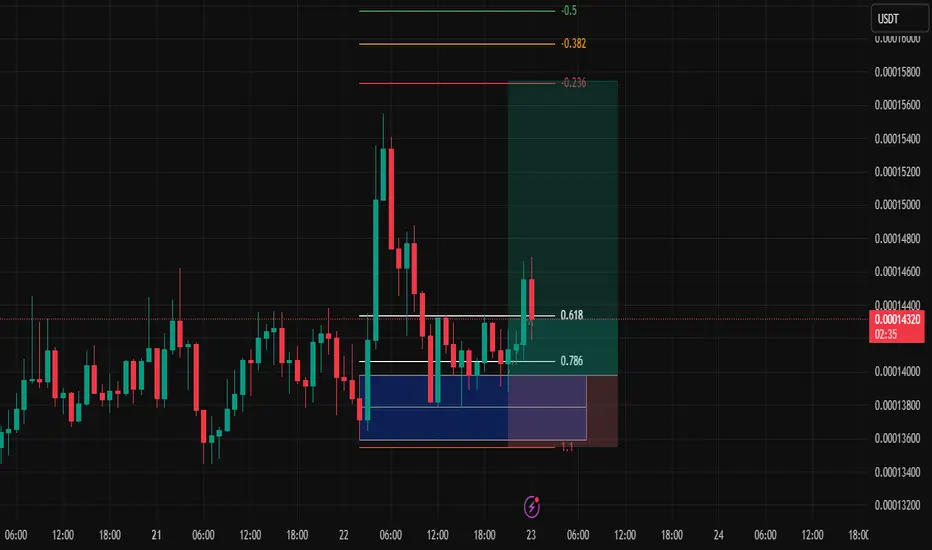
Consistency: The Pursuit of Happiness – Week 2, Trade #4📘 Week 2 – Trade #4
Strategy Journal | Futures Account**
Asset: \ BINANCE:FLOKIUSDT
Timeframe**: 1H
Entry Type**: Order Block (below the 0.786)
---
🧭 Context
This is Day 4 of my live journaling and strategy publishing process.
Normally, I don’t trade on Mondays or weekends—but recent schedule shifts had me checking the charts over the weekend and saw some SPOT trades to take on Monday. That work took up a lot of mental capital heading into Tuesday. Still, I wanted to stay consistent in the process, even if energy wasn’t fully focused on the charts.
Trade Setup & Strategy
I’ve been sitting in cash for a while. Today, I wasn’t actively hunting setups—I was waiting for one to come into my criteria , and this one did.
The asset: \ BINANCE:FLOKIUSDT
My usual entries are around the 0.618 retracement , but this time, I adjusted based on my internal bandwidth and risk sensitivity.
Instead, I entered below the 0.786 , directly on the order block.
Why?
Because when my mind isn’t 100% on the charts, I don’t want to overexpose myself. Order block entries reduce my stop size and allow for better risk-to-reward profiles. It’s a cleaner, more defensive entry compared to FVGs or mid-OTE zones.
So yes—I’ve gone a little off script from my usual 0.618 entries, but not outside the logic of the framework. It’s a tweak based on context and mental clarity.
📊 Market Structure & Bias
I’m looking for a run of the previous day’s high.
But here’s the wrinkle: that high is a Monday high. And Monday’s range often gets targeted later in the week, so there’s potential—but no guarantees.
London PM session consolidated.
NY AM lacked strong momentum.
That leaves NY PM or Wednesday Asia/NY as potential breakout windows.
I’m letting it run, no interference.
🔍 Risk, Entry, and Strategy Notes
Entry: Order Block, below 0.786
Bias: Take out previous day’s high
Timeframe: 1H
Stop: Tighter than my usual 0.618 entries
Mental Capital: Split between trading futures and Spot
Objective: Stay consistent with journaling and process
Trade Management: No touch. Let it do what it does.
📌 Reflections
This is a good representation of adapting the strategy without breaking it. Fewer trades, less risk, more focus—and ideally, cleaner results.
This also confirms something I’ve been leaning into:
> **I'd rather take fewer, higher-conviction trades at cleaner levels.**
Let’s see if this one plays out. Win or loss, the goal remains the same:
Consistency → Clarity → Repeatability.
---
Result to be published once the trade concludes.
This journal remains part of a longer strategy documentation series.
BTCUSD BULISH TRANDE Btuusd buy from 117,500
tp 118,500
tp 119,500
tp 120,590
Stope Lose 116,000
TRADE AT YOUR OWN RISK

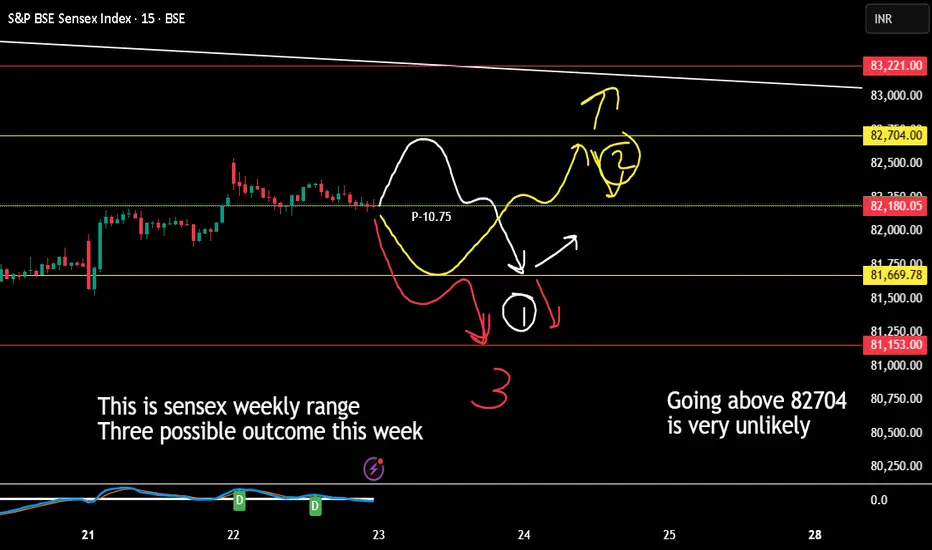
Sensex Weekly Expiry (applicable only till 29th July 2025)1. If Market VIx is less than pivot point then any price coming near pivot line or above is an opportunity to short.
2. Coming to half line below the pivot is highly possible by 80% by 24th July 2025 if not today.
3. That half line point will decide the market direction and any closing below in day to day bassis will indicate weak market.
I am expecting reversal or bulls to enter on 25th july or else by 28th July 2025
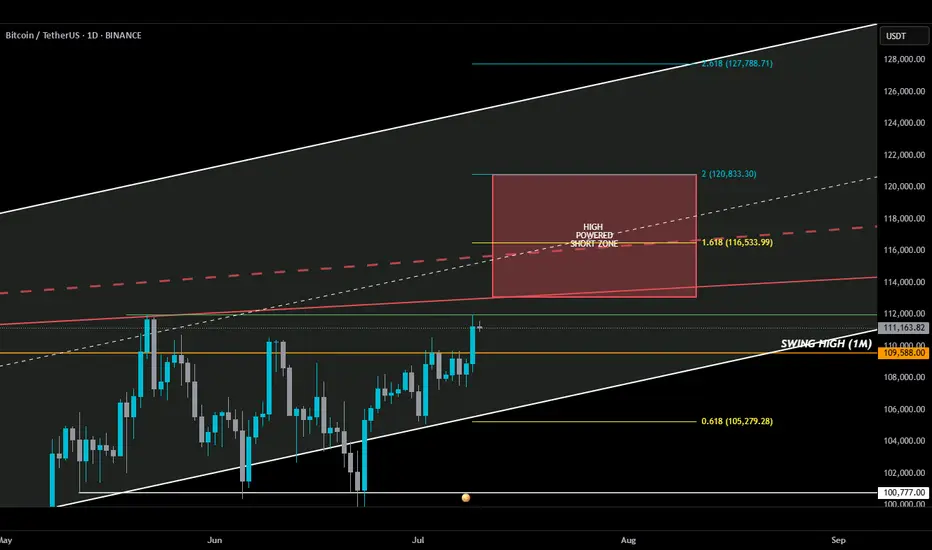
HIGH POWERED SHORT ZONE 2.0HIGH POWERED SHORT ZONE ⚡️
Usually, a 3% move doesn’t make anyone blink—but this one? It sent BTC into all-time high territory. I almost popped the champagne… until I remembered I’m in a short.
Not because I don’t believe in upside—but because my add zone in the HIGH POWERED SHORT ZONE hasn’t been tagged. Yet.
Here’s the breakdown 🧵👇
________________________________________
Before anyone goes bUCK wilD and cracks open that dusty bottle of Veuve, double-check something:
📅 The July 10th daily candle needs to close above the monthly swing high (orange line).
If BTC bulls lock that in, then a move deeper into the HIGH POWERED SHORT ZONE becomes real...
play-the-game real…
________________________________________
Where’s this HIGH POWERED SHORT ZONE coming from?
🔻 Solid red line – a trendline from Dec 2024 that has held strong through three separate tests — marking it as a key line on the sand.
🔻 Dashed red line – goes all the way back to Dec 2017. A seasoned veteran of resistance.
I also drew in a white ascending channel—not just for looks. If BTC breaks out, this channel will help us ask:
“How high is too high?”
________________________________________
Now enters Fibonacci — where nature maps out key alignments on the chart. 🌱
🟡 Gold lines = Fib golden ratios
🔵 Teal lines = Fib Degen Ratios
It’s wild how they just line up:
• 2.618? Right on the top of the channel.
• 1.618? Sitting on the 2017 trendline.
• 0.618? Near current support + bottom of the channel.
Also had to draw that horizontal support white line to keep an eye on.
A Bounce or bust? Ask the bUCKmOON!
Title: Buy Trade Strategy for ACH: Powering the Future of CryptoDescription:
This trading idea highlights ACH, the native token of the Alchemy Pay ecosystem, a project focused on bridging the gap between fiat and crypto through seamless payment solutions. ACH enables fast, low-cost transactions and supports real-world utility by integrating with global merchants and payment gateways. With partnerships spanning major platforms and growing adoption in Asia and beyond, Alchemy Pay positions itself as a key player in driving cryptocurrency adoption for everyday use. The project’s mission to enable crypto-to-fiat conversions for businesses and consumers gives ACH strong utility and growth potential.
Still, the crypto market remains highly volatile, and the value of ACH can be influenced by global economic trends, competition, regulatory frameworks, and evolving market sentiment. Like all digital assets, ACH carries risks that must be carefully considered.
Disclaimer:
This trading idea is for educational purposes only and should not be considered financial advice. Investing in cryptocurrencies such as ACH involves significant risk, including the potential for total capital loss. Always perform your own research, assess your financial situation, and consult a licensed financial advisor before making investment decisions. Past performance is not indicative of future results.

TRUMPUSDT – Explosion Loading...TRUMPUSDT is showing strong confluence between Elliott Wave and Gann techniques, suggesting a potential breakout phase is underway. The WXY corrective structure has matured, and price is unfolding impulsively with textbook internal wave symmetry.
This setup is not just technical—it's mathematical precision in motion.

USDJPY (daily update) 23/07happy trading everyone, here is the daily usdjpy video update. hope this helps happy trading as always

XAU/USD /IDEAGold continues its second consecutive aggressive bullish move, but the structure is beginning to show signs of a potential correction.
During this rally, highs and liquidity were taken,
and previously unfilled FVG zones from about a month ago have now been filled.
I'm watching for a possible correction toward the discount zone around 3360, where the following are located:
– A daily FVG
– A 4H FVG
– 1H Equal Lows, with clear liquidity resting below
If price sweeps the liquidity below these equal lows and reacts around 3360, I will anticipate a continuation of the bullish trend.
However, if a solid setup forms before that, I may enter a short position targeting 3360, where I’ll be looking to close the trade and potentially position for a reversal.
No entry yet – watching closely and waiting for price confirmation.

Adobe - A gigantic triangle breakout! 🔋Adobe ( NASDAQ:ADBE ) will break the triangle:
🔎Analysis summary:
Yes, for the past five years Adobe has been overall consolidating. But this consolidation was governed by a strong symmetrical triangle pattern. Thus following the underlying uptrend, there is already a higher chance that we will see a bullish breakout, followed by a strong rally.
📝Levels to watch:
$400, $700
🙏🏻#LONGTERMVISION
Philip - Swing Trader

gold targetWe wish to point out that trading in stocks, currencies, CFDs (Contracts for Difference), Forex, spread betting, futures and cryptocurrencies, etc. (“Trading”) involves a significant risk of loss and is not suitable for all investors; in particular, past developments do not necessarily indicate future results.

EURUSD Long Swing FX:EURUSD price had stopped falling and I was waiting for bullish volume to kick inn, initial bullish volume started jumping inn, so taking long now.
With my back testing of this strategy, it hits multiple possible take profits, manage your position accordingly.
I manage trade on daily basis.
Use proper risk management
Looks like good trade.
Lets monitor.
Use proper risk management.
Disclaimer: only idea, not advice

GOLD/XAUUSD maintaining Bullish TrendOANDA:XAUUSD / TVC:GOLD Long Trade, with my back testing of this strategy, it hits multiple possible take profits, manage your position accordingly.
Gold is keeping bullish volume and wants to hit key resistance of July, then to consolidate there and then will see what price does further.
Note: Manage your risk yourself, its risky trade, see how much your can risk yourself on this trade.
Use proper risk management
Looks like good trade.
Lets monitor.
Use proper risk management.
Disclaimer: only idea, not advice

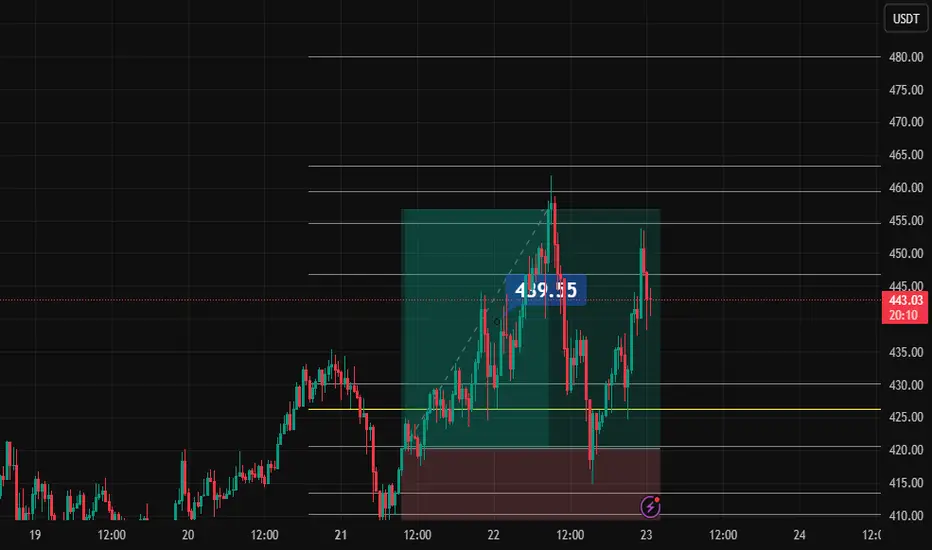
Impatience. Chickening outTrade Journal – TAO, Pengu & the Elusive HYPE
Date 23/7/2025
I don’t trade on Mondays—by design. But today, I honored that discipline *mostly*… with a few strategic pivots.
TAO: First Move, First Lesson
I took TAO on Spot early Monday, planning to hold until weekend highs. My bias? After that weekend pump, I expected Monday’s session to seek out those liquidity-rich levels.
By midmorning, I had early profits—more than I’d normally expect for a Monday. With extra charting time and a shift in schedule, I decided to secure gains around **+3%** and move on.
Right idea… maybe wrong execution.
TAO didn’t just continue—it ripped.
Looked back at me like:
> “The hell were you thinking?”
Fair enough. I responded:
> “Chill. This is the volatility zone. I’ll find another one.”
🐧 Pengu: Redemption in Motion
Scanned. Spotted Pengu .
Took it on Spot again—targeting a clean +5%.
Wasn’t worried about drawdowns; I trust the setup.
Only issue? My exchange doesn’t allow pre-queued sells unless I’m actively in the trade—and sometimes, I forget to prep that.
Fast forward: I checked back, and I’m sitting on +10%++.
No hesitation this time—we sold. Clean.
HYPE: The One That Got Away
Next up was HYPE . I had done the work—clean levels, setup looked solid.
Except… not available on my exchange. Again.
Maybe I just couldn’t find it. Or maybe my exchange was playing games. Either way, that trade left the station without me.
Could’ve transferred funds and chased, but I value precision. Rushed logistics aren’t part of my edge.
Price will always come back.
Final Thought
HYPE’s still on my radar.
If it wants to come home to me and take me to TP—door’s open. Limit set, looking for a 15% within the next 15 days.
Until then, I’m letting the market breathe. Discipline + Setup = Process.
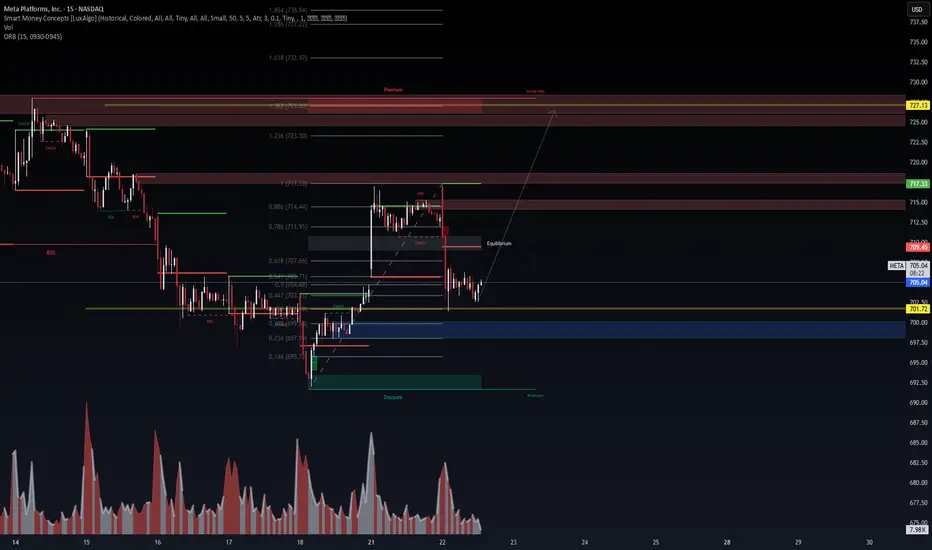
META: That weird drop looks like it was planned :P📊 META (15M) | Smart Money Concepts Setup
🔍 Powered by VolanX Protocol | WaverVanir International LLC
META is showing signs of reclaiming equilibrium after a clear CHoCH -> BOS -> EQH sweep. Price tapped into a premium inefficiency zone and is now consolidating at the equilibrium of the latest impulse leg, suggesting a potential long opportunity.
🧠 Thesis:
Order Block + EQH rejection aligns with a key Fibonacci confluence zone.
Strong demand sits near the 701.72–700.00 area.
Bullish continuation setup toward:
TP1: 717.33 (ORB + EQH target)
TP2: 727.13 (1.382 Fib extension + liquidity sweep zone)
⚠️ Risk Management:
Invalid if price closes below 697.00 (Discount OB)
Ideal entry near 703–705 with confirmation (candle body close over 707.66 Fib)
🛡 VolanX Score: High Confluence | SMC + Fib + Volume Spike
📈 Watching for a bullish engulfing or clean mitigation inside the OB for confirmation.
📎 For educational purposes only – not financial advice.
#VolanX #WaverVanir #META #OptionsFlow #SMC #Fibonacci #SmartMoney #TechStocks #TradingView
NIO Setting Up for a Big Move!🚨 NIO ALERT 🚨
Looks like a buy & fly setup is loading! 📈💥
📊 Technicals aligning beautifully with macro cycle support.
🔥 Volume picking up. The structure looks explosive.
📍 A clean breakout could send this EV beast soaring!
I'm watching closely for confirmation...
This could get FAST. ⚡

NVDA stocks Buy Trade with Take Profit - Stocks SPOT ACCOUNTStocks SPOT ACCOUNT:
NASDAQ:NVDA stocks my buy trade with take profit.
This is my SPOT Accounts for Stocks Portfolio.
Trade shows my Buying and Take Profit Level.
Spot account doesn't need SL because its stocks buying account.

US30: The Market Is Looking Down! Short!
My dear friends,
Today we will analyse US30 together☺️
The recent price action suggests a shift in mid-term momentum. A break below the current local range around 44,306.1 will confirm the new direction downwards with the target being the next key level of 44,263.8..and a reconvened placement of a stop-loss beyond the range.
❤️Sending you lots of Love and Hugs❤️
