GBPUSDOn the 1hr time frame price took sell side liquidity and ran into an FVG, I expect a little push up after the break of internal structure to the area of 1.35060
Gann

EURUSD: Bears Are Winning! Short!
My dear friends,
Today we will analyse EURUSD together☺️
The market is at an inflection zone and price has now reached an area around 1.17083 where previous reversals or breakouts have occurred.And a price reaction that we are seeing on multiple timeframes here could signal the next move down so we can enter on confirmation, and target the next key level of 1.17004..Stop-loss is recommended beyond the inflection zone.
❤️Sending you lots of Love and Hugs❤️

SILVER: Next Move Is Up! Long!
My dear friends,
Today we will analyse SILVER together☺️
The price is near a wide key level
and the pair is approaching a significant decision level of 38.823 Therefore, a strong bullish reaction here could determine the next move up.We will watch for a confirmation candle, and then target the next key level of 38.872.Recommend Stop-loss is beyond the current level.
❤️Sending you lots of Love and Hugs❤️

#RLC/USDT#RLC
The price is moving within a descending channel on the 1-hour frame, adhering well to it, and is heading toward a strong breakout and retest.
We are experiencing a rebound from the lower boundary of the descending channel, which is support at 0.995.
We are experiencing a downtrend on the RSI indicator, which is about to break and retest, supporting the upward trend.
We are heading toward stability above the 100 Moving Average.
Entry price: 1.028
First target: 1.063
Second target: 1.102
Third target: 1.152

July 18 Bitcoin Bybit chart analysisHello
It's a Bitcoin Guide.
If you "follow"
You can receive real-time movement paths and comment notifications on major sections.
If my analysis was helpful,
Please click the booster button at the bottom.
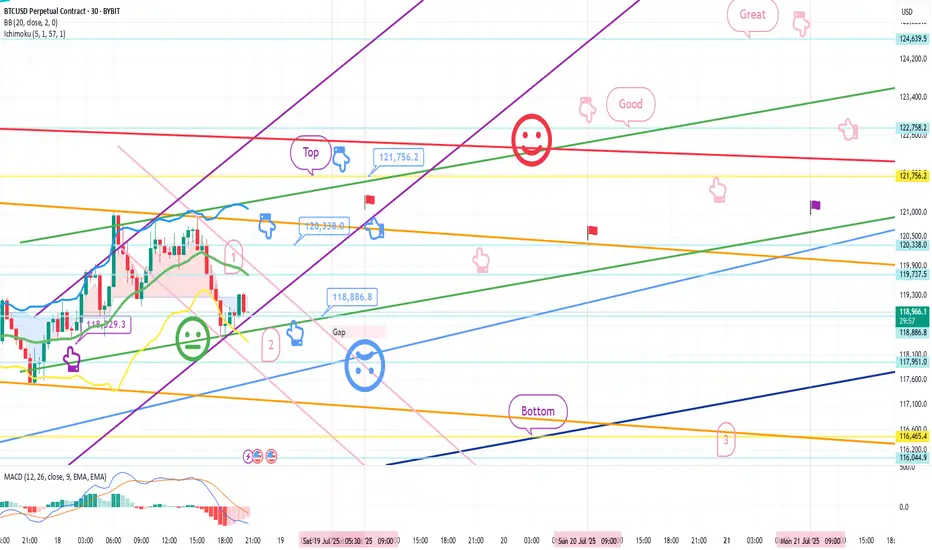
Bitcoin 30-minute chart.
There is no Nasdaq indicator announcement today.
The mid-term pattern was broken in the morning wave,
but I proceeded as safely as possible.
At the bottom left, I connected the final long position switching section in the analysis article on the 15th with a purple finger.
*When the blue finger moves,
Bidirectional neutral
Short->Long or long waiting strategy
1. Short position entry section of $120,338 / Stop loss price when orange resistance line is broken
2. Long position switching of $118,886.8 / Stop loss price when blue support line is broken
3. Long position 1st target of $121,756.2 -> Target price in the order of Good and Great
If it falls immediately from the current position or
touches the top once and falls, it is a vertical decline condition.
If it falls immediately, it is the final long waiting in section 2.
(When the sky blue support line breaks, the stop loss price is the same)
From the sky blue support line break, the 6+12 section is where the mid-term pattern is restored,
and it is roughly the bottom section.
If the strategy is successful, I have left a simulation with a pink finger on the right,
so please check the switching and profit-taking section,
and operate safely in each position, long, short, and no position, based on whether the purple support line breaks from the current position.
From the green support line break, the low point of today's daily candle is broken,
so it would not be good for a long position, right?
Up to this point, please use my analysis article only for reference and use,
and operate safely with principle trading and stop loss price.
Thank you.

GBPUSD Q3 | D22 | W30 | Y25📊GBPUSD Q3 | D22 | W30 | Y25
Daily Forecast Long 🔍📅
Here’s a short diagnosis of the current chart setup 🧠📈
Higher time frame order blocks have been identified — these are our patient points of interest 🎯🧭.
It’s crucial to wait for a confirmed break of structure 🧱✅ before forming a directional bias.
This keeps us disciplined and aligned with what price action is truly telling us.
📈 Risk Management Protocols
🔑 Core principles:
Max 1% risk per trade
Only execute at pre-identified levels
Use alerts, not emotion
Stick to your RR plan — minimum 1:2
🧠 You’re not paid for how many trades you take, you’re paid for how well you manage risk.
🧠 Weekly FRGNT Insight
"Trade what the market gives, not what your ego wants."
Stay mechanical. Stay focused. Let the probabilities work.
FRGNT

WAIT FOR BREAKOUT AND GO LONG THIS MIGHT BE THE LAST CHANCEThis chart is a technical analysis idea for the OM/USDT pair on the daily timeframe from TradingView. Here's a breakdown of the idea:
🔍 Overview
Pair: OM/USDT
Exchange: Binance
Timeframe: 1D (Daily)
📉 Current Market Context
The price is in a strong downtrend, forming a falling wedge (marked with red trendlines), which is typically a bullish reversal pattern.
Price is currently around $0.2539.
📊 Key Levels (Support Zones in Green)
$0.2539 (Current Price)
$0.2390
$0.2285
$0.2250
$0.2224
$0.2100
$0.1882
$0.1115
$0.1016
These green lines represent support zones—potential reversal areas if price falls further.
🟨 Yellow Boxes
These are higher time frame demand zones or accumulation areas, suggesting stronger possible reversal points if price drops deeper.
Placed between $0.14 - $0.04 zone.
📈 Red Arrows
Indicate possible reversal paths:
A bounce from current levels
A dip into deeper support zones before bouncing
A flush into yellow zones before reversal
🗓️ Time-Based Prediction
The note says:
“19, 21, 23, and 30th June might be positive for OM”
This suggests a time cycle forecast—the analyst expects bullish price action on or around these dates, possibly based on astro-cycles, Gann analysis, or time symmetry.
"Despite expecting lower prices, the setup signals that investors are preparing for accumulation—especially near key dates and support levels."
✅ Summary
Wait for wedge breakout confirmation to go long.
Key bullish reversal dates: June 19, 21, 23, and 30
Multiple layered supports and demand zones to watch.

AUDCAD Q3 | D21 | W30 | Y25 📊AUDCAD Q3 | D21 | W30 | Y25
Daily Forecast 🔍📅
Here’s a short diagnosis of the current chart setup 🧠📈
Higher time frame order blocks have been identified — these are our patient points of interest 🎯🧭.
It’s crucial to wait for a confirmed break of structure 🧱✅ before forming a directional bias.
This keeps us disciplined and aligned with what price action is truly telling us.
📈 Risk Management Protocols
🔑 Core principles:
Max 1% risk per trade
Only execute at pre-identified levels
Use alerts, not emotion
Stick to your RR plan — minimum 1:2
🧠 You’re not paid for how many trades you take, you’re paid for how well you manage risk.
🧠 Weekly FRGNT Insight
"Trade what the market gives, not what your ego wants."
Stay mechanical. Stay focused. Let the probabilities work.
FRGNT 📊

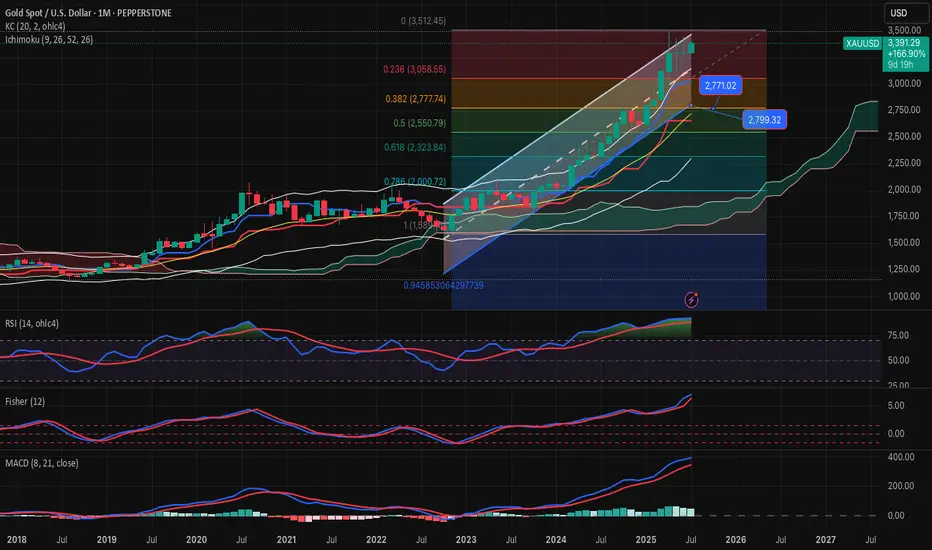
GOLD-SELL strategy Monthly chart Reg. ChannelGold is very overbought medium-term, and the danger is we may see a large decline. Same as I pointed out today on the shorter time-frame, we are in SELL mode, even though we have been moving higher. Crypto will lead the way.
Strategy SELL @ $ 3,385-3,450 and take profit near $ 2,845 for now.
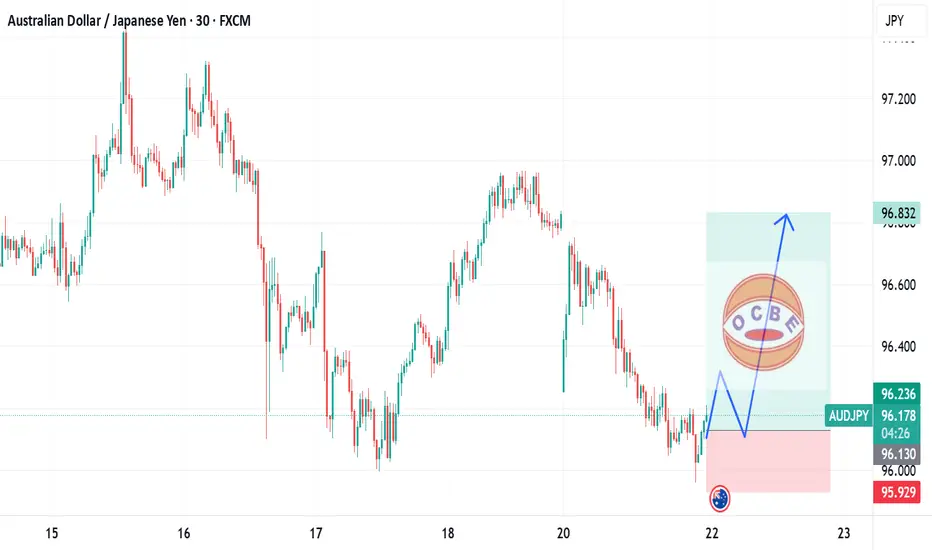
AUDJPY long movePrice had reached our demand zone and reacted bullishly and hence price cloud continues to move upward from the current level.
July 21: Key Resistance at 3358–3366, Breakout Targets 3378–3388Good morning, everyone!
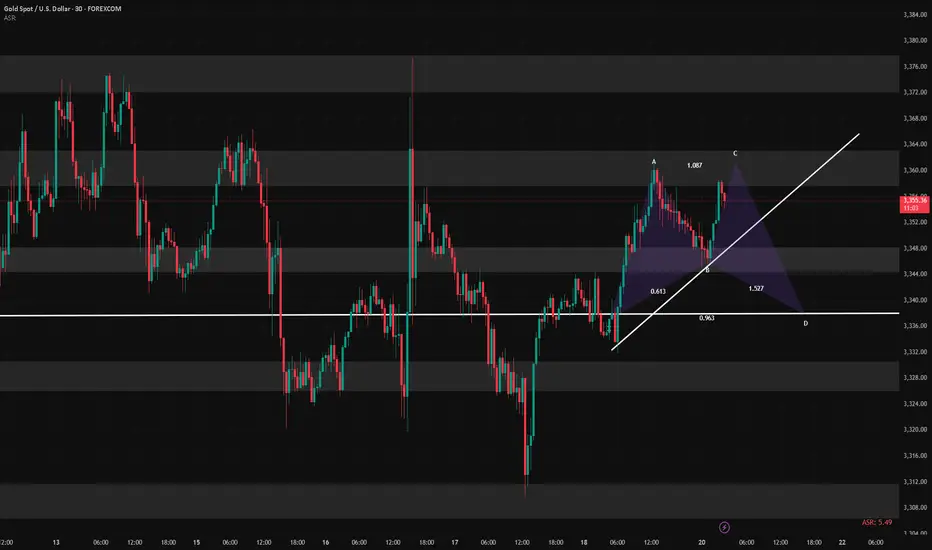
Last Friday, gold tested the support around 3332 but did not break below it. The price then rebounded to the 3358 zone, where it encountered selling pressure and pulled back. At today's open, the price retraced to the 3343 level, where support held well, prompting another rally back toward 3358.
It’s important to note that since the 3358 resistance was already tested on Friday, some of the selling pressure has likely been absorbed. As a result, there is a higher probability of a breakout today. If a breakout occurs, the next key resistance lies at 3366/3372–3378. In the case of strong bullish momentum, the price may extend further toward the 3386–3392 resistance zone.
However, if the price continues to be capped below 3358–3366, we may see a consolidation or short-term pullback. In this case, watch support at 3348–3343. Should the price successfully break above 3378, then support on pullbacks will shift higher to 3363 and 3358–3352.
🔺 Key Warning: The 3358 resistance zone is technically crucial. If the price repeatedly fails to break through, watch out for a potential double-top pattern on the 30-minute chart, which could signal a near-term bearish reversal.
USDJPY (Weekly analysis) 22/07hi everyone please see the weekly analysis i did not do one yesterday as it was a bank holiday in JPY. happy trading everyone

Gold Buys - Swing TradingGold is projected to retrace to 3340 and later push up to clear the buy side liquidities above, which are the monthly highs. Trade with good risk management

Bitcoin bitcoin the game of musical chairs !!!Will you get a chair or be holding the Bag !!!! 80,000 sold at 123 target

Stocks SPOT ACCOUNT: QUBT stocks BUT ENTRY with TAKE PROFITStocks SPOT ACCOUNT: NASDAQ:QUBT stocks my buy trade with take profit.
This is my SPOT Accounts for Stocks Portfolio.
Trade shows my Buying and Take Profit Level.
Spot account doesn't need SL because its stocks buying account.

XAUUSDXAUUSD in a longterm its going to 5K like i already said in 2022
On a short/ midterm we going to 3500.
The price must close above and reject the consolidation like a support to allow us to buy.
Otherwise the best thing to do is wait.

EURUSD: Target Is Up! Long!
My dear friends,
Today we will analyse EURUSD together☺️
The recent price action suggests a shift in mid-term momentum. A break above the current local range around 1.16915 will confirm the new direction upwards with the target being the next key level of 1.17187 and a reconvened placement of a stop-loss beyond the range.
❤️Sending you lots of Love and Hugs❤️

AUDUSD Long PullbackOANDA:AUDUSD taking a pullback towards up, catching this pullback.
Note: I am not adding levels etc on chart because I am tired and need to go for breakfast first, simply sharing the what I see.
I manage trade on daily basis.
Use proper risk management
Looks like good trade.
Lets monitor.
Use proper risk management.
Disclaimer: only idea, not advice

LTCUSDT Short Risking 1% to make 2.22% BINANCE:LTCUSDT Short Swing Trade, with my back testing of this strategy, it hits multiple possible take profits, manage your position accordingly.
This is good trade, don't overload your risk like greedy, be disciplined trader.
I manage trade on daily basis.
Risking 1% to make 2.22% on COINBASE:LTCUSD is good trade, lets see.
Use proper risk management
Looks like good trade.
Lets monitor.
Use proper risk management.
Disclaimer: only idea, not advice

Pfizer stocks Buy Trade with Take Profit - Stocks SPOT ACCOUNTStocks SPOT ACCOUNT:
NYSE:PFE stocks my buy trade with take profit.
This is my SPOT Accounts for Stocks Portfolio.
Trade shows my Buying and Take Profit Level.
Spot account doesn't need SL because its stocks buying account.


ACTBUSD I Weekly CLS I Easy Pump to 0.15 - ResistanceFresh Crypto Analysis — You know I have recently posted few low caps and this another one. this coin can pump to 0.15 easily.
If you’ve been riding with me, you already know:
🎯My system is 100% mechanical. No emotions. No trend lines. No subjective guessing. Working all timeframes. Just precision, structure, and sniper entries.
🧠 What’s CLS?
It’s the real smart money. The invisible hand behind $7T/day — banks, algos, central players.
📍Model 1:
HTF bias based on the daily and weekly candles closes,
Wait for CLS candle to be created and manipulated. Switch to correct LTF and spot CIOD. Enter and target 50% of the CLS candle.
For high probability include Dealing Ranges, Weekly Profiles and CLS Timing.
Analysis done on the Tradenation Charts
Disclosure: I am part of Trade Nation's Influencer program and receive a monthly fee for using their TradingView charts in my analysis.
Trading is like a sport. If you consistently practice you can learn it.
“Adapt what is useful. Reject whats useless and add whats is specifically yours.”
David Perk aka Dave FX Hunter
💬 Comment any Coin I ll give you my quick view
