SILVERSilver lake and Palmer AK mag pouch and I can do the best you could get me some time and Palmer ma to Worcester county jail roster for a few minutes then we will head to bed early and I will head to bed now so we will be home tomorrow and Palmer AK pistol grip stock market open on
Gann

Sweep and Bounce: Will History Repeat in 2025?As you can see, the 2022 support broke, then in 2023 price came back to retest that level but got swept below it and fell further. The point from which it tried to retest got swept clean, then after taking a pullback from the lower low and trendline, price touched resistance again. Now, a similar thing is about to happen with the 2024 low— it broke, got retested in 2025, but the retest point, just like in 2023, got swept under. : Can price push up again after this sweep? tell me in comments OANDA:USDCHF

XAUUSD: July 4, market analysis and strategyGold technical analysis
Daily chart resistance 3400, support 3300
4-hour chart resistance 3365, support 3306
1-hour chart resistance 3352, support 3322
Last night, NFP employment data caused gold prices to fall sharply by $40, and then rebounded to 3338. The energy of the shorts caused by the NFP data has been basically digested. Next, the bulls will start to exert their strength. Gold can still be bullish if it falls back today.
Yesterday, the gold price quickly fell to 3311 and then rebounded. The low point of the second retracement was 3322, which is the short-term support level. You can wait for a retracement near 3322 to buy bullish. The 1-hour resistance is 3352. Pay attention to the reaction here and look for selling opportunities.
Buy: 3322near
Sell: 3352near

US30: Will Go Up! Long!
My dear friends,
Today we will analyse US30 together☺️
The market is at an inflection zone and price has now reached an area around 44,585.50 where previous reversals or breakouts have occurred.And a price reaction that we are seeing on multiple timeframes here could signal the next move up so we can enter on confirmation, and target the next key level of 44,663.28.Stop-loss is recommended beyond the inflection zone.
❤️Sending you lots of Love and Hugs❤️

SILVER: The Market Is Looking Up! Long!
My dear friends,
Today we will analyse SILVER together☺️
The price is near a wide key level
and the pair is approaching a significant decision level of 36.830 Therefore, a strong bullish reaction here could determine the next move up.We will watch for a confirmation candle, and then target the next key level 36.903.Recommend Stop-loss is beyond the current level.
❤️Sending you lots of Love and Hugs❤️

EURUSD: Strong Bearish Sentiment! Short!
My dear friends,
Today we will analyse EURUSD together☺️
The recent price action suggests a shift in mid-term momentum. A break below the current local range around 1.17775 will confirm the new direction downwards with the target being the next key level of 1.17696.and a reconvened placement of a stop-loss beyond the range.
❤️Sending you lots of Love and Hugs❤️

GOLD: Bears Are Winning! Short!
My dear friends,
Today we will analyse GOLD together☺️
The in-trend continuation seems likely as the current long-term trend appears to be strong, and price is holding below a key level of 3,336.61 So a bearish continuation seems plausible, targeting the next low. We should enter on confirmation, and place a stop-loss beyond the recent swing level.
❤️Sending you lots of Love and Hugs❤️

July 3 Bitcoin Bybit chart analysis
Hello
This is Bitcoin Guide.
If you "follow"
You can receive real-time movement paths and comment notifications on major sections.
If my analysis was helpful,
Please click the booster button at the bottom.
Here is the Bitcoin 30-minute chart.
There will be a Nasdaq index announcement at 9:30 and 11:00 in a little while.
I created today's strategy based on the Nasdaq pattern and Tether dominance vertical decline conditions.
*One-way long position strategy when the red finger moves
1. $109,838 long position entry point / stop loss price when the purple support line is broken
2. $111,549.7 long position 1st target -> Great 2nd target
The 1st section at the top and the 2nd section at the bottom are sideways sections.
Even if the strategy fails, if the green support line is not broken,
it is good for a long position.
Below that
Bottom -> Please note that it is open up to 107,841.4 dollars
Up to this point, I ask that you simply use my analysis for reference and use only
I hope that you operate safely with principle trading and stop loss prices.
Thank you.

USDCAD LONG DAILY FORECAST Q3 D4 W27 Y25USDCAD LONG DAILY FORECAST Q3 D4 W27 Y25
Professional Risk Managers👋
Welcome back to another FRGNT chart update📈
Diving into some Forex setups using predominantly higher time frame order blocks alongside confirmation breaks of structure.
Let’s see what price action is telling us today! 👀
💡Here are some trade confluences📝
✅Daily Order block identified
✅4H Order Block identified
✅1H Order Block identified
🔑 Remember, to participate in trading comes always with a degree of risk, therefore as professional risk managers it remains vital that we stick to our risk management plan as well as our trading strategies.
📈The rest, we leave to the balance of probabilities.
💡Fail to plan. Plan to fail.
🏆It has always been that simple.
❤️Good luck with your trading journey, I shall see you at the very top.
🎯Trade consistent, FRGNT X

Bajaj AutoThis is Bajaj auto chart
which is at 8410 ...
looking at the chart is see this structure...
in which from upside 5 waves have been completed...
and after that I see 3 waves upside correction being completed...
if price breaks downside levels ...
levels can be seen on charts till where i am expecting...
Just a View!!
Vedang!
Discliamer: Chart is for study purpose only!!

GBPCAD LONG DAILY FORECAST Q3 D4 W27 Y25GBPCAD LONG DAILY FORECAST Q3 D4 W27 Y25
Professional Risk Managers👋
Welcome back to another FRGNT chart update📈
Diving into some Forex setups using predominantly higher time frame order blocks alongside confirmation breaks of structure.
Let’s see what price action is telling us today! 👀
💡Here are some trade confluences📝
✅Daily Order block identified
✅4H Order Block identified
✅1H Order Block identified
🔑 Remember, to participate in trading comes always with a degree of risk, therefore as professional risk managers it remains vital that we stick to our risk management plan as well as our trading strategies.
📈The rest, we leave to the balance of probabilities.
💡Fail to plan. Plan to fail.
🏆It has always been that simple.
❤️Good luck with your trading journey, I shall see you at the very top.
🎯Trade consistent, FRGNT X

Delphy 400% short 7000% longYeah well, from my levels ill try to short from 0.00865. Then long from 0.00168 to 0.1225.
If it works out, wow, if it dont then ah well, many other oppertunities

AUDJPY SHORT FORECAST Q3 W27 D4 Y25AUDJPY SHORT FORECAST Q3 W27 D4 Y25
Professional Risk Managers👋
Welcome back to another FRGNT chart update📈
Diving into some Forex setups using predominantly higher time frame order blocks alongside confirmation breaks of structure.
Let’s see what price action is telling us today! 👀
💡Here are some trade confluences📝
✅Weekly Order Block Identified
✅Daily Order block identified
✅4H Order Block identified
✅15' Order block identified
🔑 Remember, to participate in trading comes always with a degree of risk, therefore as professional risk managers it remains vital that we stick to our risk management plan as well as our trading strategies.
📈The rest, we leave to the balance of probabilities.
💡Fail to plan. Plan to fail.
🏆It has always been that simple.
❤️Good luck with your trading journey, I shall see you at the very top.
🎯Trade consistent, FRGNT X

EURJPY SHORT DAILY FORECAST Q3 D4 W27 Y25EURJPY SHORT DAILY FORECAST Q3 D4 W27 Y25
Professional Risk Managers👋
Welcome back to another FRGNT chart update📈
Diving into some Forex setups using predominantly higher time frame order blocks alongside confirmation breaks of structure.
Let’s see what price action is telling us today! 👀
💡Here are some trade confluences📝
✅Daily Order block identified
✅4H Order Block identified
✅1H Order Block identified
🔑 Remember, to participate in trading comes always with a degree of risk, therefore as professional risk managers it remains vital that we stick to our risk management plan as well as our trading strategies.
📈The rest, we leave to the balance of probabilities.
💡Fail to plan. Plan to fail.
🏆It has always been that simple.
❤️Good luck with your trading journey, I shall see you at the very top.
🎯Trade consistent, FRGNT X

GBPJPY SHORT DAILY FORECAST Q3 D4 W27 Y25GBPJPY SHORT DAILY FORECAST Q3 D4 W27 Y25
Professional Risk Managers👋
Welcome back to another FRGNT chart update📈
Diving into some Forex setups using predominantly higher time frame order blocks alongside confirmation breaks of structure.
Let’s see what price action is telling us today! 👀
💡Here are some trade confluences📝
✅Daily Order block identified
✅4H Order Block identified
✅1H Order Block identified
🔑 Remember, to participate in trading comes always with a degree of risk, therefore as professional risk managers it remains vital that we stick to our risk management plan as well as our trading strategies.
📈The rest, we leave to the balance of probabilities.
💡Fail to plan. Plan to fail.
🏆It has always been that simple.
❤️Good luck with your trading journey, I shall see you at the very top.
🎯Trade consistent, FRGNT X

Adobe - A gigantic triangle breakout! 🔋Adobe ( NASDAQ:ADBE ) will break the triangle:
🔎Analysis summary:
Yes, for the past five years Adobe has been overall consolidating. But this consolidation was governed by a strong symmetrical triangle pattern. Thus following the underlying uptrend, there is already a higher chance that we will see a bullish breakout, followed by a strong rally.
📝Levels to watch:
$400, $700
🙏🏻#LONGTERMVISION
Philip - Swing Trader

BTC UP OR NO📈 Bitcoin to Reach $113K, With a Breakout Path to $120K – A Professional Outlook
After analyzing the macro trend, technical structure, market sentiment, and on-chain behavior, I strongly believe that Bitcoin is on a clear trajectory toward $113,000, with a potential extension to $120,000 if key resistance is broken.
---
🔍 1. Technical Analysis Perspective
Macro Bullish Structure: Since the 2022 bear market bottom, Bitcoin has maintained a consistent higher highs and higher lows pattern, confirming a long-term uptrend.
Fibonacci Extension: The 1.618 Fibonacci extension from the $15.5K bottom to the $69K peak gives a projected target of around $113K.
Historical Fractal Patterns: In previous cycles, Bitcoin has always broken past previous all-time highs by 1.5x to 1.75x, placing this cycle's peak in the $110K–$120K range.
Ascending Triangle Breakout: On the weekly chart, BTC is forming a bullish ascending triangle with the top resistance at ~$73K. A confirmed breakout targets $113K as the next major supply zone.
---
🧠 2. Market Psychology & Cycle Timing
Halving Effect: Historically, Bitcoin peaks occur 9–12 months post-halving. The most recent halving was in April 2024, aligning a potential peak by Q1 or Q2 of 2025.
Psychological Resistance Zones: The $100K–$113K range is not only a Fibonacci target but also a powerful psychological barrier. Once breached, FOMO and institutional momentum could push BTC rapidly to $120K.
Retail vs Institutional Flows: Data shows increased ETF inflows and long-term holder accumulation — a classic pre-peak indicator.
---
🔗 3. On-Chain and Whale Behavior
Realized Price vs Market Price: BTC market price is well above long-term holder realized price, signaling bull market phase 2 (the steep climb).
Dormant Supply: Over 70% of BTC has not moved in 6+ months, showing strong holder conviction. This reduces sell pressure as price increases.
Whale Accumulation Zones: Whales are heavily positioned around $60K–$65K, and there is minimal sell volume above $100K on major exchanges, opening the path to $113K with low resistance.
---
🚀 Conclusion:
> Based on comprehensive technical patterns, market structure, psychological phases, and on-chain behavior, Bitcoin is highly likely to reach $113,000.
If momentum continues and $113K is breached with volume confirmation, a sharp move toward $120,000 becomes not only possible — but likely.

$ZM Swing Setup – Fib Expansion + Recovery Arc🔍 NASDAQ:ZM Swing Setup – Fib Expansion + Recovery Arc
Zoom is entering a Fibonacci golden arc setup, bouncing off key support ($75.60) and aiming for a multi-leg move back toward structural targets.
Trade Thesis: A successful reclaim of $85–88 range can propel NASDAQ:ZM to $105–109 with a final fib target of $122 if volume confirms.
Risk: Break below $72 invalidates the recovery arc.
🧠 WaverVanir DSS Score: 7.4/10
📌 Targets:
TP1: $85.00 (safe swing exit)
TP2: $96.24 (measured move)
TP3: $108.99–$122.53 (macro extension targets)
⚠️ SL: $72.30 | RR: 3.5:1 | Timeline: 30–60 days
#Zoom #ZM #Fibonacci #WaverVanir #Options #SwingTrade #AIQuant #TradingView
🔍 Chart Overview
Ticker: ZM (Zoom Video Communications, Inc.)
Timeframe: Daily
Chart Tools: Fibonacci retracement & extension levels, projected Elliott-style wave structure
📊 Current Price
Current Price: $77.57
Key Support:
$75.60 → Previous pivot low (likely acting as short-term support)
$72.30 → Golden Pocket zone (high probability bounce area)
Key Resistance Zones:
$85.00 → 1.0 Fib retracement (former high)
$88.35 → 61.8% retracement of previous drop
$96.24 → Full 100% retracement
$105.78 → 1.272 extension (strong resistance)
$109.01 → 1.618 Fib extension
🧠 Technical Structure & Path Forecast
A potential ABC impulse wave is drawn in red:
Leg A → Target ~$92–96 range (50–100% retracement zone)
Pullback (leg B) → ~$88–90 support retest
Leg C rally → Major resistance at $108.99, possibly extending to $116.91 or $122.53 in a blow-off top
Confluence Targets:
$105.78 (1.272 extension) aligns with a major Fib cluster and resistance zone
$109.01 (1.618 extension) also aligns with previous structural highs
Final target ~$122.53 (2.272 extension) is ambitious but possible under bullish macro conditions
⚠️ Risk Management
Stop-Loss (short-term): $72.30 (loss of this level invalidates the bullish thesis short-term)
Entry Zones:
Swing long: $75.60–$77.50 (ideal accumulation range)
Momentum entry: above $85.00 (break of structure)
Downside Risks:
Break below $72.30 opens the path to $67.00 and possibly lower
📈 Probabilities (Based on WaverVanir DSS)
Target Level Type Probability
$85.00 Local resistance 80%
$96.24 Measured move 100% 68%
$105.78 1.272 Fib extension 55%
$109.01 1.618 Fib extension 45%
$122.53 2.272 Fib extension 25%

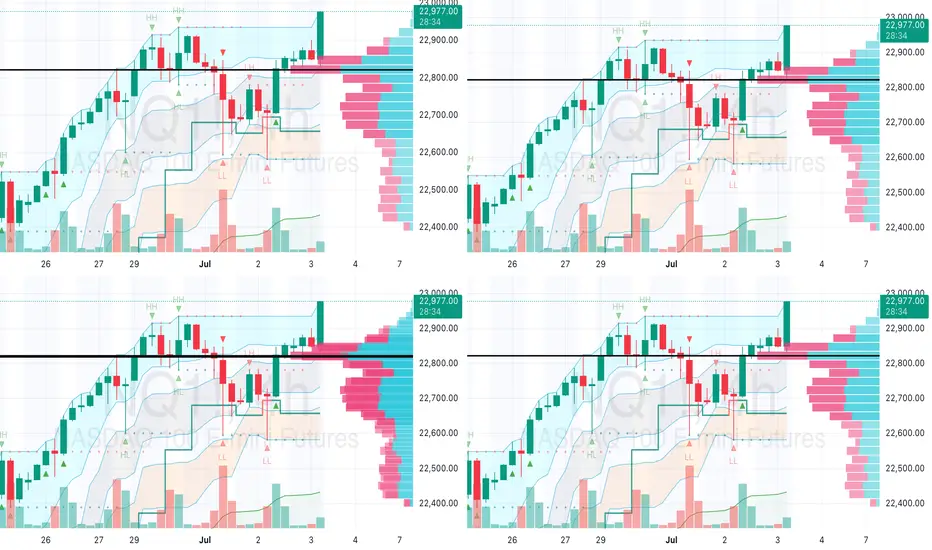
NQ Futures Explosive Breakout! Will It Hit 23,400? 1. Market Context
Timeframe: Daily chart from June 26 to July 4, 2025, with data current as of 09:29 AM EDT, July 3, 2025.
Trend: The price has been in an uptrend, breaking above 22,600.00 and approaching resistance near 22,915.00-23,000.00, consistent with recent bullish momentum in NQ futures (TradingView, CME Group).
2. Key Levels
Support: Immediate support at 22,600.00-22,700.00, where moving averages and prior consolidation align. A deeper support lies around 22,400.00 (lower trendline).
Resistance: Key resistance at 22,915.00, with a potential target at 23,000.00. A break above could aim for 23,200.00-23,400.00 (Fibonacci levels from web sources).
Stop Loss: Place below support (e.g., 22,580.00) to protect against a reversal.
Take Profit: Target 23,000.00 initially, with an extended goal at 23,400.00 if momentum holds.
3. Technical Indicators
Candlestick Patterns: Green candles near 22,915.00 suggest buying pressure, but red candles and dojis indicate potential indecision or rejection at resistance.
Volume: At 31.54K, volume is moderate. A spike on a breakout would confirm strength; a decline might signal exhaustion.
Moving Averages: The chart shows multiple MAs (e.g., 50-day, 200-day). Price above these supports the uptrend; a cross below could signal a shift.
4. Trade Plan
Entry: Enter long near 22,900.00 if consolidation holds, or on a breakout above 22,915.00 with volume confirmation.
Risk-Reward Ratio: Aim for 1:2 (e.g., risk 20 points to gain 40 points toward 23,000.00, or 400 points toward 23,400.00).
Position Sizing: Base on your account size and 1-2% risk per trade, considering NQ’s $20 multiplier per point.
Exit Strategy: Take partial profits at 23,000.00 and trail the rest, or exit fully if resistance holds.
5. Risk Management
Volatility: NQ’s recent range (22,400.00-22,915.00) suggests moderate volatility. Use tight stops due to potential news-driven moves.
News/Event Risk: Monitor Fed statements or tech earnings (key NQ drivers per CME Group) scheduled around July 3-4, 2025.
6. Scenario Analysis
Bullish Case: A break above 22,915.00 with strong volume could push NQ to 23,200.00-23,400.00, aligning with Fibonacci targets (TradingView).
Bearish Case: Rejection at 22,915.00 with a red candle might drop to 22,600.00-22,700.00. Cut losses if support fails.
#GALA/USDT Gala bull run possible ?
#GALA
The price is moving within a descending channel on the 1-hour frame, adhering well to it, and is on its way to breaking it strongly upwards and retesting it.
We have a bounce from the lower boundary of the descending channel, this support at 0.0600.
We have a downtrend on the RSI indicator that is about to break and retest, supporting the upward move.
There is a key support area in green at 0.01312, which represents a strong basis for the upward move.
Don't forget one simple thing: ease and capital.
When you reach the first target, save some money and then change your stop-loss order to an entry order.
For inquiries, please leave a comment.
We have a trend of stability above the Moving Average 100.
Entry price: 0.01360
First target: 0.01412
Second target: 0.01450
Third target: 0.01500
Don't forget one simple thing: ease and capital.
When you reach the first target, save some money and then change your stop-loss order to an entry order.
For inquiries, please leave a comment.
Thank you.

BTC BIG SHORT!We did a mirror retest, and many other signals also point to a sharp decline, indicating numerological codes 69/96.

#DYM Dymension's Falling Wedge#DYM
The price is moving within a descending channel on the 1-hour frame, adhering well to it, and is on its way to breaking it strongly upwards and retesting it.
We have a bounce from the lower boundary of the descending channel. This support is at 0.2130.
We have a downtrend on the RSI indicator that is about to break and retest, supporting the upside.
There is a major support area in green at 0.2100, which represents a strong basis for the upside.
Don't forget a simple thing: ease and capital.
When you reach the first target, save some money and then change your stop-loss order to an entry order.
For inquiries, please leave a comment.
We have a trend to hold above the 100 Moving Average.
Entry price: 0.2220
First target: 0.2276
Second target: 0.2340
Third target: 0.2427
Don't forget a simple thing: ease and capital.
When you reach the first target, save some money and then change your stop-loss order to an entry order.
For inquiries, please leave a comment.
Thank you.

#PEOPLE Breakout in Action!#PEOPLE
The price is moving within a descending channel on the 1-hour frame, adhering well to it, and is poised to break it strongly upwards and retest it.
We have a bounce from the lower boundary of the descending channel. This support is at 0.01717.
We have a downtrend on the RSI indicator that is about to break and retest, supporting the upward move.
There is a key support area (in green) at 0.01650, which represents a strong basis for the upward move.
Don't forget one simple thing: ease and capital.
When you reach the first target, save some money and then change your stop-loss order to an entry order.
For inquiries, please leave a comment.
We have a trend of stability above the Moving Average 100.
Entry price: 0.01764
First target: 0.01807
Second target: 0.01855
Third target: 0.01916
Don't forget one simple thing: ease and capital.
When you reach the first target, save some money and then change your stop-loss order to an entry order.
For inquiries, please leave a comment.
Thank you.
