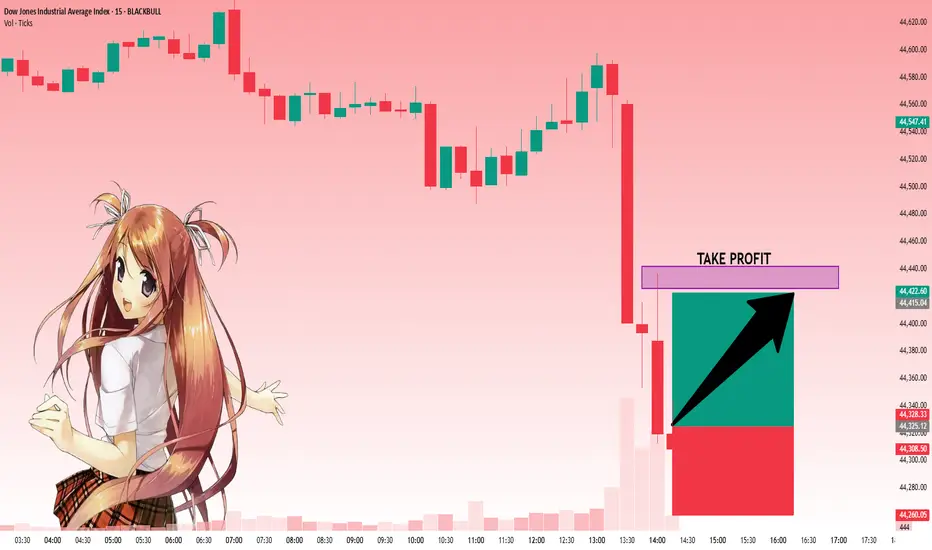
US30: Move Up Expected! Long!
My dear friends,
Today we will analyse US30 together☺️
The price is near a wide key level
and the pair is approaching a significant decision level of 44,325.14 Therefore, a strong bullish reaction here could determine the next move up.We will watch for a confirmation candle, and then target the next key level of 44,425.56.Recommend Stop-loss is beyond the current level.
❤️Sending you lots of Love and Hugs❤️
Gann
GOLD: Local Bearish Bias! Short!
My dear friends,
Today we will analyse GOLD together☺️
The recent price action suggests a shift in mid-term momentum. A break below the current local range around 3,358.13 will confirm the new direction downwards with the target being the next key level of 3,349.76.and a reconvened placement of a stop-loss beyond the range.
❤️Sending you lots of Love and Hugs❤️

SILVER: Strong Bullish Sentiment! Long!
My dear friends,
Today we will analyse SILVER together☺️
The in-trend continuation seems likely as the current long-term trend appears to be strong, and price is holding above a key level of 38.281 So a bullish continuation seems plausible, targeting the next high. We should enter on confirmation, and place a stop-loss beyond the recent swing level.
❤️Sending you lots of Love and Hugs❤️

EURUSD: Bears Are Winning! Short!
My dear friends,
Today we will analyse EURUSD together☺️
The market is at an inflection zone and price has now reached an area around 1.16557 where previous reversals or breakouts have occurred.And a price reaction that we are seeing on multiple timeframes here could signal the next move down so we can enter on confirmation, and target the next key level of 1.16419..Stop-loss is recommended beyond the inflection zone.
❤️Sending you lots of Love and Hugs❤️

XAUUSD: Market Analysis and Strategy for July 18Gold technical analysis
Daily chart resistance: 3382, support: 3310
Four-hour chart resistance: 3375, support: 3332
One-hour chart resistance: 3365, support: 3345.
From a technical perspective, the price of gold has recently formed a wide range of fluctuations in the range of 3310-3365 US dollars, reflecting the unclear market direction. At present, the short-term moving average of gold is supported at 3332, and other periodic indicators are also in a bullish arrangement. The overall decline at the hourly level is limited, and the bulls still have the momentum to rebound.
3310 on the daily chart constitutes a key support. If it falls below, it may fall to the July low of 3287-3282. On the upside, if the resistance level of 3366 US dollars is effectively broken, it may trigger short stop losses and push the gold price back to the 3400 US dollar mark. Pay attention to the resistance of 3366-3377 above and the support of 3345/3332 below
BUY: 3345near
SELL: 3365near

Wave structure of GRT coin in week time frame- Week is swing bullish => current is pullback.
- Day is swing bullish => current is pullback.
- We can look for buying opportunities when there is a reversal signal on the 4-hour time frame or the price reaches the demand zone of the daily frame.

BTC wave structure analysis on 4 hour and daily timeframe- Daily time frame, after price gave stop hunting signal, price increased again.
- On the 4-hour time frame, the price broke through the strong peak and gave a bullish reversal signal.
- So there is a high possibility that BTC will continue to rise and break the previous top.

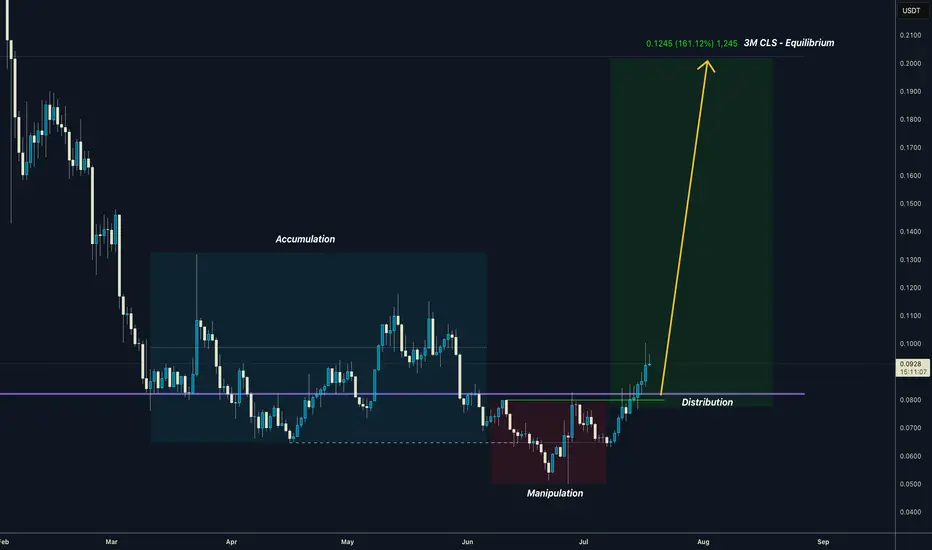
WUSDT I 3M CLS I Model 1 I AMD - Phase 3Yo Market Warriors ⚔️
These Altcoins can pump hard — if you’ve been riding with me, you already know:
🎯My system is 100% mechanical. No emotions. No trend lines. No subjective guessing. Just precision, structure, and sniper entries.
🧠 What’s CLS?
It’s the real smart money. The invisible hand behind $7T/day — banks, algos, central players.
📍Model 1:
HTF bias based on the daily and weekly candles closes,
Wait for CLS candle to be created and manipulated. Switch to correct LTF and spot CIOD. Enter and target 50% of the CLS candle.
For high probability include Dealing Ranges, Weekly Profiles and CLS Timing.
Trading is like a sport. If you consistently practice you can learn it.
“Adapt what is useful. Reject whats useless and add whats is specifically yours.”
David Perk aka Dave FX Hunter
💬 Don't hesitate to ask any questions or share your opinions

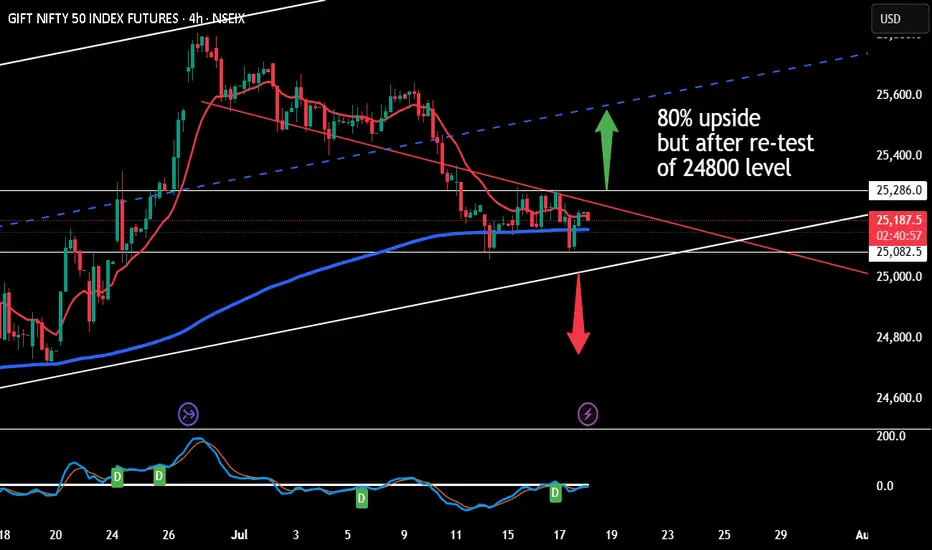
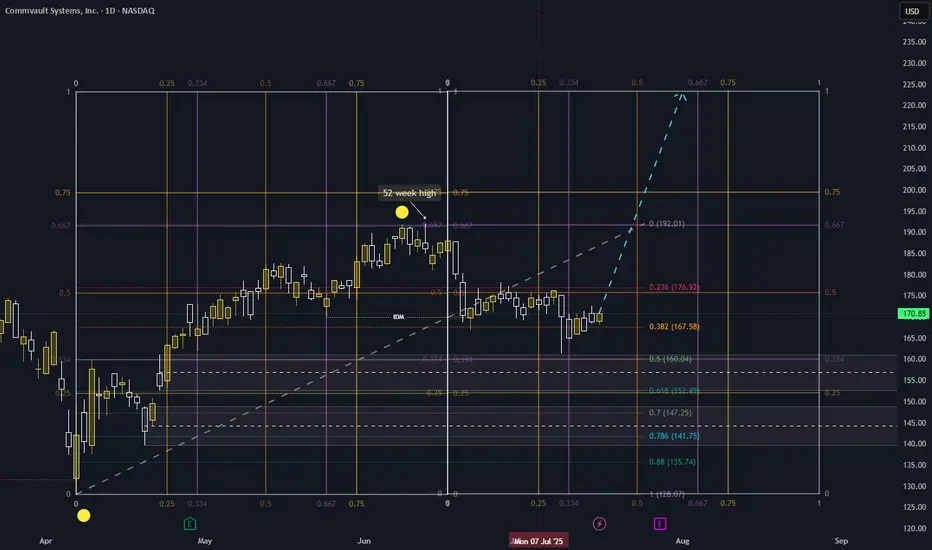
This is idea for positional trading in niftyBased on a confluence of Technical Analysis, Gann theory, and Astro-cycle studies, the market continues to experience downside pressure. This phase is likely a volume accumulation zone, which could set the stage for a stronger uptrend in the coming weeks.
The current bearish undertone is expected to gradually shift, with potential positive momentum emerging around August 5, 2025.
Scenario 1: Buy on Dip (Accumulation Zone)
Entry: Buy Nifty Futures in the 24,850 – 24,900 range
Stop Loss: 50 points
Target: 25,200 – 25,800
Note: This setup is valid only if the price retraces to this support zone, or halt before breaking out above 25,300.
Scenario 2: Breakout Buy
Entry: Buy Nifty Futures above 25,300
Stop Loss: 30 points
Target: 25,800
Note: This is a momentum-based entry upon confirmed breakout.
XAUUSDWhat I see in gold is a lack of bullish momentum, and fundamental factors also support the idea that XAU/USD is likely to take a breather.
I’m expecting the price to touch the 3295 level, and I’m a seller at 3344.

USDJPY (daily analysis) 18/07here is another daily update on usdjpy, please note this is not financial advice. happy trading and have a great weekend

EURJPYEUR/JPY is in a clear downtrend, and the marked zone is the best area for selling.
Dear friends, always trade with the trend

GBPCAD LONG & SHORT – DAILY FORECAST Q3 | D17/18 | W29 | Y25GBPCAD LONG & SHORT – DAILY FORECAST
Q3 | D17/18 | W29 | Y25
FUN COUPON FRIDAY INCOMING !
Professional Risk Managers 👋
Welcome back to another FRGNT chart update 📈
Today we’re diving into some fresh Forex setups, using a combination of higher time frame order blocks and confirmation through breaks of structure.
Let’s see what price action is telling us today 👀
💡 Key Trade Confluences 📝
✅ Daily order block identified
✅ 4H order block identified
✅ 1H order block identified
🔑 As always, trading involves a degree of risk. That’s why, as Professional Risk Managers, it’s essential that we stay disciplined—sticking to both our risk management plan and our trading strategy.
📈 The rest is left to the balance of probabilities.
💬 Fail to plan, plan to fail.
🏆 It really is that simple.
❤️ Wishing you the very best on your trading journey—I’ll see you at the top.
🎯 Trade consistent,
FRGNT X

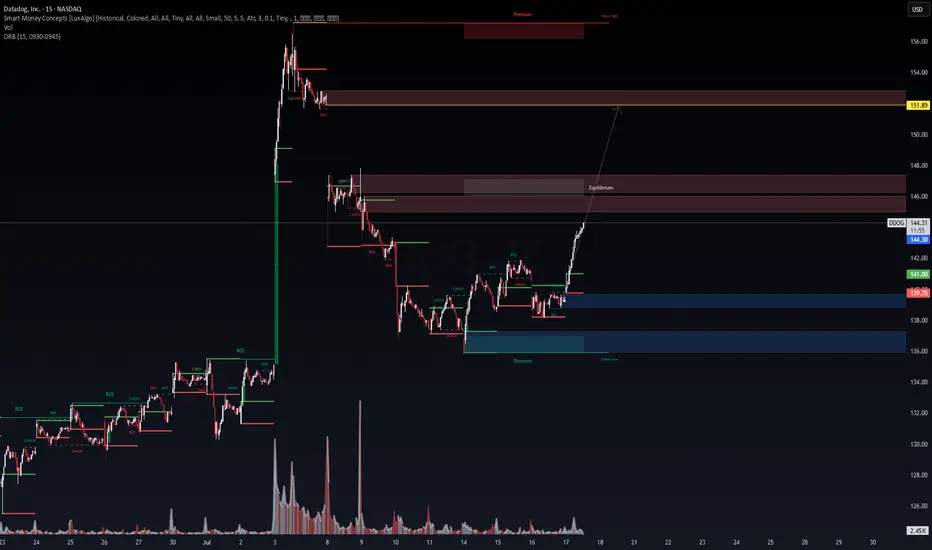
DDOG 15m – Discount Reversal Targeting $151.89 | VolanX Protocol📈 Datadog (DDOG) has completed a clean bullish structural shift off a deep discount zone, rejecting institutional demand around the $137–139 range. Now breaking above key internal CHoCH and BOS levels, price is accelerating into equilibrium, suggesting momentum is building toward premium inefficiencies.
🔍 Technical Breakdown:
Massive previous BOS on July 3rd led to an overextended move that’s now correcting.
Strong reclaim above $141 (ORB high and demand imbalance).
Price swept strong low and confirmed bullish intent via nested CHoCH → BOS → continuation.
Heading into low-resistance volume node up to $146 equilibrium, then targeting $151.89 premium supply.
📌 Critical Zones:
Demand (Support): $139.75 → $137.00 → $136.00 (discount + strong low zone)
Equilibrium Zone: $145.80–146.40 (short-term reaction likely)
Target Liquidity Zone: $151.89 (Premium + prior weak high)
📊 VolanX Protocol Read:
This setup aligns with a VolanX Reversal Protocol. The SMC framework suggests a fully developed market structure cycle (markdown → accumulation → markup). Price action is supported by consistent BOS levels and bullish reaccumulation signs.
🧠 Probabilistic Price Model:
70% → $145.8–146 (reaction near EQ + mitigation)
45% → $151.89 full premium sweep
15% → Breakdown below $139.75 invalidates bullish thesis
⚠️ VolanX Standard Disclosure:
This post is for strategic modeling and educational purposes only. It reflects WaverVanir's internal DSS logic, not financial advice. Always backtest and confirm your execution model.
EURGBP SHORT – DAILY FORECAST Q3 | D17/18 | W29 | Y25💼 EURGBP SHORT – DAILY FORECAST
Q3 | D17/18 | W29 | Y25
FUN COUPON FRIDAY INCOMING !
📊 MARKET STRUCTURE SNAPSHOT
EURGBP is currently reacting from a key higher time frame supply zone, with price action showing weakness at premium levels. Momentum has slowed, and early signs of distribution are appearing. With structure aligning bearishly across multiple timeframes, the pair presents a short bias opportunity.
🔍 Confluences to Watch 📝
✅ Daily Order Block (OB)
Price reacted from a high-probability bearish OB.
Rejection wicks and a shift in candle body control point to supply dominance.
Momentum is fading, confirming the presence of smart money sellers.
✅ 4H Order Block
Clear mitigation of 4H OB followed by an internal break of structure (iBoS).
Price is respecting the OB zone, printing lower highs beneath key supply.
Perfect mid-timeframe confirmation of trend transition.
✅ 1H Order Block
1H structure shifted bearish, validating LTF trend alignment.
Price building supply chain with continued lower highs and bearish engulfing patterns.
Ideal zone for entry on pullback or liquidity sweep.
📈 Risk Management Protocols
🔑 Core Principles:
💰 Max 1% risk per trade
📍 Only execute at pre-identified zones
⏰ Set alerts — avoid impulsive trades
📉 Respect RR — minimum 1:2 per position
🧠 You're not paid for frequency. You're paid for discipline and execution quality.
🧠 Weekly FRGNT Insight
“Trade what the market gives, not what your ego wants.”
Stay mechanical, stay focused, and allow the probabilities to play out. Your job is to control risk — not the outcome.
🏁 Final Thoughts from FRGNT
📌 The structure is clear.
📌 The confluences are stacked.
📌 The bias is confirmed.
Let your execution reflect your discipline, not your emotions.
❤️ Good luck this week, and as always – I’ll see you at the very top.

Gan Fan analysis of InfyGan Fan Line for infy the Gan Fan analysis for the infy has become so much important at this stage to make a long term decision watch the video till end

XAUUSD: Market analysis and strategy for July 17.Gold technical analysis
Daily chart resistance: 3382, support below 3300
Four-hour chart resistance: 3375, support below 3320
One-hour chart resistance: 3352, support below 3320.
Trump's remarks in the NY market on Wednesday ignited the market. First, it was reported that Powell would be fired, and then it was reported that Trump denied the news. Gold quickly rose to 3375 and then quickly fell back. Under the impact of the news, the price fluctuated very quickly, jumping up and down quickly.
From the current market trend, the day before yesterday, it fell to 3319 and stopped falling and rebounded. Yesterday, it tested 3319 again and quickly pulled up. Yesterday, the price hit the high point of this week near 3375 again and fell back quickly. There is support below and resistance above. If it approaches the 3320 support for the third time today, it is likely to fall below, and then trigger a long stop loss, and it may fall rapidly at that time.
If it falls below 3319, it will look at the 3280~3300 range.
SELL:3319 SL:3324
SELL:3352 SL:3357

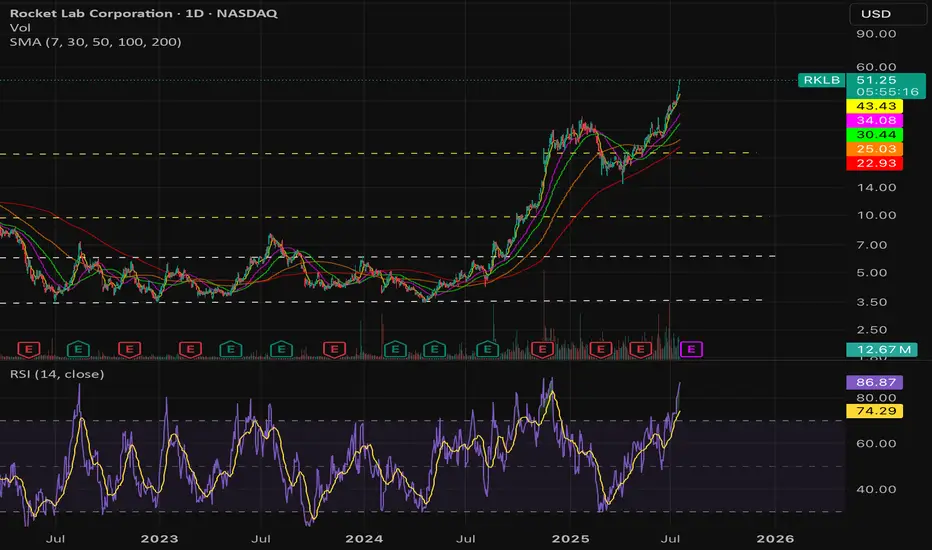
$RKLB Overvalued asf! - NASDAQ:RKLB is overvalued. I will either stay on the sidelines or short the heck out of this POS.
- Company sells hopium which doesn't have meaningful materialization as of now and not even in the distant future.
Fundamentally,
2025 | 2026 | 2027 | 2028
-0.32 | -0.08 | 0.17 | 0.47
Revenue:
576.83M | 905.01M | 1.21B | 1.69B
- Market cap of NASDAQ:RKLB currently sits at 24.61B as of July 17, 2025.
- People who are buying now are buying someone else bag and are in for a horrible ride.
- Consider buying it under $15 if you are super bullish
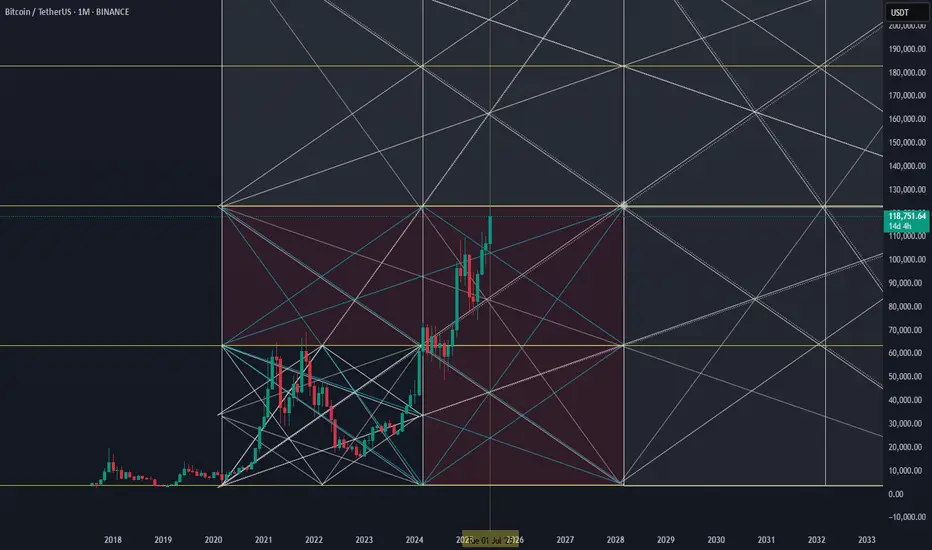
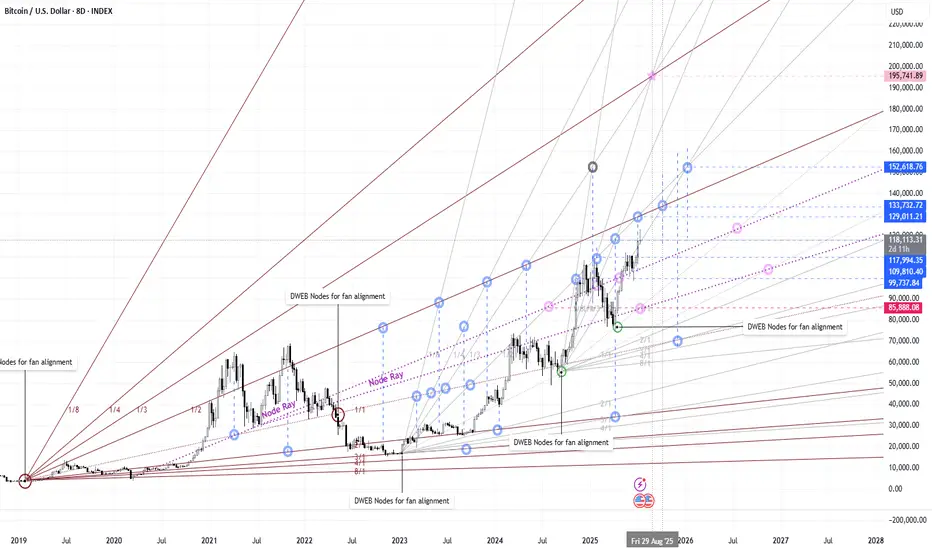
DWEB Node trends, intersects, levels, pivotsWith DWEB indicator , you find the major node trendline built between 2 nodes of the same color ( start with same color). With those nodes and the line given you then have a start point and the alignment for Gann fans and rays. These fans and rays, when properly placed will provide very accurate trends to follow into the future. When using multiple node trends with fans and rays, you will find that when things are aligned properly, the points at which the lines intersect more than likely hold some form of data. This can be in time/pivot zones (x), price levels (y) or both. Take a close look, this chart took all of 20 mins to build and I am willing to bet there is much more data found and drawing tools used to help predict future trends an price action. Sine, Fib, geometry etc. . See the original chart here with DWEB nodes ON.
Long term I am very bullish on BTC. This is an 8D chart so keep that in mind.
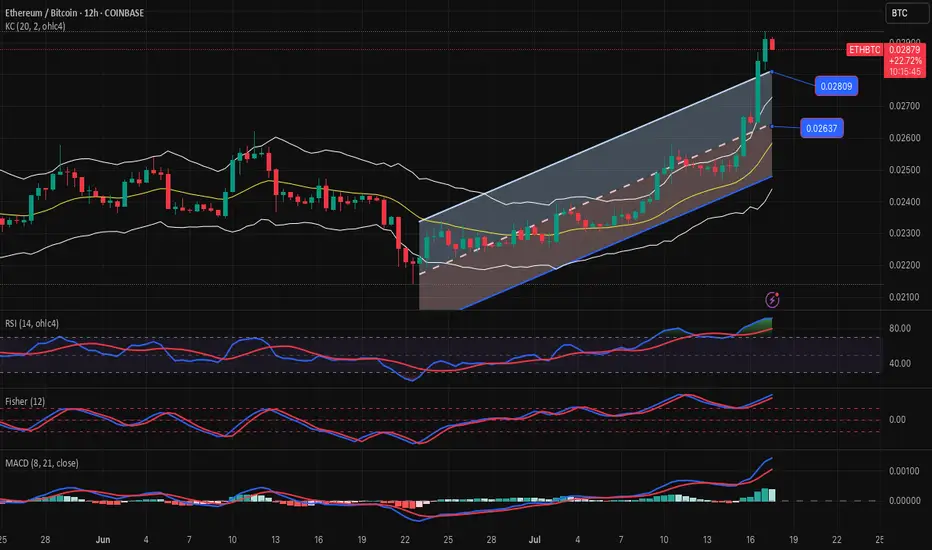
ETHBTC-SELL strategy 12 hourly chrt Reg. ChannelETH is more overvalued than BTC, hence selling this combo may make sense.
Strategy SELL @ 0.028800 area and take profit near 0.26500.