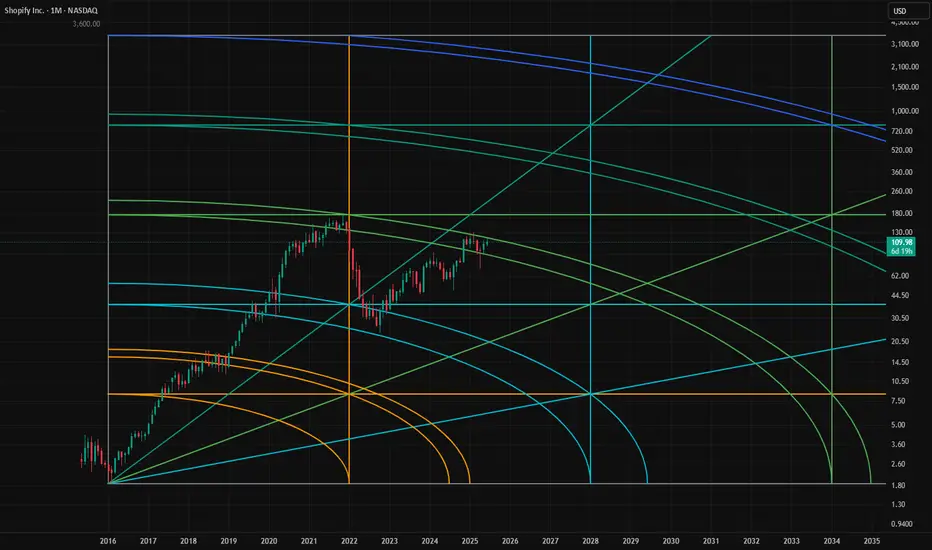
$SHOP will break out shortly! Shopify is dtuck under it's arc for a while now, Ones it breaks it will gravitade to the next one. Good Symmetry.
Gannangles
How Gann’s Square of 9 Reveals Hidden Time Cycles in the US500In today’s fast-moving markets, most traders are stuck reacting, chasing signals, hunting for breakouts, and trying to make sense of noise. But what if you could predict where the market might turn, not just based on price, but on time itself?
That’s exactly what W.D. Gann mastered. His tools, like the Square of 9, weren’t just about charts, they were about timing the rhythm of the market. Today, I’ll walk you through a real-world example on the US500, using Gann’s time technique on the 5-minute chart. This isn't theory. This is how you can bring Gann’s legacy to life in real-time trading.
Step 1: Don’t Start on the 5-Minute—Zoom Out First
The first thing to understand is that not every swing high or low is meaningful. To apply Gann’s time analysis correctly, you must choose swing points that matter—and that means looking at the higher timeframes.
Before diving into the 5-minute chart, I always analyze the 15-minute, 1-hour, and 4-hour charts. If a swing high or low on the 5-minute lines up with a key support or resistance zone from those larger timeframes, that’s your signal. These are levels where institutions and big players act, and that gives your analysis a real edge.
So, once I identified a swing high and low on the 5-minute chart that aligned perfectly with a 1-hour resistance zone and a 4-hour support level, I knew I had something solid.
Step 2: Counting Bars – The Foundation of Time Analysis
From the chosen swing low to the swing high, the market took 9 bars to complete the move. That number isn’t just a count—it becomes our anchor in time.
Using my custom-built Gann Square of 9 spreadsheet, I plugged in this value. The spreadsheet then calculated future bar counts where the 45-degree time angle repeats, based on Gann’s time rotation principle.
The output gave us these key numbers: 16, 25, 36, 49, 64, 81
These are not arbitrary. They are time-based vibration points derived from Gann’s spiral math—each one representing a future window where the market is likely to shift.
Step 3: Letting Time Lead the Trade
Let’s walk through what happened at each of these time windows:
Bar 16: The market attempted to push higher—a classic manipulation move. Then came a sharp reversal. The 45-degree vibration was in effect. This was a textbook Gann-style turning point.
Bar 25: No sharp reversal, but momentum slowed and price started consolidating. This was a structural pause—just as important as a reversal for those watching intraday shifts.
Bar 36: This one was dramatic. The market had been falling, but as we approached the 36th bar, rejection candles started appearing. Selling pressure dried up, and buyers stepped in. Soon after, a bullish breakout followed. The time vibration had called it again.
Bar 49: After a strong bullish run, the price stalled and reversed almost precisely at this time point. This marked a shift back to bearish sentiment.
Bar 64: The downtrend lost steam. Price began forming a new swing low, and as we passed the 64-bar mark, bullish momentum returned. Another clean reversal.
Bar 81: The final vibration in this sequence. The bullish move slowed, candles shrunk, and volume faded. Then came a breakdown. A bearish turn right on time.
What This Means for You as a Trader
This sequence—from bar 16 to 81—is a masterclass in how time drives the market. It shows that price action is not random. It's governed by hidden cycles that most traders overlook. But when you apply Gann’s methods with precision, the market reveals its rhythm.
All we did was:
Identify a meaningful swing (validated by higher timeframes)
Count the bars between the swing low and high
Let the Square of 9 calculate the future time vibrations
From there, we simply watched and waited. And the market played out almost to the bar.
Conclusion: From Reactive to Predictive Trading
The real power of Gann’s techniques lies not in magic, but in mathematical and astrological precision. When you understand how time and price interact, you stop reacting—you start forecasting.
You stop chasing trades—you start anticipating reversals.
Gann’s Square of 9 isn’t just an old-school tool. With the right application, it becomes a modern forecasting machine. And with the help of tools like my custom spreadsheet, the entire process becomes simple, streamlined, and incredibly effective.
So the next time you’re about to take a trade, ask yourself:
Are you following price? Or are you following time?
Because when time is on your side, the market moves in your direction—not the other way around.

92% Win Rate Strategy Using Gann’s Planetary LongitudeHave you ever wondered how some traders seem to anticipate market reversals with uncanny precision, almost as if they can see into the future?
Well, what if I told you that the secret doesn’t lie in guesswork or traditional retail indicators, but in the heavens themselves?
Let me walk you through one of the most powerful forecasting tools in Gann's arsenal—the Planetary Longitude Method and how I used it to identify the exact price level from which the market reversed.
The Power of Planetary Time Cycles in Trading
This technique isn’t based on patterns, trendlines, or lagging indicators. It’s rooted in precise planetary time cycles, the same natural laws that govern the movement of celestial bodies.
Gann believed the markets were not chaotic but deeply connected to universal rhythm and planetary motion. According to his planetary longitude method, each planet holds a specific degree of longitude at any given time. These degrees can be directly mapped onto price charts, turning astronomical data into actionable trade setups.
When price meets planetary longitude, something extraordinary happens. These degrees act as invisible support and resistance levels—ones that retail traders never see. They are silent yet powerful markers of change, and because they are rooted in cosmic cycles, they give you a strategic edge in timing your trades.
Why These Degrees Matter
As a trader, what you’re truly looking for is reaction zones, areas where price is likely to pause, reverse, or accelerate. When planetary time and market price converge at a particular degree, it creates what Gann called a "vibrational point", a moment of energetic alignment. These are high-probability zones where you can anticipate market turning points with accuracy.
By tracking the longitudes of key planets, such as the Sun, Moon, Mars, Jupiter, or Saturn—you can identify these critical junctures. Each planet brings its own cycle, its own tempo. For deeper, longer-term reversals, I often rely on the slower-moving planets like Pluto, while for short-term setups, I look at the faster ones like the Moon or Mars.
How I Forecasted the US100 Reversal from 19,384.6
Now, let’s get practical.
In this recent example, I was closely watching the US100 index, where I anticipated a potential reversal around the level of 19,384.6. Was this just another support/resistance zone? Absolutely not.
Here’s how I arrived at this precise level using Gann’s Planetary Longitude Technique:
First, I took the price level of 19,384.6 and converted it into degrees. To do this, I simply subtracted 360 repeatedly from the price until I arrived at a number less than 360. This process is based on the 360° circle of the zodiac—once the price cycles through the full circle multiple times, what's left is the vibrational degree associated with that price. In this case, the price level of 19,384.6 converted to approximately 304.6°.
Then, I checked the planetary position of Pluto which was 303.55° in longitude.
This created a near-perfect alignment between Pluto’s time cycle and the vibrational price degree. When planetary time meets price, it forms a cosmic convergence zone—a point of natural balance where the market is highly likely to react. So, I wasn’t just guessing—I was waiting for that moment of planetary resonance.
And as the chart clearly shows, the market reacted sharply the moment it touched 19,384.6, confirming the sensitivity of this degree. It wasn’t random. It was a harmonic response, echoing the laws of cosmic vibration that Gann so strongly emphasized.
This is a real-time example of how combining planetary time with price geometry can give you a decisive trading edge, especially in forecasting major turning points.
Why This Method Works
The market respects these planetary degrees not because of mysticism, but because it moves in cycles—natural cycles that repeat. The alignment of price with planetary longitude often marks pivot points in the market.
And this method doesn’t just help with identifying reversals. It also enhances your entry and exit timing, allowing you to trade with confidence, knowing you're aligned with the larger cosmic structure that influences all things—including financial markets.
Final Thoughts
This is just one example of how planetary geometry, when applied correctly, can lead to powerful trade setups. While Pluto offers long-term signals, don’t underestimate the value of the Moon, Mars, or Jupiter for shorter timeframes. The market dances to their rhythm too.
And once you learn to listen to that rhythm, you'll never look at price the same way again.

Gann Astro Trading Strategy with 92% Win Rate !Gann Astro Trading Strategy with 92% Win Rate !
Unlocking Gann's Secrets: Time Cycles, Square of 9, and Planetary Influence
In this video, we will dive deep into Gann’s trading methods, uncovering how time cycles, Square of 9 calculations, and planetary influences — especially the Mars-Jupiter cycle and lunar cycles — shape market movements. We’ll explore how numerology shifts and square roots reveal hidden support and resistance levels, plus how planetary declinations influence both price action and market psychology. Whether you’re a seasoned trader or just discovering Gann’s techniques, this breakdown will give you powerful insights to time the markets more effectively.
What You’ll Learn in This Video:
- How to apply Gann’s Square of 9 to track market highs and lows.
- The power of Mars-Jupiter cycles in driving momentum and expansion.
- How lunar cycles and faster planets like Mercury influence short-term moves.
- Using numerology shifts and square roots to uncover hidden support and resistance levels.
- The role of planetary declinations in shaping market psychology and major trend reversals.
Why This Video is Essential for Traders:
- Understand how Gann’s time cycles predict market turning points.
- Gain an edge with astrological market analysis — beyond traditional technical methods.
- Learn to combine fast and slow planets to time entries and exits more precisely.
- Decode historic market moves like the 2008 crash through planetary geometry.
Unlock the power of Gann’s time cycles, Square of 9, Gann Wheel, Gann angles, and Gann Fan to forecast market moves with precision. Discover how the Mars-Jupiter cycle, lunar phases, Gann Master Time Factor, Gann Emblem, and planetary declinations impact price action and trend shifts. Learn how Gann’s Law of Vibration, numerology shifts, square roots, price-time squaring, and hidden vibrational levels reveal key support and resistance zones. Whether it’s tracking historic market crashes, price-time balance, or Gann’s astro-numerology, this strategy will refine your entry-exit timing for maximum profitability.

Gann Trading Strategy | Predict Market Highs & Lows with Gann.Gann Trading Strategy | Predict Market Highs & Lows with Gann Trading Strategy
In this video we will unlock historical secrets of Sacred Geometry and how they apply to financial markets through W.D. Gann's Time & Price concepts. This video explores the deep connection between natural mathematical principles, the Golden Ratio (0.618), Fibonacci levels, and market structure—all rooted in ancient sacred geometry used in art, architecture, and astronomy.
Markets are not random; they follow universal laws found in nature, human anatomy, and celestial movements. Gann discovered that time and price cycles repeat in predictable patterns, allowing traders to anticipate reversals with precision. This video will guide you through how to use these ancient principles in modern trading.
What You'll Learn in This Video:
✅ Understanding Gann’s Time & Price Geometry – The foundation of market movements
✅ Golden Ratio & Fibonacci Trading – How 0.618, 0.786, and 1.618 shape market trends
✅ The ABCD Pattern in Trading – How to use structured price action setups.
Discover the hidden connections between Sacred Geometry, W.D. Gann’s Time & Price principles, and financial markets in this powerful Gann trading lesson. Markets are not random; they move according to natural laws, mathematical ratios, and planetary cycles—the same principles found in ancient architecture, astronomy, and human biology. Gann’s work revealed that time and price must synchronize for major market reversals, and by understanding these patterns, traders can anticipate key turning points with accuracy. This lesson will dive deep into Gann’s geometric approach, the Golden Ratio (0.618), Fibonacci levels, and structured price action setups, all of which play a crucial role in market movements.

The Four Fears of Trading and the Law of HarmonyTrading is not just about charts, strategies, and numbers. It’s a psychological battlefield, where fear dominates — but there’s also an often-overlooked factor: harmony. WD Gann’s Law of Harmony teaches that markets, like people, have unique vibrations. When you trade in sync with stocks or currency pairs that ‘resonate’ with you, your confidence and performance improve. Let’s explore how combining Gann’s insights with an understanding of the Four Fears of Trading can create a balanced, more successful trading mindset.
What Is the Law of Harmony?
The Law of Harmony is one of WD Gann’s foundational principles. Gann believed that everything in the universe moves according to natural laws, and markets are no different. Each stock, commodity, or currency pair has its own ‘vibration’ or rhythm — a unique frequency that determines how it behaves. When a trader finds a market whose vibration aligns with their own psychological makeup and trading style, they experience greater clarity, confidence, and success. This is trading in harmony.
Gann used this principle to select markets that matched his analysis style, making it easier to forecast price movements. He believed that recognizing harmony between the trader and the market was just as important as the technical setup itself. He meticulously studied time cycles, price patterns, and astrological influences to find markets that moved in predictable, harmonic ways — and traded only those that felt “right.”
In essence, Gann’s Law of Harmony is about working with the market’s natural flow, not against it. When you’re in sync, trades feel clearer, decisions become easier, and success feels almost effortless.
The Four Fears of Trading
In a recent Twitter poll I conducted, 45% of traders admitted that fear was their toughest emotional challenge — more than greed, hope, or overconfidence. Fear in trading can be broken down into four key categories: the fear of losing money, fear of missing out (FOMO), fear of being wrong, and fear of leaving money on the table. Let’s explore each one — and how the Law of Harmony can help conquer them.
1. Fear of Losing Money
This is the most common fear among traders — nobody wants to lose money. The reality, however, is that losses are an inevitable part of trading. Trading is a game of probabilities, with each trade having around a 50% chance of success.
Many traders react to losses with irrational decisions like closing trades too early or holding onto losing trades in the hope they’ll bounce back. This behavior stems from loss aversion — the natural human tendency to avoid losses more than we seek equivalent gains.
How the Law of Harmony helps:
Trade assets that ‘vibe’ with you. Some stocks or forex pairs will naturally feel clearer and easier to predict — that’s harmony.
Stop forcing bad trades. If you consistently lose on a specific pair, stop forcing it. It might not align with your psychology.
Backtest your system. Develop and backtest a trading system over multiple market conditions (trending, sideways, volatile). When you find one that feels ‘right,’ stick with it.
2. Fear of Missing Out (FOMO)
FOMO drives traders to jump into unplanned trades, often near market tops, for fear they’ll miss a big move. This leads to poor entries, increased risk, and reduced potential rewards. The irony? These impulsive trades often result in losses.
How the Law of Harmony helps:
Shift your mindset from “making money” to “following a process.” Money is a byproduct of trading in harmony with the right instruments.
Accept that the market is endless. Opportunities are like waves — there’s always another one coming. When you trade in sync with a market’s natural rhythm, better setups come to you.
3. Fear of Being Wrong
From childhood, we’re conditioned to avoid mistakes. In trading, however, losses are not failures — they’re feedback. The fear of being wrong can cause traders to hold onto losing trades, cut winners short, or avoid taking trades altogether.
How the Law of Harmony helps:
Focus on pairs or stocks that feel intuitive. When you feel more connected to an asset’s behavior, the fear of being wrong diminishes.
Accept that not every market resonates with you — and that’s okay.
Embrace losing trades as a natural part of the business. Even in harmony, some trades won’t work — that’s part of the rhythm.
4. Fear of Leaving Money on the Table
This fear emerges when a trader exits a trade too soon, only to watch the market continue in their favor. It’s frustrating, but trying to capture every last pip is a recipe for disaster. Markets are unpredictable, and no one catches the exact top or bottom consistently.
How the Law of Harmony helps:
Trust the market’s rhythm. If you’re aligned with the right instrument, more opportunities will come.
Define your exit strategy before entering a trade.
Let go of perfection. Accept that partial profits are better than no profits. In a harmonious market relationship, consistency matters more than squeezing every move.
Final Thoughts: Finding Harmony in Trading
Fear is a natural part of trading — it’s part of being human. The goal isn’t to eliminate fear but to manage it. By identifying which type of fear affects you the most and combining it with Gann’s Law of Harmony, you’ll make more rational decisions and improve your long-term performance.
Imagine you’re at a party. A mutual friend introduces you to a new group of people. You might vibe with some, while others give you an uncomfortable feeling. Stocks and forex pairs work the same way. You naturally gel with some, understanding their behavior and making profitable trades, while others consistently lead to losses.
The secret to long-term trading success is not forcing trades or chasing markets — it’s about finding what resonates with you. Focus on the process, trade in harmony, and the profits will follow.
Remember: The market doesn’t reward those who fight it. It rewards those who flow with it.
Happy trading!

GBPUSD - SHORTConsider the development of a strong South Impulse. Sell on a false breakout or current price level! Target the lower Demand Zone.
GBPUSD - SHORT
ENTRY PRICE - 1.29420
SL - 1.30700
TP - 1.26240
Always follow the 6 Golden Rules of Money Management:
1. Protect your gains and never enter into a position without setting a stop loss.
2. Always trade with a Risk-Reward Ratio of 1 to 1.5 or better.
3. Never over-leverage your account.
4. Accept your losses, move on to the next trade and trust the software.
5. Make realistic goals that can be achieved within reason.
6. Always trade with money you can afford to lose.
Please leave your comment and support me with like if you agree with my idea. If you have a different view, please also share with me your idea in the comments.
Have a nice day!

AUDUSD – LONGAUDUSD – LONG
ENTRY PRICE - 0.62850
SL - 0.61800
TP - 0.64900
Always follow the 6 Golden Rules of Money Management:
1. Protect your gains and never enter into a position without setting a stop loss.
2. Always trade with a Risk-Reward Ratio of 1 to 1.5 or better.
3. Never over-leverage your account.
4. Accept your losses, move on to the next trade and trust the software.
5. Make realistic goals that can be achieved within reason.
6. Always trade with money you can afford to lose.
Please leave your comment and support me with like if you agree with my idea. If you have a different view, please also share with me your idea in the comments.
Have a nice day!

Time the Markets Like W.D. Gann Using Planetary & Lunar Cycles! Unlock the Secrets of W.D. Gann’s Trading Method!
Is it possible to predict market movements using astrological cycles, planetary longitudes, and time-price harmonics? In this in-depth video, we explore how W.D. Gann’s trading strategies used the Square of 9, time cycles, and astro cycles to anticipate market highs and lows with incredible accuracy.
Gann believed that “time and price are equal”, meaning that markets move in predictable mathematical and astrological cycles rather than randomly. We’ll show real examples from Soybeans, Tesla, and Amazon, demonstrating how Gann’s time cycles trading strategy can be applied to today’s financial markets.
What You’ll Learn in This Video:
✔ Gann Square of 9 & Price-Time Convergence – How market prices align with planetary degrees
✔ Astro Trading Strategy – Using planetary longitudes, planetary aspects, and alignments for trade timing
✔ Gann’s Time Cycles Trading Strategy – Identifying reversal dates using time and price calculations
✔ Gann Cosmogram Strategy – How to use the cosmogram for timing major market moves
✔ Price & Longitude Equivalence – Understanding why certain prices act as natural support/resistance
✔ Astro Time Cycles & Harmonics – Discovering how planetary angles influence market trends
✔ Gann's Square of 144 & Other Geometric Forecasting Tools – Using squares and angles for market predictions
✔ The Role of Numerology in Gann Trading – How numbers relate to market movements
✔ How to Apply Gann’s Techniques in Forex, Stocks & Commodities
Why This Video Is Important for Traders:
- Learn how to predict market reversals instead of reacting to them.
- Gain insights into historical price movements and time cycles.
- Improve your technical analysis skills with Gann's mathematical and astrological approach.
- Understand why markets reverse at specific dates and price levels.
- Apply astro trading strategies and planetary cycles to your trades for better accuracy.
This is one of the most detailed explanations of Gann’s astro-trading methods, so make sure to watch until the end! Whether you're a Gann enthusiast, forex trader, stock market investor, or commodities trader, this video will give you actionable insights into how to use Gann’s techniques for trading success.

Possible Downtrend for IDX Composite Back to 6000A deep analysis found that we may experience a possible downward movement for IDX Composite Back to 6000 that peaked around March 5, 2025

How to Predict Market Highs - Lows with Gann Astro Trading.How to Predict Market Highs & Lows with Gann Time & Price Theory
Gann Planetary Time Cycles | The Only Proven Way to Predict Market Reversals With 95% Accuracy.
In this in-depth Video, we explore Gann Astro Trading and uncover how Gann’s time and price square techniques can help predict major market reversals. By understanding Gann’s planetary cycles, you’ll learn how planetary movements influence price action and how traders can use this knowledge for precise entry and exit points.
🔹 What You Will Learn in This Video:
✅ How Gann used planetary cycles to forecast market trends
✅ The connection between time and price and how they square for reversals
✅ Identifying market turning points using planetary trend lines
✅ The significance of planetary longitudes and key angles (e.g., 135°, 180°) in trading
✅ Using major planetary pairs (e.g., Mars-Uranus, Saturn-Sun) to find support & resistance
✅ How traders subconsciously react to planetary movements and price levels
✅ The importance of using long-term charts for accurate forecasting
✅ Finding a universal price conversion for a stock, forex pair, or commodity
📈 Why Gann’s Astro Techniques Work:
Gann believed that financial markets move in harmony with planetary cycles. By applying his time cycles and planetary movements, traders can decode price action and anticipate future highs and lows.
Gann Astro Trading | The Secret to Predicting Market Reversals with Planetary Cycles
Gann Astro trading is a highly advanced market forecasting method that combines W.D. Gann’s time and price principles with planetary cycles, astrology, and mathematical timing techniques to predict market movements with unmatched precision. Gann believed that markets are not random but move in cyclical patterns influenced by celestial forces, planetary transits, and natural laws. By decoding these cycles, traders can anticipate highs, lows, reversals, and trend shifts before they happen, gaining a significant edge in forex, stocks, and crypto trading.
This strategy goes beyond conventional technical analysis by integrating astro-financial patterns, Gann angles, the Square of Nine, and harmonic time cycles to identify the exact moments when time and price align. When this happens, explosive market moves occur, creating high-probability trade setups with minimal risk. Whether you are a day trader or a long-term investor, mastering Gann Astro trading can help you forecast major market turning points, trade with confidence, and maximize profits while minimizing uncertainty.
Traders who apply Gann’s planetary time cycles understand how astro-trading indicators, retrogrades, conjunctions, and planetary aspects influence market behavior. Learning this powerful yet hidden method allows you to see what most traders miss, making it one of the most profitable and accurate trading techniques available today.

Unlocking Market Secrets with Sacred GeometryIn this post we’ll dive into sacred geometry and how it is used in trading. Geometry isn’t just shapes—it’s the foundation of nature, architecture, and even trading.
From Pythagoras to Gann, great minds have studied these patterns to unlock hidden market signals. Let’s break down these powerful concepts and see how we can apply them to our own strategies!
First, take a look at this picture…
What you’re looking at here is a life-size oil portrait painting that’s displayed in the Manly P. Hall Institute of Metaphysics in Los Angeles, up on Mulholland Drive. This painting was done in 1929 by an artist named Augustus Knapp, and it’s a fascinating representation of one of the greatest minds in history named Pythagoras.
Now, here’s something interesting. There are no actual portraits of Pythagoras from his time. No real images of him exist just written descriptions passed down through the ages. So, this painting is a compilation of those descriptions, a vision of what they believed Pythagoras might have looked like based on historical accounts. But beyond the visual, what really matters is what this man achieved.
Pythagoras lived in 653 BC over 2,500 years ago and his contributions to mathematics, science, and even philosophy were so far ahead of his time that people today still struggle to comprehend how he knew what he did.
If you look closely at the painting, you’ll see a globe to the left-hand side. This is where things get really fascinating. Pythagoras not only knew that the Earth was round long before it became commonly accepted he also knew that the distance between the Earth and the Moon was approximately 250,000 miles. Let that sink in. Over 2,500 years ago, without modern telescopes, satellites, or space exploration, he was able to determine this astonishingly accurate measurement. How did he do it? That remains a mystery.
But his genius didn’t stop there. Pythagoras was the first person in recorded history to use the square root of numbers, laying the foundation for many of the mathematical principles we still use today. His contributions to geometry are legendary, with the Pythagorean Theorem being one of the most fundamental concepts in mathematics. He was able to see numbers not just as mere figures but as an intrinsic part of the universe, something deeply connected to music, nature, and even human existence.
Albert Einstein himself once said that there was God, there was man, and in between, there was Pythagoras. That’s how brilliant he was. Einstein, one of the greatest minds of the modern era, placed him in a category beyond ordinary human intellect. Many scholars and historians consider Pythagoras one of the four or five most intelligent people to have ever walked the Earth.
Now, I want you to pay close attention to something else in this painting. If you look at Pythagoras’ right hand, you’ll notice he’s holding a pyramid above his head. This is extremely significant. The pyramid was not just a symbol of ancient Egyptian architecture; it represented knowledge, sacred geometry, and the hidden mysteries of the universe. Pythagoras believed that the structure of the universe was based on mathematical harmony, and the pyramid was a reflection of this divine order. The way he holds it above his head symbolizes his deep understanding of higher knowledge, knowledge that very few people of his time and even in our time could comprehend.
TradingView
Pythagoras didn’t just study numbers, he studied their meaning, their vibrations, their connection to music, and how they formed the very fabric of reality. His school, which was more of a secret society, was devoted to exploring these truths, and his students followed strict codes of discipline, silence, and dedication to learning. Some say his teachings went beyond what we call science today, delving into the realms of metaphysics and spirituality.
So, when we talk about Pythagoras, we’re not just talking about a mathematician, we’re talking about a man who saw the universe in a way that very few have. He understood numbers not just as tools for calculation but as the building blocks of existence itself. This painting is not just a historical representation; it is a doorway into understanding one of the most profound thinkers in human history.
Alright, let's dive into something incredibly interesting, especially if you have an appreciation for Italian geniuses. We're talking about Leonardo da Vinci's division ratio and proportions of the human body this is pretty fascinating stuff.
If you look closely at da Vinci's sketches, you’ll notice that the ratios and proportions of the human body, like the measurements of bones, joints, and limbs, are not random. There’s an underlying order that we can see across the body. He was the first to really study and break down how the human body relates in terms of proportions, especially with the numbers that make up these proportions. For example, he measured everything from your radius to your phalanges, to the femur and the tibia. These are all linked in a very specific way. From the head to the pubic crest, these measurements fall into the 0.618 ratio, which is one of the most famous numbers in nature.
Now, let's take a look at why this is so significant. This isn’t just a random number—it’s actually tied to something we call the Golden Ratio or Phi, which is 0.618. It’s a ratio that appears in all kinds of natural patterns, from the spirals of seashells to the growth patterns of plants. Da Vinci was keen on observing these relationships, and he recorded them in his Codex, a collection of his writings and drawings.
Let me tell you a Fun fact, Bill Gates bought this Codex in 1982 for $20 million, and today, it’s housed in the Smithsonian Institute, traveling the world half the year and staying in Washington for the rest. Da Vinci was ahead of his time, so much so that when he wrote about this ratio, he didn’t just write it down plainly. In fact, he wrote everything in a mirror image, so you had to read it by holding the paper up to a mirror. Why? Well, a lot of his work was coded, not necessarily because he didn’t want people to understand it, but because he didn’t want to give away his discoveries easily. He was mysterious like that!
Now, let’s zoom out and look at something even more mind-blowing. If you go back to ancient times—way before da Vinci’s time—you’ll see that the Egyptians were using this same ratio. Take the pyramids for instance. The dimensions of the human body, from the head to the feet, also follow this pattern of 3, 5, 8, 13, 21... all culminating in the golden ratio of 0.618. The Egyptians were just as obsessed with these measurements and proportions, and you’ll find this same 0.618 showing up in their designs and architecture, too. It’s something that connects us to the very ancient foundations of human culture and knowledge.
What’s even crazier is that this ratio holds up in medical science. If your body proportions are off by more than 5% from the standard, it actually gets classified under conditions like dwarfism or other abnormalities. So, this ratio is so accurate that it defines what the "ideal" proportions of the human body should be. When you study these numbers and ratios, you realize just how mathematically perfect the human body is designed—at least in theory!
Now let’s take this to a different dimension, The DNA. The very structure of DNA follows this same fibonacci spiral, the same pattern of proportions that we see in the human body. The DNA helix is a perfect example of the golden ratio at play in biology. So when you look at the genetic code, you’re actually looking at the same patterns that show up in the pyramids, the human body, and even the very spiral shape that defines life at its most fundamental level.
And speaking of DNA, there’s an interesting tidbit related to Italy. This is a bit of trivia: There has never been a murder conviction in Italy because of the uniformity of DNA in Italians. Everyone shares such a similar genetic code that it’s almost impossible to distinguish one person from another in certain cases. Fascinating, right?
Alright, now that we’ve explored these mind-blowing connections between da Vinci’s proportions, the golden ratio, and DNA, let’s bring it back to the market and how we can use these ratios to help us with trading.
Here’s what you need to know, The same ratios that define proportions in nature can be applied to price movements in the market. For example, in the AUDUSD pair, you can use these numbers to identify key levels where price may reverse. Let’s break this down a bit further. If you look at the market's movements on a Weekly chart, you might not notice anything special at first. But when you start applying the 618 retracement, 786 retracement, or 161.8% extension, suddenly these numbers start lining up with the price action.
As we’ve seen, the same sacred geometry and mathematical principles that govern nature, architecture, and even DNA also play a crucial role in the financial markets. From Pythagoras to da Vinci, these hidden patterns have guided some of the greatest minds in history—and now, they can guide us in trading.
The market, like the universe, moves in harmony with these timeless patterns.
Keep studying, keep observing, and most importantly—keep refining your strategy. The more you align with these natural cycles, the better your trading decisions will become. See you in the next post, where we’ll continue uncovering the secrets of market geometry!

"Gann’s Secrets: Time Cycles, Square of 9 & Market Reversals"Gann’s Trading Secrets | Gann Time Cycles, Gann Square of 9, and Predicting Market Reversals
📌 Topics Covered in This Video:
- The Power of Gann 90 in Market Cycles
- Gann Time Cycles & Gann Market Timing
- Gann Fibonacci levels & Gann Price Levels
- Gann Fan & The Billion-Dollar Trade
- Gann Square of 9 & Price Movements
- The 90-Year Gann Market Cycle & Financial Crises
- How to Use Gann’s Methods in Modern Trading
📌 Why You Should Watch This Video:
- Learn how to forecast market tops and bottoms using W.D. Gann’s techniques.
- Understand how Gann time cycles and Gann price action align in market movements.
- See real-world examples of how Gann’s methods predicted historical market crashes and reversals.
- Discover how major traders, including George Soros, unknowingly used Gann's principles to execute billion-dollar trades.
📌 Timestamps: Gann’s Trading Secrets | Gann Time Cycles, Square of 9, and Predicting Market Reversals
00:00 ▶️ Introduction
00:43 ▶️ W.D.Gann
01:35 ▶️ His Contribution to Technical Analysis
02:19 ▶️ Core Principals
04:13 ▶️ Price and Market Cycles
04:52 ▶️ What is Swing Chart?
06:32 ▶️ Gann Square of 9
07:12 ▶️ Gann's Relentless Study of Markets
07:37 ▶️ The Role of Astrology in Market Cycle
08:13 ▶️ Key Natural Market Turning Points
09:12 ▶️ Gann's 50% Rule
09:58 ▶️ The Three Key factors in Gann Trading
10:13 ▶️ The Price
14:07 ▶️ Gann Fan
14:43 ▶️ The Core Concept of Time-Price Balance
19:02 ▶️ The Role of Geometry in Gann's Work
19:41 ▶️ The Power of the Number 3
24:37 ▶️ The 90-Time Cycle in the Market
27:40 ▶️ Famous Trader George Soros
29:52 ▶️ Historical Economic Depression
30:35 ▶️ 2019 as a Key Time Cycle
31:10 ▶️ Economic Conditions

How Your Brain Tricks You Into Making Bad Trading Decisions!!!Hello everyone! Hope you’re doing well. Today, we’re diving into a crucial topic—how your brain can work against you in trading if it’s not trained properly. Many traders think they’re making logical decisions, but subconscious biases and emotions often take control.
Our brain operates in two modes: intuitive thinking (fast, emotional, automatic) and deliberative thinking (slow, logical, analytical). In trading, intuition can lead to impulsive mistakes—chasing price moves, hesitating on good setups, or exiting too early out of fear.
To improve, traders must shift from intuition to deliberation by following structured plans, back testing strategies, and practicing emotional discipline. In this discussion, we’ll explore how to overcome these mental biases and make smarter trading decisions. Let’s get started!
Most traders face common mistakes—exiting winners too early, letting profits turn into losses, holding onto bad trades, or making impulsive decisions. Why? Because our brain isn’t wired for trading. In everyday life, instincts help us, but in trading, they often lead to fear, greed, and denial.
Your Brain Operates in Two Modes
Just like in daily life, where we sometimes act on reflex and other times think things through carefully, our trading mind also operates in two distinct modes: intuitive thinking and deliberative thinking. Intuitive thinking is fast, automatic, and effortless. It helps us make quick decisions, like braking suddenly when a car stops in front of us. However, in trading, this rapid decision-making often leads to impulsive actions driven by emotions like fear and greed. This is why many traders enter or exit trades without a solid plan, reacting to market movements instead of following a strategy.
On the other hand, deliberative thinking is slow, effortful, and analytical. This is the part of the brain that carefully weighs options, follows rules, and makes logical decisions—like when solving a complex math problem or planning a trading strategy.
Our intuitive brain is designed to make quick and automatic decisions with minimal effort. This is the part of the brain that helps us react instantly to situations—like catching a falling object or braking suddenly while driving. It relies on patterns, emotions, and past experiences to make snap judgments. In everyday life, this ability is incredibly useful, saving us time and energy. However, when it comes to trading, this fast-thinking system can often lead us into trouble.
For example, a trader might see the market rising rapidly and instinctively think, “This can’t go any higher! I should short it now.” This reaction feels obvious in the moment, but it lacks deeper analysis. The market could continue rising, trapping the trader in a losing position. Because intuitive thinking is based on gut feelings rather than structured reasoning, it often leads to impulsive and emotionally driven trading decisions. In the next slides, we’ll explore how to counterbalance this instinct with deliberative thinking—the slow, logical approach that leads to better trading decisions.
Unlike intuitive thinking, which reacts quickly and emotionally, deliberative thinking is slow, effortful, and analytical. It requires conscious thought, logical reasoning, and careful consideration before making a decision. This is the part of the brain that helps traders analyze probabilities, assess risks, and make well-informed choices rather than acting on impulse. While it takes more time and effort, it leads to better trading outcomes because decisions are based on data and strategy rather than emotions.
For example, instead of immediately reacting to a fast-moving market, a deliberative trader might pause and think, “Let me check the higher time frame before deciding.” This approach helps traders avoid unnecessary risks and false signals by ensuring that every trade is well-planned. The most successful traders operate primarily in this mode, following a structured process that includes technical analysis, risk management, and reviewing past trades. In the next slides, we’ll discuss how to train our brains to rely more on deliberative thinking and reduce emotional reactions in trading.
Take a moment to answer these two questions:
A bat and a ball cost ₹150 in total. The bat costs ₹120 more than the ball. How much does the ball cost?
If 5 machines take 5 minutes to make 5 widgets, how long would 100 machines take to make 100 widgets?
At first glance, your brain might immediately jump to an answer. If you thought ₹30 for the first question or 100 minutes for the second, you’re relying on intuitive thinking. These answers feel right but are actually incorrect. The correct answers are ₹15 for the ball (since the bat costs ₹135) and 5 minutes for the second question (since each machine’s rate of production stays the same).
This exercise shows how intuitive thinking can mislead us when dealing with numbers and logic-based problems. The same happens in trading—snap decisions based on gut feelings often lead to costly mistakes. To improve as traders, we need to slow down, double-check our reasoning, and shift into deliberative thinking. In the next slides, we’ll explore how to strengthen this skill and apply it to trading decisions.
Did Your Intuition Trick You?
Let’s review the answers:
Answer 1: The ball costs ₹15, not ₹30! If the ball were ₹30, the bat would be ₹150 (₹120 more), making the total ₹180, which is incorrect. The correct way to solve it is by setting up an equation:
Let the ball cost x.
The bat costs x + 120.
So, x + (x + 120) = 150 → 2x + 120 = 150 → 2x = 30 → x = 15.
Answer 2: The correct answer is 5 minutes, not 100 minutes! Since 5 machines take 5 minutes to make 5 widgets, each machine produces 1 widget in 5 minutes. If we increase the number of machines to 100, each still takes 5 minutes to produce a widget, so 100 machines will still take 5 minutes to make 100 widgets.
Most people get these answers wrong because their intuitive brain jumps to conclusions without thinking through the logic. This is exactly how traders make impulsive mistakes—by relying on gut feelings instead of slowing down to analyze the situation properly. The key lesson here is that we must train ourselves to pause, question our first reaction, and shift into deliberative thinking when making trading decisions.
Why is Intuitive Thinking Dangerous in Trading?
Intuitive thinking is great for quick decisions in everyday life, like catching a falling object or reacting to danger. However, in trading, this fast-thinking system becomes a problem because it takes shortcuts, ignores probabilities, and acts on emotions rather than logic. When traders rely on intuition, they often react impulsively to price movements, overestimate their ability to predict the market, and make decisions based on fear or greed rather than strategy.
For example, a trader might see a market rapidly rising and instinctively think, “This can’t go any higher—I should short it!” without checking key levels or trends. Or, after a few losses, they may feel the urge to take revenge trades, hoping to recover quickly. These emotional reactions lead to poor risk management and inconsistent results. To succeed in trading, we must recognize these intuitive traps and learn to replace them with a structured, logical approach.
Let’s look at some common mistakes traders make due to intuitive thinking:
Shorting just because the market has risen too much: A trader might see a sharp price increase and feel like it’s too high to continue, instinctively thinking, “This can’t go any higher; it’s due for a drop.” However, the market doesn’t always follow logical patterns, and this emotional reaction can lead to premature trades that result in losses.
Buying just because the market is falling: Similarly, traders may feel compelled to buy when the market falls too much, thinking, “It’s too low to go any further.” This belief, without proper analysis, can lead to buying into a downtrend or even catching a falling knife, resulting in significant losses.
Taking tips from social media without analysis: Many traders fall into the trap of acting on market tips or rumors they see on social media or trading forums. These decisions are often made without proper research, relying purely on gut feelings or herd mentality.
If you've ever taken a trade just because it "felt right" without fully analyzing the situation, chances are your intuitive brain was in control. These emotional decisions are natural, but they often lead to costly mistakes. The key to improving your trading is learning to slow down, analyze the situation carefully, and avoid rushing into trades based on impulse.
Why Deliberative Thinking Matters
Deliberative thinking is the key to becoming a successful trader because it encourages us to assess probabilities, reduce impulsive trades, and ensure well-thought-out decisions. Instead of acting on gut feelings, traders who use deliberative thinking take the time to analyze market conditions, trends, and risks. By calculating probabilities, reviewing different scenarios, and sticking to a solid trading plan, they can make more rational decisions that are grounded in logic, not emotions.
This slow, methodical approach may seem counterintuitive in a fast-paced market, but it’s what separates successful traders from those who constantly chase the market. The best traders don’t act on impulse; they analyze, think critically, and then trade. This approach leads to consistency in trading, as decisions are based on a systematic process rather than emotional reactions. By training your brain to operate in this way, you’ll improve your decision-making and reduce the likelihood of impulsive, emotional mistakes.
Let’s look at a real-world example of how intuitive thinking can trap traders:
The market rallies from 26,800 to 28,800, and as the price starts to pull back, lower lows form on the hourly chart. Many traders, relying on the short-term price action, decide to short the market, thinking the rally is over. However, when you zoom out and check the daily chart, you notice that there’s no clear reversal signal—it's still showing an overall uptrend.
Despite this, many traders act impulsively based on what they see on the smaller time frames, only to watch the market rally another 500 points, trapping those who shorted the market.
This is exactly how intuitive traders get trapped—by making decisions based on the lower time frames without considering the bigger picture. Deliberative thinking would involve checking higher time frames, assessing the trend, and waiting for a proper confirmation before entering a trade. By training yourself to think this way, you’ll avoid getting caught in market traps like this one.
One of the best strategies for avoiding impulsive mistakes is to always check daily or weekly charts before taking a trade. While it’s tempting to act on short-term movements, smart traders zoom out to get a clearer picture of the market's overall trend. By analyzing higher time frames, you can see if the market is truly reversing or if it's simply a temporary pullback within a larger trend.
It’s important to look for confirmation of trends before acting. If the higher time frames show an uptrend, but the lower time frames show a temporary dip, it may be wise to wait for confirmation before making a trade. Don’t rush based on short-term movements; give yourself time to assess the bigger picture and make decisions based on a well-thought-out analysis rather than emotional reactions.
Remember, successful traders understand that the higher time frame offers critical insights into market direction. By incorporating this approach, you’ll make more informed, consistent trading decisions and avoid getting trapped by short-term fluctuations.
Shifting from intuitive to deliberative trading takes practice, but with consistent effort, you can train your mind to make better decisions. Here’s how you can start:
Review past trades – Were they intuitive or deliberate? Reflecting on your previous trades helps you identify whether your decisions were based on impulse or careful analysis. Understanding the reasoning behind your past trades can help you improve future ones.
Ask ‘Why?’ before every trade: Before entering any position, take a moment to ask yourself, “Why am I taking this trade?” This forces you to think critically and ensures that your decision is based on analysis rather than emotions.
Use probabilities, not gut feelings: Deliberative thinking is based on probability, so focus on statistical analysis and historical patterns rather than relying on your gut. This might include checking your risk-to-reward ratio or waiting for confirmation signals from multiple indicators.
Follow a structured trading plan: A solid trading plan with clearly defined rules and guidelines will help you make logical, consistent decisions. When you follow a plan, you’re less likely to make emotional, impulsive trades.
By implementing these steps, you’ll gradually train your mind to operate more deliberately, leading to more disciplined and profitable trading. Remember, trading is a skill that improves with practice, so take the time to develop your deliberative thinking.
A great historical example of intuitive thinking gone wrong is the Dot-Com Bubble of the late 1990s. During this time, many companies added “.com” to their names, capitalizing on the internet boom. Investors rushed in blindly, often buying shares of these companies based purely on the excitement of the market and the fear of missing out (FOMO).
However, many of these companies had no real business model or clear path to profitability. Investors, driven by emotional excitement and herd mentality, ignored the fundamentals—such as profitability, cash flow, and market demand. As a result, the market eventually collapsed, wiping out traders who didn’t take the time to analyze the companies' real value and business models.
This is a perfect example of intuitive investors acting on emotions and hype without real analysis—and losing big. To avoid this trap, it’s important to apply deliberative thinking, focusing on thorough research, fundamental analysis, and careful assessment of market conditions. This case study shows the importance of not jumping into investments based on emotional impulses but making decisions grounded in solid analysis.
To become a successful trader, you must shift from relying on intuitive thinking to embracing deliberative thinking. Here’s how you can start making that transition:
Avoid easy, obvious trades: If a trade feels too easy or too obvious, it’s often a trap. The market is complex, and quick decisions based on gut feelings usually lead to impulsive mistakes. Take the time to think through your trades, even if they seem like a “sure thing.”
Develop patience and discipline: Patience is key in trading. Instead of reacting immediately to market moves, wait for the right setups and confirmations. Discipline ensures you follow your plan and don’t get swept up in the moment.
Learn to think in probabilities: Trading is about probabilities, not certainty. Start thinking in terms of risk and reward, and assess the likelihood of different outcomes before entering a trade. This shift in mindset will help you make more rational, logical decisions.
Be skeptical of ‘obvious’ trade setups: If a trade seems too perfect or too easy, it’s worth questioning. Often, the most obvious setups are the ones that lead to losses. Always do your due diligence and question your assumptions before pulling the trigger.
By making these changes, you’ll develop a trading mindset that focuses on thoughtful analysis, patience, and probability, rather than emotional, impulsive decisions. The goal is to think deeper, be more strategic, and avoid rushing into trades based on intuition.
Now that we’ve covered the key principles, it’s time to take action.
Start by reviewing your past trades. This is crucial for identifying whether your decisions were based on intuition or deliberate thinking. By reflecting on your trades, you can spot patterns and areas where you may have made impulsive decisions.
Next, identify your intuitive mistakes. Think about trades where you acted quickly or without full analysis. Were you influenced by emotions like fear or greed? Understanding these mistakes helps you avoid repeating them in the future.
Finally, commit to making deliberate decisions going forward. Before you place your next trade, take a step back. Analyze the market, assess probabilities, and follow your trading plan. This shift to a more thoughtful, disciplined approach is what will help you become a more consistent and successful trader.
Your next trade is an opportunity to put these principles into practice. Let’s focus on making smarter, more deliberate decisions from here on out!

Gann Reversals: 144-225 Time Cycle & Fibonacci StrategyMastering Gann Market Reversals The 144 - 225 Time & Gann Price Cycle + Fibonacci Trading Strategy.
We dive deep into a powerful trading strategy that combines Gann’s 144-225 time and price cycles with Fibonacci retracement levels to predict market reversals with high accuracy. We explore how to identify key turning points, confirm entries using price action, and develop a well-planned exit strategy to maximize profits.
Whether you're a beginner or an experienced trader, this method will provide you with a structured approach to understanding price movements and timing your trades more effectively. Apply these principles to your trading routine and start seeing improvements in your decision-making and trade execution.
Learn how to master Gann market reversals using the 144-225 time cycle and Gann price synchronization, combined with Fibonacci trading strategies. This powerful approach helps traders identify key turning points, align time and price for precision entries, and enhance market predictions with Fibonacci confluence.

BTC key of 9 7 day chartI believe that 9 is in and we are in a position to take a short position here until june 2025 before the market continues its bullish trend upwards if you like what you see or would like to learn more about the methods I'm using reach out and ask.

Gann Time Cycles Strategy: How To Predict Market Highs & Lows ?Gann Time Cycles Strategy: Predict Market Highs & Lows with Precision.
Mastering Gann Time Cycles: The Key to Predicting Market Highs & Lows
In this Gann trading strategy on time cycles, we explore a powerful method to predict market highs, lows, and reversals with precision. Gann’s theory is based on the principle that time governs market movements and that price action follows a structured mathematical cycle. By understanding and applying Gann Time Cycles, traders can identify key turning points well in advance, giving them a significant edge in the market.
The Importance of Time in Market Movements
W.D. Gann famously stated that "Time is more important than price. When the time is up, the market will reverse based on time." This means that while price levels are crucial, it is the time factor that ultimately determines when the market will make a major move. By analyzing Gann’s time cycles, we can predict periods where a reversal or a strong trend continuation is likely to occur.
📌 Timestamps: Gann Time-Price Squares: The Secret to Predicting Market Highs & Lows
00:00 ▶️ Introduction.
00:25 ▶️ Risk Disclaimer.
01:30 ▶️ What is Gann Time and Price Square.
02:10 ▶️ Key Numbers in Gann's Method
03:10 ▶️ Constructing Time and Price Squares
04:19 ▶️ Step 1 - Identify a Major Swing High or Low
05:18 ▶️ Step 2 - Apply Gann’s Time Cycles
05:39 ▶️ Step 3 - Draw a Gann Square
06:15 ▶️ Step 4 - Look for Price Reactions at Time Point
06:45 ▶️ Step 5 - Use Gann Angles for Confirmation
07:20 ▶️ Step 6 - Confirm with Market Behavior
07:50 ▶️ Step 7 - Set Entry, Stop-Loss, and Take Profit
08:30 ▶️ Gann Time-Price Squares: The Secret to Predicting Market Highs & Lows | Example - 1
14:00 ▶️ Gann Time-Price Squares: The Secret to Predicting Market Highs & Lows | Example - 2
16:50▶️ Conclusion & Key Takeaways
Applying Gann’s Time Cycles to Identify Market Turning Points
To successfully use this strategy, traders need to:
✅ Identify major swing highs and lows in the market
✅ Apply Gann’s time cycles to determine potential reversal points
✅ Use the Gann Square in TradingView to map key price levels
✅ Recognize time-price intersections to pinpoint entry opportunities
✅ Utilize Gann angles for additional confirmation
✅ Set proper entry points, stop-losses, and take-profits based on time predictions
By integrating these steps into your trading plan, you can improve your entry and exit accuracy and anticipate market movements before they happen.
Conclusion: Why Gann Time Cycles Are a Game-Changer
Gann’s Time Cycles provide traders with an advanced forecasting tool that allows them to anticipate market movements with greater precision. Unlike traditional technical indicators that rely on lagging price data, Gann’s method allows you to predict future reversals before they happen, giving you an edge over other traders.
If you apply this strategy correctly, you will begin to see the certainty within the randomness of the market. The key is to remain disciplined, test these time cycles on real charts, and refine your understanding through consistent practice.

Gann Astro Trading: Psychology & Patience in Intraday Gold TradeIn this trading idea, I will provide a detailed breakdown of the live trade I executed on Monday, January 12, 2024, on gold, using advanced mathematical modules of Gann Astro. This trade was entered precisely at the market low, as I had calculated the timing of the low formation three hours in advance.
While the trade setup was accurate, it took over 7 hours for the price to reach the target. In this breakdown, I will explain the complete trade analysis with supporting data, charts, and visuals. Additionally, I will dive into the psychological aspects of holding a trade for an extended period, maintaining patience, and interpreting price action as a delivery algorithm. I'll also discuss observing liquidity buildup in real-time and the mindset required to stay composed while navigating market movements.
Significant points of this Gann Astro trade are as below
- Detailed breakdown of the live gold trade executed on Monday, January 12, 2024, using advanced Gann Astro mathematical modules.
- Trade entry was made precisely at the market low, calculated 3 hours in advance.
- Explanation of the trade setup with supporting data, charts, and visuals.
- Insights into the psychology of holding trades for an extended period (this trade took over 7 hours to reach the target).
- Understanding price action as a price delivery algorithm and observing liquidity buildup in real-time.
- Discussion on maintaining patience and composure during prolonged trades.
As shown in the charts, the reversal time for gold was calculated 3 hours in advance using Gann Astro Trading principles and mathematical modules. The reversal occurred at 8:00 AM New York time, as observed on the 90-minute chart, where I anticipated the price to form a low.
Now, you might wonder why the 90-minute timeframe was chosen. This ties into the universal concept that everything vibrates at a specific frequency, including markets, aligning with the significance of 3-6-9, as extensively discussed by Gann.
Knowing the exact reversal time eliminates uncertainty in trading, which directly enhances trading psychology. This clarity allows for patience and composure, avoiding impulsive actions. The ability to stay calm and wait for a setup to align with your analysis is an art mastered by only a few traders.
Most traders operate out of FOMO (Fear of Missing Out), often taking uncertain trades that fall under the category of gambling. True success in trading lies in patience, discipline, and the ability to observe the charts without acting prematurely. These traits separate professional traders from the majority who struggle to maintain consistency.
BUY ENTRY IN GOLD LONG TRADE WITH GANN ASTRO
After waiting for 3 hours, the market reached my calculated time and price level, aligning perfectly. As Gann emphasized, when time and price are equal, the market must reverse. With this principle, I executed a trade on gold using Gann Astro techniques in intraday trading. This is where the true challenge of trading begins—not in entering the trade, but in maintaining patience until the price either hits your stop loss or your profit target. Many traders fail at this critical stage due to a lack of discipline and risk management, trading without stop loss or proper planning. To trade successfully, one must approach the market with precision, patience, and a sound strategy.
Key Points:
1. Stop Loss is Essential:
- Trading without a stop loss is equivalent to gambling with hard-earned money.
- A solid risk management strategy is non-negotiable for long-term success.
2. Risk Management Rules:
- Always limit risk to 1% of your account per trade.
- Never over-leverage or expose yourself to unnecessary risk.
3. Learn to Stay Patient:
- Patience is a core skill in trading—waiting for the market to hit your levels and then staying disciplined in the trade.
- Avoid impulsive decisions driven by fear or greed.
4. Avoid Common Pitfalls:
- Many traders lose their entire capital within weeks due to poor risk management and lack of preparation.
- Focus on learning proper risk management before entering live markets.
By incorporating these principles, you can significantly improve your chances of success and build a sustainable trading career.
Patience in trading is a skill that requires not just discipline but also a deep understanding of how to manage emotions while observing the market's algorithmic price delivery in real-time. One of the most effective ways to stay focused is by minimizing the psychological triggers that impact your decision-making. Colours like red and green can strongly influence your mood and perspective during trading, which is why I switched to black-and-white candles when I started trading back in 2019. This change eliminates the emotional bias caused by colour psychology. Additionally, hiding your profit and loss figures while trading is another powerful way to stay emotionally neutral. Seeing how much you are making or losing can trigger fear of loss or overconfidence, which may lead to impulsive decisions. Removing these distractions helps you maintain clarity and focus during your trading session.
Key Points:
1. Eliminate Colour Psychology:
- Switch to black-and-white candles to avoid emotional biases caused by red and green colours.
- This reduces the impact of visual triggers on your mood and decision-making.
2. Hide Profit and Loss Figures:
- Turn off the display of your profit and loss numbers on the trading platform.
- This prevents emotional reactions like fear of loss or overconfidence from influencing your trades.
3. Stay Focused on Price Action:
- Concentrate solely on the market's price delivery without distractions.
- Train yourself to analyse the market algorithm objectively without emotional interference.
4. Build a Calm Trading Environment:
- Create a setup that minimizes external triggers and focuses on clear decision-making.
- Practice mindfulness and emotional control to remain patient and disciplined.
By implementing these steps, you can enhance your trading psychology and improve your ability to read the market with greater clarity and precision.
Once you master the foundational skills of managing emotions and maintaining patience, the real challenge begins—understanding the price delivery algorithms and their underlying intentions. The market operates on an algorithmic framework, where price delivery is designed to build liquidity and then seek it. To identify this process, you need to observe where liquidity is being left in real-time, which is often around old highs and lows. These areas act as targets for the algorithm as it seeks to capture liquidity. In the chart, I have marked the live formation of liquidity in the market, illustrating how the algorithm builds and targets these zones. By understanding this process, you gain an edge in predicting the market's next moves.
Keeping a detailed record of every trade, you take is crucial for long-term success in trading. Use software tools to record live trades and store the data systematically. This practice allows you to review your past performance, analyse what worked, and identify areas for improvement. Journaling is an essential habit in trading, as it not only tracks your progress but also accelerates your learning curve. The most successful traders consistently review their past trades, assess their strategies, and refine their approach to stay ahead in the game.
It’s been 6 hours since I entered the trade. I was patient and have mastered the art of trading psychology. With Gann Trading astro techniques and years of trading experience backed by data, I’ve honed my mindset for consistent success. For new traders, here are 10 ways to improve your trading psychology:
1. Cultivate Emotional Discipline.
Mastering trading psychology begins with controlling emotions like fear and greed. Recognize emotional triggers and respond with logic, not impulsivity.
2. Develop a Trading Plan.
A well-structured trading plan helps eliminate emotional decision-making. Include entry, exit, and risk management strategies to stay disciplined.
3. Practice Risk Management.
Never risk more than a small percentage of your capital on a single trade. Knowing your maximum loss tolerance minimizes stress and preserves mental clarity.
4. Keep a Trading Journal.
Record every trade, including rationale, outcomes, and emotions. Regularly review the journal to identify patterns and areas for improvement.
5. Focus on Process Over Outcome.
Prioritize consistent execution of your strategy rather than obsessing over profits. This shift in mindset builds confidence and long-term success.
6. Learn to Accept Losses.
Losses are a natural part of trading. Accept them as learning experiences rather than personal failures to maintain a positive mindset.
7. Practice Visualization and Mental Rehearsal.
Visualize different market scenarios and how you will respond. Mental rehearsal prepares you for stressful situations and improves decision-making.
8. Stay Patient and Avoid Overtrading.
Wait for high-probability setups that align with your strategy. Overtrading often stems from impatience and leads to unnecessary mistakes.
9. Maintain a Balanced Lifestyle.
Take care of your physical and mental health. Regular exercise, proper nutrition, and adequate rest are essential for maintaining focus and emotional stability.
10. Seek Continuous Education.
Stay updated with market trends, refine your strategies, and learn from experienced traders. An informed trader is a confident and less emotionally reactive trader.
Once you follow all these steps, the market rewards you with good trading profits. Just like in this chart, I entered at the low and exited at the top by practicing patience and executing trades only with a Gann astro and mathematical edge. This disciplined approach ensures consistent results and builds the foundation for long-term trading success.
1. Gann's Principle: Time is More Important than Price.
Understanding the timing of market movements is crucial, as time often dictates the outcome of trades more than price levels.
2. Everything in the Universe Vibrates on Specific Frequencies.
Market trends and patterns are influenced by universal vibrations, making it essential to align trading strategies with these natural cycles.

Predict market HIGH/LOW with Gann Astro Trading Calculated Gold’s Reversal 6 Hours Before It Happened Using Gann Astro Techniques
OANDA:XAUUSD
On December 24, I calculated a reversal in gold 6 hours prior to its occurrence, utilizing Gann Astro techniques and mathematical models. This analysis allowed me to identify key turning points in the market based on time rather than price.
Many traders focus solely on price, but Gann’s principles emphasize that time (Y-axis) is the dominant factor driving market movements. For this calculation, I incorporated the Ascendant as a critical element in my intraday trading approach, demonstrating the significance of aligning market analysis with time functions.
Key Observation:
The market reversed at exactly 10:30 AM New York Time (UTC-5), aligning perfectly with the pre-determined time calculated through Gann Astro techniques.
On the 45-minute timeframe for gold, the chart confirms the reversal occurred precisely at the calculated time. This underscores the reliability of time-based analysis over traditional methods that often focus on price alone.
Why Time is More Important than Price:
1. Time is constant and unaffected by external manipulation.
2. Highs and lows in the market are governed by fixed time cycles.
3. Price, being variable, is a secondary function delivered based on time.
By switching to the 15-minute timeframe, the precision of these calculations becomes even more evident. This highlights how time-based analysis reveals market behaviour that might otherwise appear random.
Gann Intraday Techniques in Action:
The Gann Astro methodology integrates planetary positions and mathematical principles to forecast turning points in the market. The principle "time is more important than price" is consistently validated, showing that market reversals are governed by time cycles rather than unpredictable price movements.
On December 26, after the market reopened, the price fulfilled its movement to key liquidity zones identified earlier. This demonstrates how time cycles dictate the market's behaviour, with price aligning naturally to these pre-determined movements.
Advanced Insights:
- The Y-axis represents time, the immutable factor.
- The X-axis represents price, which is secondary and can be influenced.
Most traders fail in the market because they only focus on PRICE. However, according to W.D. Gann's principles, TIME is MORE IMPORTANT THAN PRICE. Big institutions can manipulate price movements, but TIME is a fixed entity that cannot be altered.
The attached graph illustrates a fundamental yet overlooked concept:
1. Y-Axis → TIME
2. X-Axis → PRICE
In reality, every high or low in the market is pre-determined by TIME, not price. Gann's Astro methods use planetary positions, ascendants, and advanced mathematical calculations to predict EXACTLY when the next HIGH or LOW will form in intraday markets.
Key Insights:
1. TIME as the Guiding Factor:
- The market operates like a clock, where each move happens ON TIME.
- Highs and lows form according to fixed celestial cycles, not random price moves.
2. Price Delivery Algorithm:
- Price follows a delivery system that respects TIME.
- Without understanding TIME, traders become gamblers.
3.Intraday Gann Astro Example:
- With calculations based on ascendant planetary alignments, TIME of specific turning points in intraday markets can be predicted.
- Example from the chart:
- At (2,1), a TIME-driven HIGH forms.
- At (4,-1), a LOW forms based on pre-determined calculations.
4.What Gann Astro Does Differently:
- Combines planetary positions and mathematics to forecast turning points.
- Helps traders trade WITH CONFIDENCE instead of guessing.
- Predict highs/lows hours before they happen.
Now here is the Gann Intraday Trade Example.
And now observe when the price was delivered — it formed a strong reversal precisely at the TIME I calculated, 07:45. TIME IS MORE IMPORTANT THAN PRICE
Why Traders Lose Without TIME Knowledge:
1. Traders rely on price patterns, indicators, and technical setups, ignoring the foundational concept of TIME.
2. TIME is constant and unchangeable, while price can be manipulated.
3. Without mastering TIME, traders are reactive instead of predictive.
Here’s another LIVE trade execution of this week. The trade was precisely calculated 5 hours in advance, demonstrating the power of Gann Intraday Astro Trading.
Below, I’ve outlined the step-by-step analysis of my LIVE trade on GOLD using the Gann Astro principles and advanced mathematical calculations. This is a testament to how TIME, not just price, drives market movements, allowing you to predict turning points with exceptional accuracy.
The chart clearly demonstrates how I calculated the price reversal a solid 4-5 hours in advance using the Gann Intraday Astro technique. The exact time of reversal was determined to be 6:45, purely based on TIME. Watch closely as I executed the trade relying solely on this precise calculation. This is further proof that TIME is the real driver, while PRICE remains an illusion manipulated by the market.
LIVE TRADE ENETRY - TIME IS MORE IMPORTANT THAN PRICE
The real truth lies in TIME, not PRICE—because TIME is fixed, and PRICE is just an illusion manipulated by the market.
NOW let's understand how markets turn on TIME -
.
By applying Gann-inspired mathematical and astro models, I pinpointed key times when market highs and lows are likely to occur. The principle of "TIME = PRICE" suggests that market reversals happen when time and price align. While price can be manipulated, time remains constant, making it a more reliable tool for accurate market forecasting.
GANN INTRADAY TRADING - "The Hidden Truth: Why Gann's TIME Over PRICE Wins in Trading"
In this chart, you can see the market reversing exactly at 21:05, a TIME I calculated in advance using Gann's astro intraday techniques. The method applied here is Squaring the Range—a concept rooted in understanding the range as the time zone where the price remains confined between two major HIGHs and LOWs.
Using advanced mathematical principles in Gann astro analysis, I was able to determine the precise future reversal point. This allows me to approach my trading desk only at the calculated time and execute trades with confidence. This highlights why TIME outweighs PRICE in importance—while prices can be manipulated, TIME remains a constant and reliable indicator for market reversals.
"GANN INTRADAY TRADING - Exposing Market Algorithms: Gann's TIME Secrets Revealed"
In earlier times, markets were primarily influenced by market makers, but now, price delivery is controlled by algorithms designed to enhance liquidity. With the massive influx of participants in today’s market, these algorithms play a critical role in maintaining liquidity flow. Despite these changes, the core principle remains intact: the market still moves based on mass psychology.
Here’s another example showcasing a bullish scenario using Gann techniques.
In this bullish setup, the focus is on identifying key time cycles when the price delivery algorithm aligns with Gann's mathematical principles. By leveraging time-based calculations, I pinpointed the exact moment when the market began expanding upward, indicating a strong bullish movement.
Conclusion:
Understanding and applying time-based principles provide traders with a disciplined, research-driven approach to market analysis. By focusing on time rather than price, one can uncover the natural rhythm of the markets and align their strategies accordingly.
Time is the constant that governs all market movements, as W.D. Gann emphasized: “Time is more important than price.”

Why Is Time More Important Than Price, as Explained by Gann?In the trading world, most market participants focus solely on price while overlooking the critical element that governs market movements: time. Time is fixed, immutable, and unaffected by external manipulation, unlike price, which can be influenced by institutions and market forces. By understanding the concept that "time is fixed, price is an illusion," traders can unlock a method to predict intraday highs and lows with unparalleled precision. This is the essence of the Gann Astro methodology, which reveals the market's natural rhythm and turning points based on time.
The attached graph illustrates a fundamental yet overlooked concept:
Y-Axis → TIME
X-Axis → PRICE
In reality, every high or low in the market is pre-determined by TIME, not price. Gann's Astro methods use planetary positions, ascendants, and advanced mathematical calculations to predict EXACTLY when the next HIGH or LOW will form in intraday markets.
Key Insights:
1. TIME as the Guiding Factor:
- The market operates like a clock, where each move happens ON TIME.
- Highs and lows form according to fixed celestial cycles, not random price moves.
2. Price Delivery Algorithm:
- Price follows a delivery system that respects TIME.
- Without understanding TIME, traders become gamblers.
3. Intraday Gann Astro Example:
- With calculations based on ascendant planetary alignments, TIME of specific turning points in intraday markets can be predicted.
- Example from the chart:
- At (2,1), a TIME-driven HIGH forms.
- At (4,-1), a LOW forms based on pre-determined calculations.
4. What Gann Astro Does Differently:
- Combines planetary positions and mathematics to forecast turning points.
- Helps traders trade WITH CONFIDENCE instead of guessing.
- Predict highs/lows hours before they happen.
Now here is the Gann Intraday Trade Example.
You can clearly see on the chart that the TIME for the price reversal was already calculated using Gann Astro principles and advanced mathematics. I precisely identified the reversal time at 07:45, and you can verify this on the software screen. This highlights the power of time-based analysis, where price movements align perfectly with pre-determined time calculations, offering a clear edge in the market.
And now observe when the price was delivered — it formed a strong reversal precisely at the TIME I calculated, 07:45. Is this just a coincidence? Absolutely not. This is the real way the market algorithm delivers price. TIME IS MORE IMPORTANT THAN PRICE, and this proves the unmatched accuracy of time-based analysis over conventional price-focused methods.
Why Traders Lose Without TIME Knowledge:
1. Traders rely on price patterns, indicators, and technical setups, ignoring the foundational concept of TIME.
2. TIME is constant and unchangeable, while price can be manipulated.
3. Without mastering TIME, traders are reactive instead of predictive.
Here’s another LIVE trade I successfully completed this week. The trade was precisely calculated 5 hours in advance, demonstrating the power of Gann Intraday Astro Trading.
Below, I’ve outlined the step-by-step analysis of my LIVE trade on GOLD using the Gann Astro principles and advanced mathematical calculations. This is a testament to how TIME, not just price, drives market movements, allowing you to predict turning points with exceptional accuracy.
The chart clearly demonstrates how I calculated the price reversal a solid 4-5 hours in advance using the Gann Intraday Astro technique. The exact time of reversal was determined to be 6:45, purely based on TIME. Watch closely as I executed the trade relying solely on this precise calculation. This is further proof that TIME is the real driver, while PRICE remains an illusion manipulated by the market.
LIVE TRADE ENTRY - TIME IS MORE IMPORTANT THAN PRICE
The real truth lies in TIME, not PRICE—because TIME is fixed, and PRICE is just an illusion manipulated by the market.
The power of time-based analysis lies in its ability to expose market manipulation and predict market moves before they happen. Time, unlike price, is the key to decoding the market clock and identifying the exact moments when highs and lows form. With a deeper understanding of this principle, traders can remove guesswork, anticipate market movements, and align themselves with the forces that govern price delivery algorithms. The result is a disciplined, research-backed approach that replaces gambling behavior with a structured trading edge, offering a new perspective on intraday market success.
Most traders fail in the market because they only focus on PRICE. However, according to W.D. Gann's principles, TIME is MORE IMPORTANT THAN PRICE. Big institutions can manipulate price movements, but TIME is a fixed entity that cannot be altered.

GANN TRADING LESSON: TIME IS MORE IMPORTANT THAN PRICE GANN TRADING LESSON: TIME IS MORE IMPORTANT THAN PRICE – W.D. GANN’S METHODOLOGY - The principles of W.D. Gann's trading methodology continue to intrigue and challenge traders worldwide.
At the core of Gann's approach lies the harmonious relationship between price and time, encapsulated in his concept of "squaring."
This principle emphasizes balancing movements in price with corresponding movements in time, thus uncovering the rhythmic and periodic nature of the markets.
Understanding Time Balance in Trading
Gann emphasized the significance of time balance, which involves aligning the duration of a market movement with its magnitude.
This balance is critical because markets, according to Gann, inherently strive to return to a state of harmony, even after experiencing disharmonious phases.
Recognizing these patterns enables traders to anticipate turning points and identify optimal trading opportunities.
The Concept of the Initial Impulse
Gann’s methodology suggests that every market movement begins with an “initial impulse,” which sets the stage for subsequent trends.
This impulse, whether periodic or rhythmic, forms the foundation for future market behavior. Periodic movements repeat after fixed intervals, while rhythmic movements grow proportionally to the initial impulse.
Understanding and marking these impulses on price charts is a vital step in applying Gann’s techniques.
The Series 144 and Squaring Principles
Gann frequently referenced the significance of numerical series, particularly THE 144 SERIES . He argued that price movements often align with values derived from this sequence.
For instance, the duration of an initial impulse may correspond to one value in the series, while subsequent reactions adhere to multiples or subdivisions of this value.
Squaring, a cornerstone of Gann’s theory, involves matching price ranges with equivalent time periods. This can be applied in various forms:
Squaring the price range: Balancing the maximum and minimum price range over a specific time period.
Squaring the minimum price: Equating the duration of a move with its lowest price point.
Squaring the maximum price: Aligning the time elapsed with the highest price point.
Periodic and Rhythmic Movements
According to Gann, markets exhibit both periodic and rhythmic behaviors. Periodic movements repeat after a set number of time units, while rhythmic movements expand or contract in known proportions.
Identifying these characteristics is crucial for marking trends accurately and predicting future price action.
Key Considerations in Applying Gann’s Method
Inharmonious Market Behavior: Gann acknowledged that markets often deviate from ideal structures but emphasized that they ultimately revert to harmony. Recognizing these deviations and their eventual corrections is central to mastering his method.
Critical Points of Strength: Gann’s theory highlights the importance of key levels, such as 50% retracements, as points where price and time converge.
Templates and Extreme Values: Gann’s approach involves overlaying templates based on extreme highs and lows for specific time units (e.g., daily, weekly, monthly) to track market behavior accurately.
The Law of Vibration
Central to Gann’s teachings is the “Law of Vibration,” which posits that all market movements follow universal laws of motion and rhythm.
By studying the past and present, traders can predict future price action with remarkable precision. This principle underpins the repetitive nature of market trends and cycles, reinforcing Gann’s assertion that history repeats itself.
Gann’s Legacy
Gann’s work, often regarded as esoteric, challenges traders to elevate their understanding of market dynamics. His insights into the interplay of time and price continue to inspire new generations of traders to uncover the “Creator’s plan” in financial markets.
While applying his methods requires patience and meticulous study, the rewards are profound for those who master the art of balance and harmony in trading.
Conclusion
By embracing the principles of time balance, the initial impulse, numerical series, and the Law of Vibration, traders can uncover patterns and cycles that enhance their market predictions.
Although Gann’s techniques require dedication and a willingness to delve into intricate concepts, they offer profound insights for those who persevere. His legacy endures as a testament to the potential of blending analytical precision with universal principles, making his methods a timeless guide for mastering market rhythms.
Join the Discussion:
Do you agree with Gann that TIME is the most critical factor in trading? Share your thoughts and experiences below!

GANN TRADING LESSON - GANN BOX & TIME CYCLE 144GANN BOX & TIME CYCLE 144 are two pivotal tools introduced by W.D. Gann , a legendary figure in financial markets. These tools integrate time and price dynamics seamlessly, providing traders with revolutionary methods to analyze market movements.
Here, we’ll explore these tools and how traders can apply them to achieve greater precision and insight in their trading. Understanding the interplay between time and price is a cornerstone of effective trading.
What is Gann’s Box?
Gann’s Box is a synthetic coordinate system that enables traders to analyze price dynamics within structured time and price parameters. The box helps visualize patterns and understand the relationship between upward and downward movements over specific periods.
By using this tool, traders can:
Identify directional trends.
Recognize structural alternations of price movement.
Pinpoint significant turning points in the market.
Principles of the Gann Box
First Principle: Directional Price Movements
The Gann Box segments price movements into discrete directional sections. These sections reveal periods of trend continuation or reversal. By overlaying a box on the chart from a significant extremum, traders can observe how price respects its boundaries over time.
Second Principle: Structure of Movement
Markets alternate between upward and downward movements in a structured and often periodic manner. Gann’s Box allows traders to:
Detect these alternations.
Visualize corrections versus trend-directed movements.
Forecast future structural changes based on historical patterns.
Cycle 144: A Unique Trading Model
Gann’s Cycle 144 is an advanced application of the Gann Box. It involves a fixed time cycle of 144 units (e.g., hours, days, or any chosen timeframe) and is based on the following principles:
Begin at the Extremum: The cycle always starts at a key high or low.
End After 144 Units: The cycle concludes after 144 time units.
No Gaps Between Cycles: Models should seamlessly connect without gaps.
Overlapping Models: Multiple cycles can operate simultaneously, enhancing prediction accuracy within the same timeframe.
This model offers a comprehensive framework to predict market movements within defined intervals.
Practical Steps to Apply Gann’s Box
Identify Key Extremums
Locate significant highs or lows on your chart to serve as the starting points.
Construct the Gann Box
Use the chosen extremum to calculate the parameters of the box. Ensure alignment between price and time scales.
Analyze Trends and Corrections
Observe how price behaves within the box, identifying trend continuations, corrections, and potential reversals.
Incorporate Cycle 144
Overlay the Cycle 144 model to refine predictions, ensuring to account for overlapping cycles for greater precision.
Why Gann’s Box Matters for Traders
Gann’s Box is not just a tool but a framework for disciplined and informed trading. Here are its key benefits:
Accurate Forecasting: Pinpoint turning points with precision.
Structured Analysis: Analyze price action within a logical, visual framework.
Improved Decision-Making: Reduce emotional bias by relying on objective patterns.
Conclusion
Gann’s Box and Cycle 144 offer traders a methodical approach to deciphering market movements. By integrating TIME & PRICE , these tools simplify the complexities of trading while providing actionable insights.
As with any trading method, success lies in practice and observation. Study past market movements, experiment with Gann’s concepts, and refine your understanding. With dedication, these tools can transform your approach to trading and unlock new levels of mastery.

How I Execute Trades Using Gann’s Square of 9Here in this example, I have used the Square of 9 method to predict a potential market reversal and executions. W.D. Gann, a legendary trader and analyst, is renowned for his pioneering techniques in financial markets.
Among his tools, the Square of 9 stands out as a remarkable system to predict market turning points with precision. In this blog, we’ll explore the fundamentals of the Square of 9, how it works, and how we can use it to improve timing and decision-making in the markets.
What is the Square of 9?
The Square of 9 is a spiral-based numerical grid where numbers are arranged in a square, starting from 1 at the center and spiraling outward. Each number on the grid has angular relationships with other numbers, which Gann believed could forecast significant market movements.
For instance:
Numbers at the same angles (e.g., 39, 67, 105, 150) share a relationship that can signify potential turning points in the market.
By marking these numbers and aligning them with trading days, we can identify key dates for potential price reversals.
Core Assumptions in Price Dynamics
Gann’s methods rely on two key assumptions:
Repetition in Price and Time: Price tends to follow specific patterns or laws over defined intervals of time.
Structured Alternation: The up-and-down movements of price are not random; they alternate in a structured, periodic manner.
These assumptions form the foundation for analyzing price action through tools like the Square of 9.
How to Use the Square of 9
Step 1: Identify Key Market Extremes
Begin by locating significant highs or lows on a price chart. These extremums act as the starting point for your calculations.
Step 2: Calculate Calendar Days
Count the number of calendar days between:
Two highs,
Two lows, or
A high and a low.
Step 3: Locate the Number on the Square of 9
Find the calculated number (e.g., 39) on the Square of 9. Then, mark other numbers that lie on the same angle or corner, such as 67, 105, or 150.
Step 4: Predict Turning Points
Mark these numbers as potential future dates. On these dates, observe the market closely for signs of reversals or continuations.
Practical Example
Now let's Analyse GOLD. In this example we will take a daily candle that is making an all time high. From that high we will count the very next extreme high or low. How many trading days it takes to reach that price point and make a reversal? - 40 Trading days.
Now we will look for the number 40 in Gann square of 9 table. and the very next probable execution or reversal we will get after 70 days according to the table.
We see sharp price movement after 70th day and then at 180th day where we can place our order and execute with other confirmations.
Benefits of Using the Square of 9
Enhanced Timing: Pinpoint potential reversal dates, helping traders refine entry and exit strategies.
Objective Forecasting: Use a structured approach to reduce emotional decision-making.
Improved Accuracy: Combine the Square of 9 with other technical tools for more reliable predictions.
Conclusion
The Square of 9 is a powerful tool for traders who seek to integrate time and price analysis into their strategies. By understanding its mechanics and applying its principles, you can anticipate market turns with greater confidence.
As with any trading tool, practice and observation are essential. Study past market movements using the Square of 9 to develop your intuition and skill. With dedication, you’ll unlock the potential of this fascinating method and take your trading to the next level.
