#btcstarburst Accumulate out of the INFLATIONCan you accumulate you way into a Bull Run… Probably YES… If every one is to start buying now. This would suppress the DXY and we would be back in business… However that would be extremely hard and well timed. Instead DCA SAFELY. HERE IS A GANN STUDY chart. Support and resistance.
Gannangles

AUDUSD – LONGBuying opportunity from Major Support Level and Demand Zone . Buy on a false breakout! The target is next POC level in Supply Zone.
AUDUSD – LONG
ENTRY PRICE - 0.67400
SL - 0.66700
TP - 0.69550
Always follow the 6 Golden Rules of Money Management:
1. Protect your gains and never enter into a position without setting a stop loss.
2. Always trade with a Risk-Reward Ratio of 1 to 1.5 or better.
3. Never over-leverage your account.
4. Accept your losses, move on to the next trade and trust the software.
5. Make realistic goals that can be achieved within reason.
6. Always trade with money you can afford to lose.
Please leave your comment and support me with like if you agree with my idea. If you have a different view, please also share with me your idea in the comments.
Have a nice day!

GBPUSD - LONGConsider the formation of North Impulse from Major Resistance Level. Buy on a false breakout! The target is next Supply Zone.
GBPUSD - LONG
ENTRY PRICE - 1.14450
SL - 1.13700
TP - 1.18000
Always follow the 6 Golden Rules of Money Management:
1. Protect your gains and never enter into a position without setting a stop loss.
2. Always trade with a Risk-Reward Ratio of 1 to 1.5 or better.
3. Never over-leverage your account.
4. Accept your losses, move on to the next trade and trust the software.
5. Make realistic goals that can be achieved within reason.
6. Always trade with money you can afford to lose.
Please leave your comment and support me with like if you agree with my idea. If you have a different view, please also share with me your idea in the comments.
Have a nice day!


BTCUSDTThe specified levels are very important
Analysis based on the motion cycle of the roof
The timeline is important
I have reached the end of the downward time cycle of the market. It should be seen how the cycle of the neutral trend will be


🟩BTCUSDT Long SetupBTCUSDT
Risky Scalping
Buy : 19300 - 19600 - 19850
Targets
20200
20500
21000
22500
Stoploss: 19000

🟩 Long BTC ( Don't forget to money management )Share your opinion in the comments and support the idea with Like.
Follow me on tradingView, if you don't want to miss my next analysis or signals.
Thanks for your support!

$DXY End of Month Range ReviewThere appears to be forces at work that are expect (are working on making) $DXY move down to 106.5 levels by months end. Today, 108 to 108.5 is in the window I'm looking through. Simple as that! Keep an eye out though, if we break 108.5, the market's gonna be tanking pretty bad, and there's already divergence between $DXY and assets like $BTC in play this week, and today's no exception!

👻 $DXY $BTC Divergence [What's up with $EURX and $CRO?]Usually when $DXY tanks, $BTC and other investment assets rise, but today is again diverging from the norm (2 or 3 time in the past days). What explains it? Perhaps the fact that $EUR is 🔺 up? A rebalancing of the currency books, perhaps? Or we're setting up for a fake out in during US open. Where are my currency experts at?
The market seems to expect more dovish announcements during the upcoming Jacksonhole FED event; my take based on Chair Powell's speech in June is that we could indeed expect rather a 100bp hike (very hawkish) or at least 75bp, again like last time. The doves are hoping for a 50bp hike. If we get 50bp, does it feel like the market will be ready for a rally?
I stopped out of the majority of my $cro short around .13. Looking to add more back in some more if we dump through the .1285 - .13 range and retrace back to these levels.
I expect 20750 to be an important stopping point for BTC and opportunity for quick long scalp for a few points if the dumpiness continues during the EU trading session, as I would expect the US brinks to put a little long pressure on before it shows it's true intention for the day to either continue the $dxy dump and move into longing other asset prices, or to reverse and really dump the markets at market open.
Summary, SHORT.
My analysis still isn't solid and clear; but i'm hoping you're following along and interested anyway. Comments, suggestions, questions welcome! GL out there!

X or ex?may be we are in last leg of this rally, so for tomorrow considering gap up scenario this is what I'm expecting, overall short is not advisable. and expecting market to top out on Friday or Monday.
Im not an SEBI registered advisor, so risk v apna apna aur ishq v apna apna, happy trading

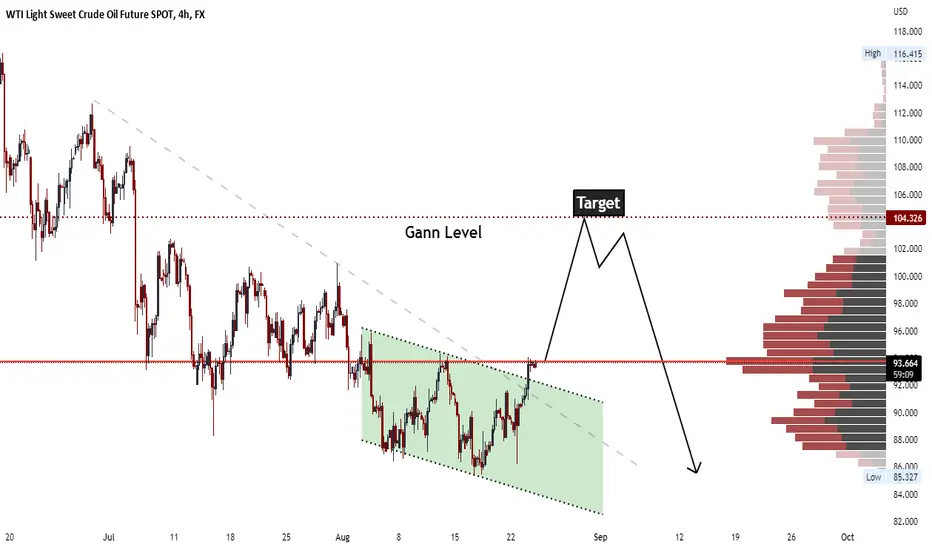
" USOIL " Buy Trade ( With 1000 Pips Target )Good Morning Trader's ,, How Are You Today ?
Let's Explain Together "USOIL" Chart And Reasons To BUY From This Area !
1- What Is The Trend For USOIL ? Now ,, It's In Down Trend ,, We Have Break Out Trend Line And Channel And Wait To Break Out Resistance Area To Enter Buy
2- Why We Will BUY From This Area ? Trend Line Break Out - Channel Break Out - Gann Direction
3- When We Close The Target As Stop Lose ? When USOIL Close Down 90.00 With Daily Candle
Any Questions Please Write me On Comments !
🔴 BTC Sell SetupBTCUSDT
a bearish pattern in 4H timeframe . dropping will be very possible!
Share your opinion in the comments and support the idea with Like.
Follow me on tradingView, if you don't want to miss my next analysis or signals.
Thanks for your support!


🟩GMTUSDT BUY SPOT☑️GMTUSDT
🟩Buy spot at 1
✅Target
1.30
1.75
Share your opinion in the comments and support the idea with Like.
Follow me on tradingView, if you don't want to miss my next analysis or signals.
Thanks for your support!

⛔️ ADA Short Setup ADA is going down be carful with long
▶️ADAUSDT
Sell
⭕️0.5350
Target
🎯0.518
🎯0.505
🎯0.49
🎯0.475
SL
🛑 0.56
Share your opinion in the comments and support the idea with Like.
Follow me on tradingView, if you don't want to miss my next analysis or signals.
Thanks for your support!

Ethereum Resistance at 1x1 Gann July 2022Please read the previous post caption which better explains this post. Sharing an extra confluence with all the bearish elements from the 20-25th starting tomorrow.
Price is meeting resistance at the 1x1 important line.

W.D Gann's 1929 stock market prediction compared to the BTCI have noticed that William Delbert Gann's stock market prediction of 1929 could be very similar to Bitcoin's current price movement and decided to make a comparison. The result was shocking! Gann managed to predict the crash of 1929, also called as "Great Crash" years in advance.


BTC from Zero To Zero so the whole idea started from the question is it going back to Zero ?
using the Gann fixed squre . the chart was squared from the zero to the top . and then from the top to the zero again .
and two gan box ( star ) and support fan was used . to show possible support prices .
so the only possible long position would be 11932
or . if it holds above 22932 by end of August

BTCUSD: Preparing Positional Long EntrySince our last post, the BTCUSD market went through a corrective phase that brought the price to the mid20k level, the lowest price since the onset of the price discovery phase when the prior ATH was left behind with a bang. It is an exceptionally well-behaved market despite the turmoil that many other DeFi projects incl. stable coins have been going through. It seems reasonable to be looking for opportunities to add to long exposure in this market as the risk/reward is becoming more attractive.
Key events/levels to look for clues:
25k bottom retest;
25k bottom retest +break = 7.5k extension lower;
17.5k - 22.5k as a major bottom.
INDEX:BTCUSD is at a very pivotal moment and opportunities always come with risk, do manage the risk accordingly.
Staying tuned for further tells.
