CLN2020: Gap RetestThe July delivery contract is seemingly in a decent spot for buyers. Having retested the bullish structural gap area, oil is now trading at a price where many players are waiting for it choose the direction, which will ultimately accelerate the consequent move as players book profits/losses. This can be interpreted as having greater control of risk, as a $1.5K risk is enough to "know" whether one is wrong being bullish here.
Gannangles


Mastercard lets fill this GAP!Mastercard intraday chart, not looking for much movement just thought the pattern looked cool. Can see three clear descending paths along the Gann fan (including my fractal) Lets see how this plays out :)


BTCUSD: Potential Limit Buy AreasThis chart is squared to the $3900 low with a $5 per 20min price to time ratio. It projects a 150% increase from $3900 low within the following 30 days. Buying the dips and piling long exposure seems reasonable.

CLM0 3 Day Chart: Long-term Buy Oil opened the week with a massive gap of more than 30%; a clear selling climax move. At this point, most of the selling was absorbed by institutionals and I do not see the selling continuing for much lower. Oil has already regained 20% since the low was printed early in the morning hours. A great opportunity for long-term buy entries. Mind the risk though - have at least a $6k risk buffer per contract here. Depending on the exclusion of the "lower for longer" approach here by the oil giants, we could see a mean-reversion to the $50 area rather quickly - by H2 2020. Around $50, a decent profit of under $20k per contract expected.

EURUSD, 11 MARCH I EXPECT A TURN IN THE MARKET!!Hello guys.
This is my idea about the EURUSD market.
I expect a turn in the EURUSD market !! 11 MARCH!
Why i think that?
1. We have a gap that needs to be filled
2. I did research about cycles and i have a lot of the same confirmations that we expect a turn but for now it is waiting. if it does a retest before the timing and the gap is be filled then a expect a buy otherwise it will be a sell.
REMEMBER: 11 MARCH TURN IN THE EURUSD MARKET ON DAILY CHART.
I hope i can help some people with sharing my idea about this market.

Daily CLQ0: A Potential Positional LongThe fear is out and folks are running for an exit; the reduction of short risk exposure in progress. Best time to look for long entries. However, watch for the transitioning of lower timeframes into bullish or sideways formations for potential long-term buy entries with reduced risk. A 1R return of $2K per contract is the minimum expected return here with a potential for 5R before this contract expiry.

USOIL: Buy Signal Oil price is seemingly getting bid at the important 315º @ 5770. Long entries from here with potential targets of 5890, a 45º movement and 6010, a 90º movement. The context to the left dictates a short, but we are going against the tide here to capture a decent return on minimal risk of 30 ticks.

ZENBTC forming a perfect Cup & Handle Longing it from 8866-8867, STOP-LOSS 1D candle close below 8866


Are you ready to buy the dip one more time? HBARBTCI'll buy it at 204 sats, STOP-LOSS 1D candle close below it.

Did you see Gann Grid before? Take a look! BTCUSDTJust showing off the Gann Grid and how it almost expected every low & high on the chart!
Enjoy the masterpiece!

CLJ0 Daily AnalysisThis analysis of CLJ2020 , the contract for April 2020 delivery, is an attempt at forecasting oil price into Q3 2020. A potential supply area around 6275-6325 via an increasing urge to lock in profits/reduce short risk exposure . Also, the risk of downside for longs is ever more noticeable as oil approaches the 3-sigma area where odds of mean reversion greatly increase. Looking for selling into strength opportunities in the lower timeframes is reasonable it seems.

Bitcoin forming an Adam & Eve? Is a rally about to begin?Let's give it a shot.
When the candle of the specified date opens, I'm going to put my limit order at 6588.
if it reached the price long before that date, that's bearish and I'm not going to open such trade.
I'll update the idea when I put the order or cancel the trade.

CLFO: Potentially Ready For A CorrectionSeemingly oil has completed a five-wave sequence. The structure seems odd, but overall this scenario seems to have some weight given the closing of the week where bulls decided to take profit. I expect that next week starts off red before another bullish leg. It makes sense to look for fading setups in the lower timeframes.

BTC - XBT/USD 12hrBased on some Gann learnings, I am working on testing a system that can be applied to any chart. Interested in hearing from others with Gann or similar knowledge and experience.

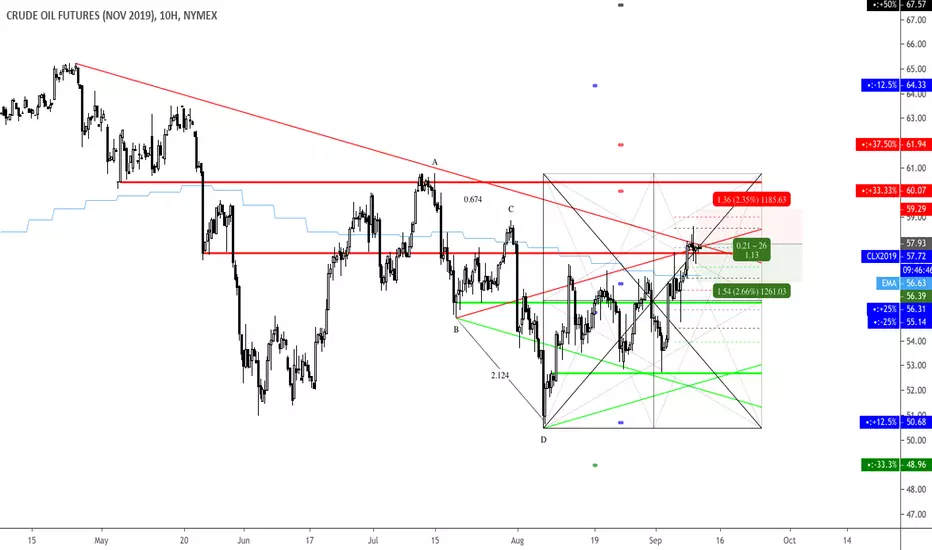
CLX9 Fading Short SetupSeemingly oil has run into the supply area via profit booking. The traders are reducing short risk exposure and are likely to enter for continuation on a pullback. The fading short setup looks valid at this point. However, in the context of the recent price action, the probability of this trade is not the best that we could have.


BTC ULTRA RALLY? ALL OR NOTHING...Rule for 1D chart with 45degree angles:
price/bar ratio should be 24 (1point per hour)
or some other 1(price unit) x 1(time unit) ratio you like.
(without a 1x1 price ratio it will not work well)
That said.
THE FANs:
the downtrend one shows how to read it.
The far from the 45degree, the FAST it moves.
The closer it gets to the 45degree, the velocity get slower (because it is changing the FORCE from bearish to bullish)
(you can see the close it gets to the downtrend 45degree diagonal, the slower the fall the faster the propulsion up gets)
(also you can see the propulsion up gets stronger when the price breaks the 50% of the fan - the red thin lines are the 25%, 50%, 75% inside the fans, great support/resistance levels)
SO
since ~7.4k the price is UPSIDE the uptrend 45degree.
SO
IF price hit the yellow and red uptrend FAN area it will MOVE UP AS FAST as it WENT DOWN in the same area in the previous downtrend, but UP.
SO?
IF the price his the 0.666 level (at 13247) BEFORE july it will BRING A HUGE FAST MOMENTUM UNTIL 20K near middle September.
COOL!
BUT if the price fail that it MAY do 2 things:
-weak bullish IF it keeps ABOVE the 45degree UPTREND diagonal.
-STRONG BEARISH IF it BREAKS DOWN the 45degree UPTREND diagonal.
ALL GONNA BE DECIDED THIS WEEK, FOLKS!
SO it is time to prepare the LONG and SHORT strategies.
LET THE PRICE TALK!
