Odds Are Oil Goes HigherThis is a daily point&figure chart rounded to a 100 tick movement. Looks like oil wants to test the previous highs and possibly higher into low $80s.
Gannangles


GANN Box BitStamp This is an alternate gann box chart using bitstamp and with different axis points.
We have crossed the turquoise midpoint which is an area of heavy resistance where the trend could change. Watch as the angles act as support and resistance to price. Breaks of a line mean something!
Using the law of vibration 192 day time cycle starting the day after the ATH .
Blue vertical lines 192 day cycles
Red 48 day pivot points (resistance to the trend)
Turquoise 96 day midpoint (Major resistance in time to the trend in force)

New idea about gann line aka gann boxThe original gann line is exactly line with box. Or that box is with line.
45°line is very famous but many people don't know how to use it.
It's always 1° per day.
Ahhh but in gann box. That's a transpert plastic paper which like a rule to measure something.
Today I have a interesting idea. Maybe It can be adjusted!!!
To adjust it. You must know the cycle. e.g original is 90d or 144d. IDK other parameters.
So what if we use it on 4day cycle? or 8day?
I'm not sure how to use it.
#It's just a idea. It have nothing to do with chart above.
My basic idea is if you found a subcycle. Multiply it to bigger cycle. Use box to include a full bigger cycle.
I think box high should be high of cycle. (If you use it this way maybe you should wait highest price come. Well you must have some cycle basic or it's all not work for you)
I think this way is worth to study because gann said the 45degree line is a true Moving average line.
Maybe we can use it to judge whether the trend is strong or weak.
#This idea maybe looks dumb but if it can be a valid confirm tool it's still very valuable.

CLM2019 Potential Fade CLM9 and oil in general has gone up almost 50% since bottoming after the severe selloff. The upcoming weeks upside should be approached with caution as there is an increased risk of exposure reduction from buyers, which is expected to manifest itself in a potential pullback of 200+ ticks.
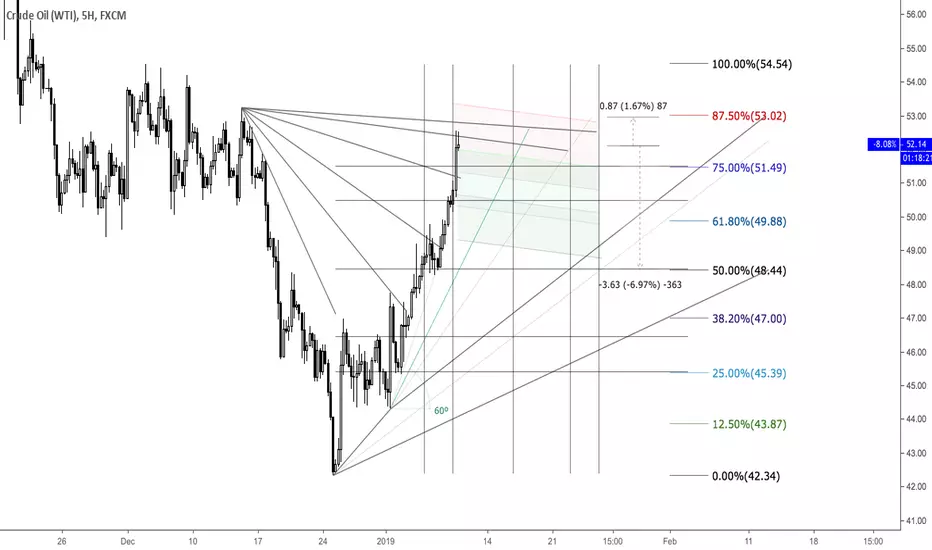
USOIL 1H PerspectiveUSOIL showed a strong close last week and is seemingly looking for another positive close during the upcoming week. There are potential limit buy areas highlighted in the chart. The first area of interest being the weekly HLC3 @ 5773, the level from which the price bounced during the late Friday trading hours. Market participants seem to be waiting for a pullback to add on to their short risk exposure. Apparently, bears must first close and swap the bullish gap for bulls to panic and start vacating their holdings. A further push down of the market is likely to take place if bulls fail the gap area. As long as, the gap holds, short risk exposure will be the preferred alternative.

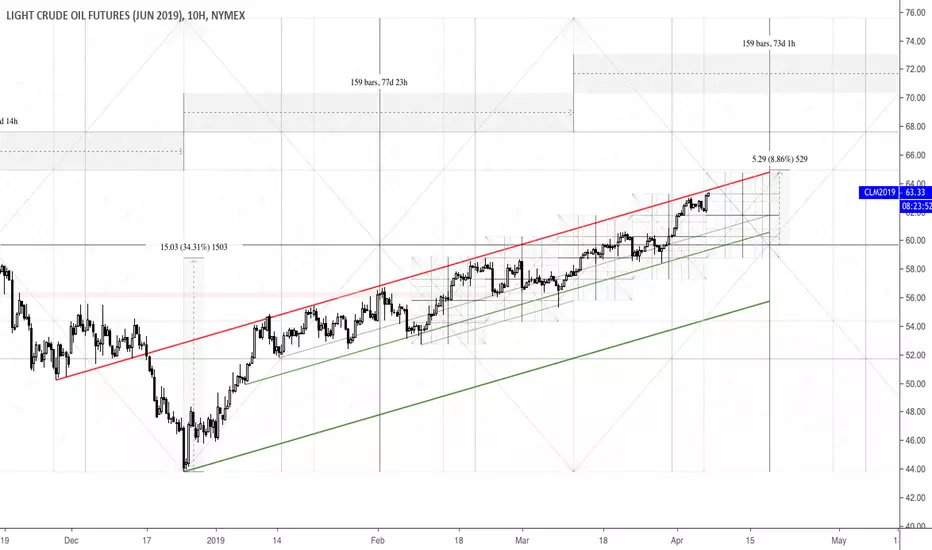
CLJ2019's Anticipated Range This is a 10H chart of CLJ2019, which will be trading until it expires the 20th of March. The Gann Box tool is squared to the high & low range of this contract; from the 7601 peak to the 4300 bottom. There are also the 45º and 15º angle lines coming from various highs and/or lows. As shown in the chart, the oil price is currently approaching the 150 day EMA, it has increased from the 4300 low by a third and the 1/3rd area coincides with 150 day EMA.., and all this is happening after it saw a record breaking plunge of ≈45% from its 7601 peak. Traders who held short risk exposure through that 33%+ rise from the low are likely to take profits at these levels. The reducing of short risk exposure is anticipated to manifest itself in a minor pullback of 200+ ticks at least. Shorting the pops seems to be the reasonable approach from here. The risk factor for short entries is $1.3K (130 ticks) per contract with a potential of 2R return for risk.

Fading Short Follow UpThere was another wash of sellers after finding support at the previous day's hlc3 value. Sellers are still unable to close the entire 1H bar below 20EMA. On the other hand, the big bull breakout bars might turn into a climax buying if bulls fail to follow through here. Waiting for the US session to show the lead.

A Fading Short 1H OIL USOIL bulls are having a good run so far. It seems the oil market is ready to reduce short risk as players start taking profits. Looking for a scalp lower seems reasonable.

VERITONE: is starting a new rally.Important set up daily feb 13, 2018 at price $5.80.
Above this level stong buy, 1st target $8, 2nd 10.8$.

USOIL 1H Potential Limit Buy Setup USOIL has been going through hard times after being rejected at the gap area mentioned in earlier posts. It has now approached an area of buyers' interest it seems. The $50 mark failing to support the price can be interpreted as a longterm 38.20% pullback continuation sell setup. For now, the 5125 area is of interest, if that goes, the 5050 area.

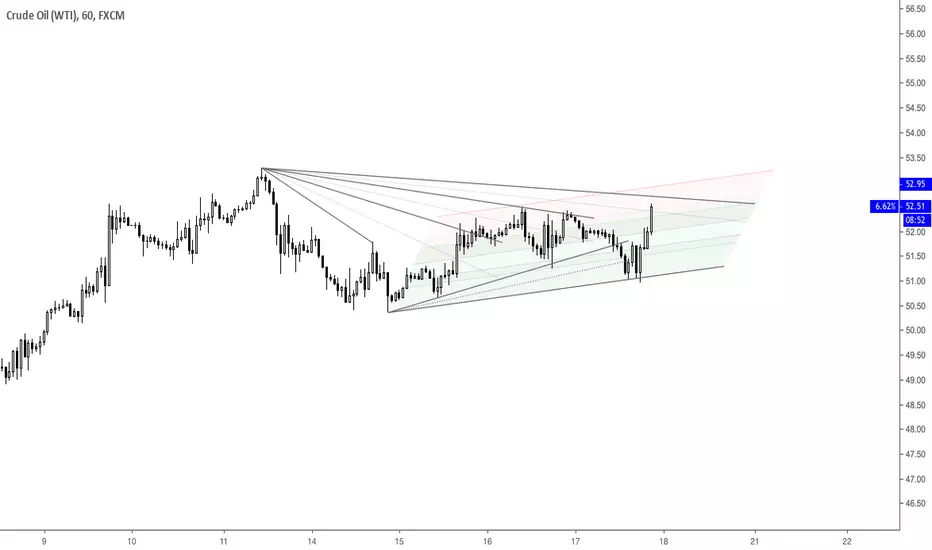
USOIL Potential Support AreasUSOIL got rejected around the old gap area of 5480-5520 that is highlighted on the chart. This resistance area is a significant one, overcoming it will open the way towards higher targets for bulls. It will also validate the inverse head and shoulders pattern noticeable on higher timeframes. Bears were quite aggressive in pressing down the price and managed to swap the first gap highlighted in green. However, there is the second gap around the 5345 area that bears need to swap for further downside. An immediate target of 5295 would open up in that case, the 5295 being next bull angle area shown on the chart. Looking at higher timeframes, such as the 5H, the price is currently painting a spring bar with a decent shadow near the 5345 gap area, which can be interpreted as bullish as long as that level stays intact. This area here is quite important for clues of further direction, the 5345 & 5295 areas being the key price levels that bulls need to guard for further upside.

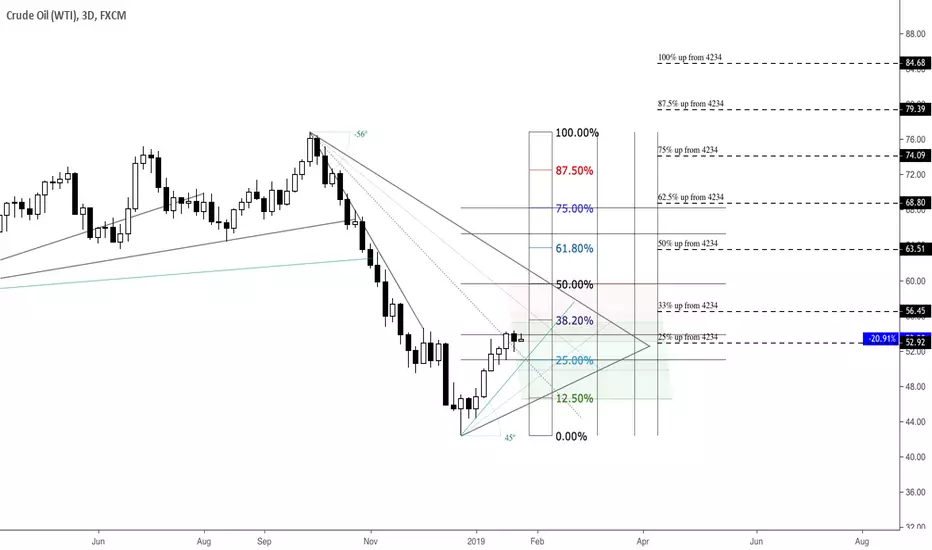
USOIL Potential Support & Resistance AreasThis 3 day charts shows basic retracement levels, percentage increase levels from the current low and angle relationship based support & resistance areas. So far, the oil market saw a sharp surge from the low $42, a longterm demand area, and currently it seems there's still some room for further upside. This move up can be regarded as a retracement leg within a bigger downtrend, the common retracement level being 38.20%, which falls around the $55 mark. However, there is an inverse head and shoulders pattern also noticeable on higher timeframes, so buyers might push for the 61.80% after taking some profits. Buying into weakness seems reasonable for now.
Another Oil Fade SetupApparently another fading short opportunity here. Pending price action confirmation and invalidated if price proves itself bullish beyond the angle line . Level of interest ≈ 5265, a 70 tick stop and 1R-3R targets.
USOIL Potential Short Setup Seemingly there is another fading short setup coming up. The chart is self-explanatory, the levels are given and for now the only thing left to do is wait until the major bear angle is reached and look for an entry with a price action confirmation.

Fading Short Setup A potential fading short setup coming up it seems. There is a $850 risk per contract and a 3:1 reward for risk. The levels are given on the chart.
Wti crude oil long term opportunity (Monthly)After the big crash of the us oil price now we have a great buy long term opportunity. The price has reacted after touching the 4/1 Gann level and now i will expected an up trend for the next week-month.
Similar situation on the weekly Gann analysis
This point could be the historical bottom for the wti market.

Longterm ES ChartThis is a monthly chart that shows important relationships in terms of price and time. As we can see, through the 2008 crisis the market plunged almost 60% and saw around 350% increase thereafter, painting an all-time high in September 2018. Currently, the 10-year-cycle is seemingly done and another big selloff in the equity market appears to be zooming. The 25%, 33.33% and 50% areas from the all-time high are potential targets and reversal zones. Selling into strength seems reasonable here.

Bitcoin daily analysisBitcoin price has found a support level on 8/1 Gann Fan.
I think it will probably made a new up phase until 4050 $.

The Current Oil Square USOIL working the 1/3-1/2 square both price and time wise from the recent high. You can see the dashed horizontal support and resistance lines based on the aforementioned square range of 1/3 to 1/2. If bulls manage to turn this around, the first thing they will have to do is break beyond the descending 45 degree line of that highlighted 1/3-1/2 square.

SPX Daily analysis Today opening will be relevant to understand which will the market reaction.
In this moment my primary idea is: market want to continue his down phase. In this case i think we could see a small bounce near to 2450-2440.
If the market had to arrive on this level we probably see a bounce.
In case of this idea will be confermed, I will update the analysis as soon as possible.

SPX critical situation As you can see on the image the market now is testing the 1/2 Gann Fan. If the price had to broke this level the situation will become critical.
The 2540 level is important because if the price will go down the main trend for this market change from bull to bear.
In this case first target can be 2350 and i think i will go short. If the market reject this idea i will update my analysis trying to find new buy&sell points.
Next targets will update in future.

Possible Pullback Range USOIL looks like it wants to pull a minor trend change here. Perhaps turn into a $50-$58 trading range for a month or two. The chart is pretty self-explanatory. Looking forward to see how this plays out.
