AUDJPYIf you liked the idea, the analysis please click on like and follow up, and you will receive everything new and exclusive
The analysis used William Delbert Gann
And astronomical analysis
And my own method that I have adopted in analyzing the price movement is very special
Gann Box

NZDJPYIf you liked the idea, the analysis please click on like and follow up, and you will receive everything new and exclusive
The analysis used William Delbert Gann
And astronomical analysis
And my own method that I have adopted in analyzing the price movement is very special

XAUUSDIf you liked the idea, the analysis please click on like and follow up, and you will receive everything new and exclusive
The analysis used William Delbert Gann
And astronomical analysis
And my own method that I have adopted in analyzing the price movement is very special

CADCHFIf you liked the idea, the analysis please click on like and follow up, and you will receive everything new and exclusive
The analysis used William Delbert Gann
And astronomical analysis
And my own method that I have adopted in analyzing the price movement is very special

GBPCADIf you liked the idea, the analysis please click on like and follow up, and you will receive everything new and exclusive
The analysis used William Delbert Gann
And astronomical analysis
And my own method that I have adopted in analyzing the price movement is very special

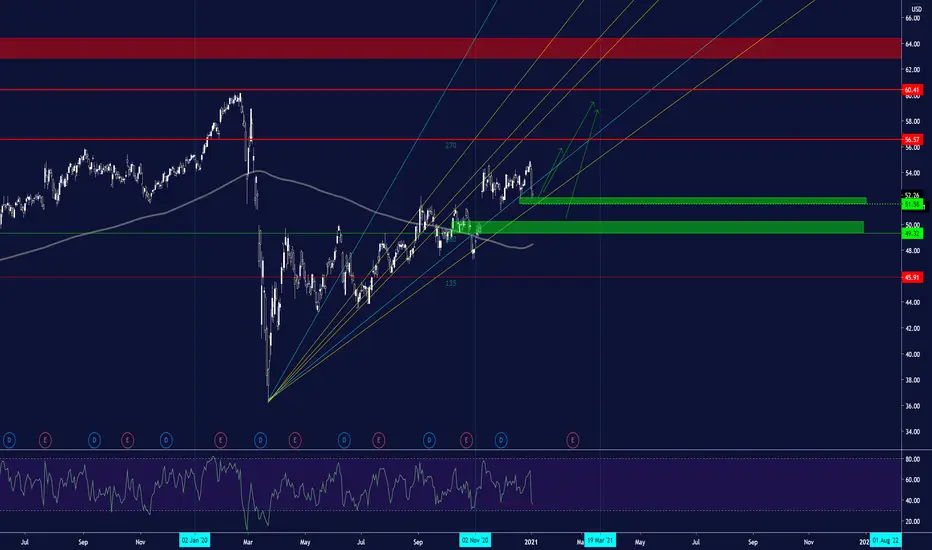
is it the perfect time for coca cola KOthis is the first time i will analyse this stock
as we can see two green areas to buy and targets are marked
for the time 19 MAR
as we notice that there is a diverge so hope to complete the double bottom
is it enough for tesla as we can see that our last two analysis for Tesla were perfect for time and prediction
because of that i got more courage to continue with it
for now it is on a big resistance so i think it will make a small correction till the green area then continue with flying till the up next two red areas
but if it breaks the resistance without making correction i will buy it stop limit
for times there is an important time in 16 march
so lets see what will happen and i hope you a perfect night


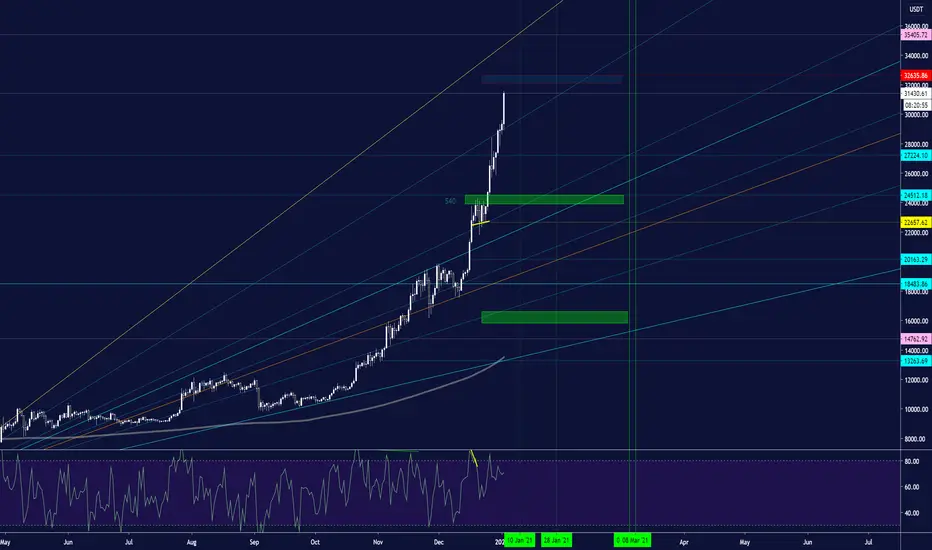
TIME FOR REST BTCLet’s wait for btc
And let’s wait for correction from the red area
It’s a cluster combination of 1.618 extended fibo and 135 angle
The buy areas determined in green color and they are a combination of fibo 0.618
And angles of gann
About the important times are determined in green color
I hope you a nice night
Reliance Uptrend will soon Jan 11th trend will change
Catch the falling equity .
Range ------
Ultimate target 2350
2050 upside
1850 downside

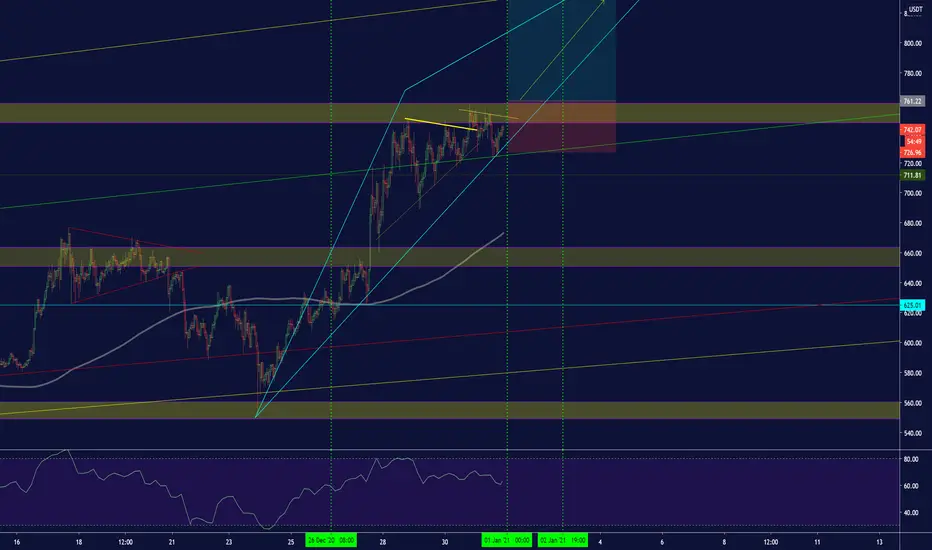
THE MOST IMPORTANT OSCILLATING TRENDS forms in triangle FOR ETHlets see what will happen
if it breaks 760 it will hit the marked goal on the chart
important times "

Happy Holidays and Merry Christmas!The year 2020 was a year full of problems which we tried to face in the best possible way. I wish you from the bottom of my heart a happy new year 2021 and may this year be a full year of miracles for you and your families. A good year for trading.
Happy New Year 2021 from ME !!!
ALBANIA: Vitit 2020 ishte nje vit plot probleme te cilat ne munduam ti perballonim ne menyren me te mire te mundshme ju uroj thelle nga zemra gezuar vitin e ri 2021 dhe qofte ky vit nje vit plote mrekulli per ju dhe familjet tuaj. Nje vit i mbare per tregtim.
Gezuar Vitin e Ri 2021 nga MUA !!!
ITALIAN: Il 2020 è stato un anno pieno di problemi che abbiamo cercato di affrontare nel miglior modo possibile. Ti auguro dal profondo del cuore un felice anno nuovo 2021 e che quest'anno sia un anno pieno di miracoli per te e le tue famiglie. Un buon anno per il trading.
Felice Anno Nuovo 2021
DUTCH: Het jaar 2020 was een jaar vol problemen die we op de best mogelijke manier probeerden het hoofd te bieden.Ik wens je uit de grond van mijn hart een gelukkig nieuwjaar 2021 en moge dit jaar een vol jaar van wonderen zijn voor jou en je gezinnen. Een goed handelsjaar.
Gelukkig nieuwjaar 2021


GBPUSDIf we examine the chart carefully, you will see how well the support and resistance levels work.


xauusd time to turn back to my favorite metal lol i will buy after 31 Dec what ever the price is
have a nice holiday

Retroceso de Fibonacci / Extensión de FibonacciSe valida retroceso del GBPUSD a 4H encontrando que sobrepasa el 88 del Fibo.
Se usa Gann Box para calcular entrada snipper en el middle.
También se usa extensión del fibonacci para calcular TP.

BTCUSD: Potential Continuation SetupThe correctional formation target that was mentioned in the related idea has been met; the highlighted area is now acting as support. It looks like higher timeframes failed to close below this key area; nonetheless, this pair might probe that area as a failure test. In such an event, it is expected that the lower timeframes will turn by printing spring bars. So far, bears are having problems following through and adding on to short risk exposure seems justified. The risk profile is not that bad.., if structure remains intact, this limit buy area can potentially deliver a 20% return, coupled with the selected risk profile, it would mean delivering around 6R return.
