Eth Weekly Log Gann layoutGann set on weekly, 2018 bottom to 2019 top. Log scale. Interesting levels to watch as always. Will also post linear scale
Gann Box

BTCUSD 1H GANN BOXAdded trend lines. Unless it breaks the below trend I am still bullish short term but we are trending below the middle line. If long I would SL below the trend line.
144 is usually a reversal angle.

Learning From 5 Markets Cycles & The Crashes That Ended ThemTo put into perspective what could happen in the current market climate is always helpful to study historical market behavior.
For this analysis, I am using Gann Boxes a great drawing tool from TradingView.
Although each market cycle is different in duration, boom and bust, they share common characteristics.
The ability to be unpredictable, erratic and wipe out wealth.
Another trait they all share is the ushering in of a new era of wealth building.
Only the new era that we face may be built on deflation, significantly weakened currencies and potentially a new world order. Additionally, in the west, the distribution of wealth is very seriously skewed toward the super-rich. Things will need to change.
Anatomy of wealth creation and destruction.
• The 60s and 70s ended with an 80% loss of gains accumulated.
• The 80s ended with Black Monday which wipes out 38% of gains (relatively mild)
• The Dotcom Bust wiped out 60% of gains
• The Financial Crisis wiped out 100% + of gains
So far, the Corona Crash has been relatively mild, thanks to massive government intervention, with currently 25% of gains lost.
The question you must ask yourself is:
Is this the end of the crash? Is the retracement of the market commensurate with the actual economic activity & jobs market collapse?
Just be clear all options are on the table, including a retracement to Zero, for the S&P this is close to 700 points.
No one knows the future and we humans are notoriously bad at predictions.
What do you think?


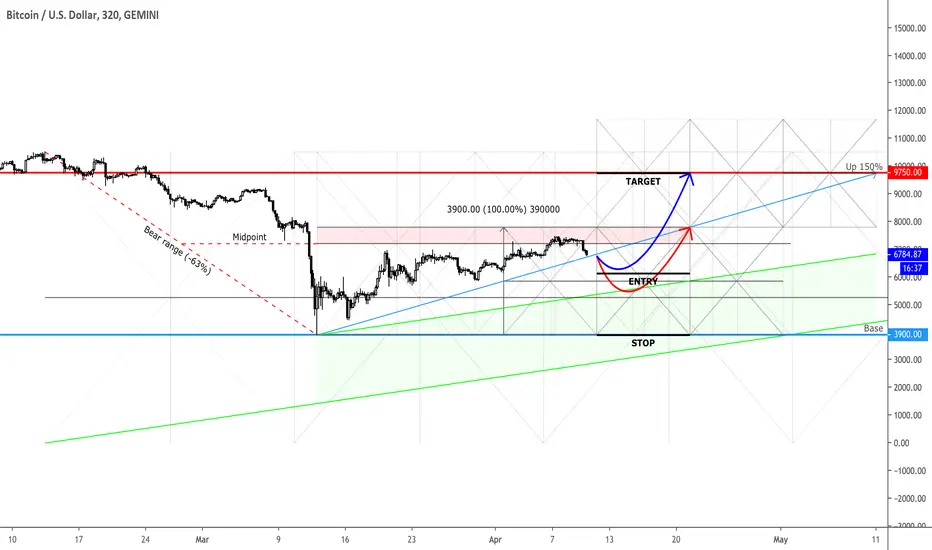
BTCUSD: Limit Buy SetupBTCUSD is seemingly being well-offered around the the 50% reaction point on the earlier 60% bear move, potentially providing a good opportunity to buy the pullback within the bullish leg that almost did a 100% move higher from the $3.9k low. The highlighted areas serve as a visual representation of how supply&demand zones are expected to shift through the passing of time. As long as the lower green shaded areas, remains intact, BTC doom can be avoided. Below that area, BTC is in a bearish territory.

CORN FUTURES (ZC1!) DailyDates in the future with the greatest probability for a price high or price low.
The Djinn Predictive Indicators are simple mathematical equations. Once an equation is given to Siri the algorithm provides the future price swing date. Djinn Indicators work on all charts, for any asset category and in all time frames. Occasionally a Djinn Predictive Indicator will miss its prediction date by one candlestick. If multiple Djinn prediction dates are missed and are plowed through by same color Henikin Ashi candles the asset is being "reset". The "reset" is complete when Henikin Ashi candles are back in sync with Djinn price high or low prediction dates.
One way the Djinn Indicator is used to enter and exit trades:
For best results trade in the direction of the trend.
The Linear Regression channel is used to determine trend direction. The Linear Regression is set at 2 -2 30.
When a green Henikin Ashi candle intersects with the linear regression upper deviation line (green line) and both indicators intersect with a Djinn prediction date a sell is triggered.
When a red Henikin Ashi candle intersects with the linear regression lower deviation line (red line) and both indicators intersect with a Djinn prediction date a buy is triggered.
This trading strategy works on daily, weekly and Monthly Djinn Predictive charts.
This is not trading advice. Trade at your own risk.


BTCUSD: Potential Limit Buy AreasThis chart is squared to the $3900 low with a $5 per 20min price to time ratio. It projects a 150% increase from $3900 low within the following 30 days. Buying the dips and piling long exposure seems reasonable.


PLATINUM FUTURES (PL1!) DailyDates in the future with the greatest probability for a price high or price low

XRPUSD: Giza is hereJust kidding, Gann advanced Box using 1/7 fractions
Up until forming a double top on April 11th? early breakout of pink line indicates this, but we shall put all charts together
Geometry trading always has some amount of uncertainty like other methods of Technical Analysis (80%? how they calculate this anyway?)
But i think the level of uncertainty is too high by now, and it will remains too high
Lots of people who never used crypto were entered market due to falling Bitcoin price below 5k$.
Does market has special plan to leave this people and pro traders behind before a huuge bull run? we must just sit and wait (or draw more charts)
More... more... more...

U.S. DOLLAR CURRENCY INDEX (DAX) DailyDates in the future with the greatest probability for a price high or price low

U.S. DOLLAR / NORWEGIAN KRONE (USDNOK) WeeklyDates in the future with the greatest probability for a price high or price low


BTC RHYMES. No Timelines. Fundamentals.I know there's alot to unpack there folks; so I'll implore you to stare at it for a good 15 minutes -- a quick glance won't do you any service as it took me some time & a lot of memory jogging to retrace (pun intended) what I could remember from Q1-Q2 2017: so let's get to it!:
As you can see Elliot Waves cycles are nearly identical with purple == elliot waves almost identically in conjunction with % from gain retracements we've seen give or take a few missed targets or added --these can be attributed strictly to anomalies like COVID19 and shit like that can't be predicted yet at the end of the day the fundamentals will ALWAYS play out as intended, so when you have a major pandemic causing panic on Wall St, you're not creating a BTC bull run...you're simply expediting one that's already in effect.
Don't believe me? I'll attach a link to BTC hashrates & recent mining pools; level of computation power is astounding & not just for being at an all time high but for essentially going from 0 to 60 faster than a Lamborghini (see what I did there?) as we are >80 days from the BTC halving, it is visibly apparent that we are in for one hell of a ride.
What we need to pay attention to are: Green dashed line is next TP: something we should see within the next 1-7 days. Now here's where it gets tricky. The yellow dashed line 1 & yellow dashed 2 are those quintessential pain-in-the-ass key resistance points we need to cross before we can officially declare this bullrun.
Now with all the variables in play, I'm convinced this is going to happen sometime in (gotcha! I told you. no timeframes!)
FUNDAMENTALS
I can't tell you when it will happen! I can only tell you it will!) though keep in mind once we cross that YD2 @ 9200 then we are officially set for launch.
The rest of the green horizontals are TP's we'll experience during that run, when it occurs.
Enjoy your Wednesday. Stay safe, clean, lets kill this virus already so we can get on with it.
Peace & Love
-@a1mtarabichi
Disclaimer
Note: This is strictly conjecture based on my own technical analysis and not any information based on any sources from the GOP Or federal government/treasury dept / ay institution of any form this example is for educational purposes only and should not be relied upon for any other use. Please invest responsibly and make all decisions based on your head; not your gut. Any projections or figures provided in this analysis are Forward-looking statements And have no basis Other than my own opinion and not information related to the GOP, SEC or wall sf in general. Just the wiz doing what he always did best — Disclaimer must be extended and extensive So forgive me as I need to truly emphasize None of the information obtained in conducting this analysis was provided by insider trading in anyway shape or form.
Certain information set forth in this presentation contains “forward-looking information”, including “future oriented financial information” and “financial outlook”, under applicable securities laws (collectively referred to herein as forward-looking statements). Except for statements of historical fact, information contained herein constitutes forward-looking statements and includes, but is not limited to, the (i) projected financial performance of the Company; (ii) completion of, and the use of proceeds from, the sale of the shares being offered hereunder; ( iii ) the expected development of the Company’s business, projects and joint ventures; (iv) execution of the Company’s vision and growth strategy, including with respect to future M&A activity and global growth; (v) sources and availability of third-party financing for the Company’s projects; ( vi ) completion of the Company’s projects that are currently underway, in development or otherwise under consideration; ( vi ) renewal of the Company’s current customer, supplier and other material agreements; and ( vii ) future liquidity, working capital, and capital requirements. Forward-looking statements are provided to allow potential investors the opportunity to understand management’s beliefs and opinions in respect of the future so that they may use such beliefs and opinions as one factor in evaluating an investment.
These statements are not guarantees of future performance and undue reliance should not be placed on them. Such forward-looking statements necessarily involve known and unknown risks and uncertainties, which may cause actual performance and financial results in future periods to differ materially from any projections of future performance or result expressed or implied by such forward-looking statements.

BTCUSD: Bullish Reversal MapThe above chart projects a 200% increase from the recent $3.85k low by EOM. The pattern is invalidated if BTCUSD dips below $5.2k and closes daily timeframe below it.

CLM0 3 Day Chart: Long-term Buy Oil opened the week with a massive gap of more than 30%; a clear selling climax move. At this point, most of the selling was absorbed by institutionals and I do not see the selling continuing for much lower. Oil has already regained 20% since the low was printed early in the morning hours. A great opportunity for long-term buy entries. Mind the risk though - have at least a $6k risk buffer per contract here. Depending on the exclusion of the "lower for longer" approach here by the oil giants, we could see a mean-reversion to the $50 area rather quickly - by H2 2020. Around $50, a decent profit of under $20k per contract expected.

AUDCAD - D1 If price can get close over 0.88038 in Daily time frame you can get a Long position to target: 0.888


BASIC ATTENTION TOKEN DailyDates in the future with the highest probability for price direction reversals

EURO / SWISS FRANC (EURCHF) WeeklyDates in the future with the highest probability for price direction reversals
