Gann Box


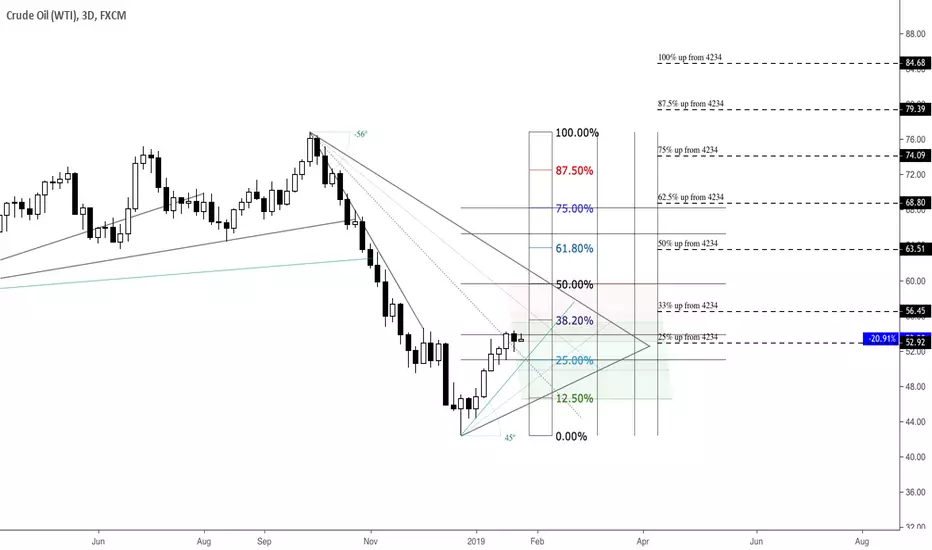
USOIL Potential Support & Resistance AreasThis 3 day charts shows basic retracement levels, percentage increase levels from the current low and angle relationship based support & resistance areas. So far, the oil market saw a sharp surge from the low $42, a longterm demand area, and currently it seems there's still some room for further upside. This move up can be regarded as a retracement leg within a bigger downtrend, the common retracement level being 38.20%, which falls around the $55 mark. However, there is an inverse head and shoulders pattern also noticeable on higher timeframes, so buyers might push for the 61.80% after taking some profits. Buying into weakness seems reasonable for now.

ADYEN Gann crossingsNotice the crossings of the trend line with the horizontal fib levels and red pl lines. We often see a change or acceleration of a trend during those periods.


Silver Short till Feb 18 then long to 17.2 SI1 target by 10 May The obvious 20-year long wedge pattern has a focus of 10 May at 17.2 - I expect it to break down before then, test higher prices and then crash to $10 levels to complete the medium term downtrend.
The GannBox and Arcs have been very informative for this Silver downtrend (as well as at shorter timescales). Note the way the medium term GannBox meshes with the longterm GannFann.
I've reversed my long as per my previous ideas on this, and expect to reverse my shorts a bit below 15 mid Feb as it consolidates and completes its drop from the 1:1 ray to the 2:1 ray and makes its exuberant false break up.
After the breakout I expect to see a sharp drop reminiscent of the wedge breakout you can see in 2011-2013. Note that that ended with a two year $9-wide ($26 to 36) trading range. We've just completed a two year $2 wide trading range from about $15.75 to $18 and are still experiencing the high volatility following the false break down that ended it (which we've just seen disconfirmed as we've rentered the trading range). But this false break presages the true break coming in May.
I expect the consolidation around the $10 level to take us to September, getting us ready for a new bull market over the next couple of years.
Interesting times for Silver


BTC USDT on Binance toward 433xa retest down to 384x could happen before that
"based on GANN method"


ETHUSD | 3H | DOUBLE ELLIPSE n GANN BOX SETUPThis is a new combination of a double ellipse and gann box positioned in harmonic manner. FYI, ellipse edges are very powerful resistances and supports. There is still some room for another bounce.. enjoy!
Cheers,
Keops

SPX500 | W | DOUBLE ELLIPSE n GANN BOX SETUPMore testing on this new setup. FYI prices react to ellipse edge.. enjoy!
Cheers,
Keops

SILVER | 12M | FRACTAL GANN BOX SETUPHappy New Year O' man, silver could be on the verge of major breakout. If true, major resistance is expected around 20.86$. This is a long term chart of comex silver contracts.. enjoy!!
Cheers,
Keops

Longterm ES ChartThis is a monthly chart that shows important relationships in terms of price and time. As we can see, through the 2008 crisis the market plunged almost 60% and saw around 350% increase thereafter, painting an all-time high in September 2018. Currently, the 10-year-cycle is seemingly done and another big selloff in the equity market appears to be zooming. The 25%, 33.33% and 50% areas from the all-time high are potential targets and reversal zones. Selling into strength seems reasonable here.
