Bitcoin high tech maskIn the picture, the Bitcoin price statistics are indicated in white and Tesla in orange as a percentage for almost all time to give Musk a little head start, otherwise the all-time trend of his offspring would turn into a almost horizontal line at zero.
In the area of the blue rectangle, after the fourth (maximum) rise in the price of the blockchain coin, Elon himself got involved in speculative reasoning in his favorite social network, which contributed to the second wave and even slightly affected the value of his brand's shares, which can also be seen in the picture if you take a magnifying glass.
In general, this is the potential of an unchanged protocol in comparison with the manufacturing giant "the richest man in the world." And this is not the end, the next exponential wave is expected around $200k, then $500k, $1mln, and so on ad infinitum and, accordingly, in proportional periods agreed by mathematical or, if more convenient, geometric rules of time, because we have nothing more stable.
Gann Box

DPZ 2013-2015 Cycle with 2021-2022 SimilaritiesBTC Cycle studies with time study and gann 8/1 breakouts during halving.

BTCUSD: Range Approximation This chart suggests that the BTCUSD market is currently in a ranging state.
We have tried to identify supply and demand zones in this range environment.
The suggested levels are as follows:
High teens for increasing long exposure
Around 28k squaring off long positions
Sit out the area in the middle
This kind of price behavior is expected as the market participants are going through range normalization after the price discovery stage.
Trade with care and own your risk.


When It Might EndUsing Projection, Sine Line, Gann 192 day time cycle, my educated "guess" is this virus will peak around August 2020 with approximately 3.7 million U.S. cases and start to decline until bottoming out in Feburary 2021. Squeeze Momentum Indicator by Lazy Bear showing 2nd wave of infection.

BTC new cycle (revision)This idea is a revision to my last idea! Last cycle had been started from January 2019 until April 2021 and many analyst believe that 69k at November 2021 was ATH but in my view 64k (April 2021) is ATH , anyway i want to say i'm using Gann Box to predicting next cycle bottom and top dates and i can say you bitcoin's true bottom will form by middle of this october and ATH will happen exactly on September 2025. about high and lows of this new cycle i checked last cycle and found these fractals: Wave 1 Fib 0.618 @41k , Wave 2 Fib 0.382 @22k , Wave 3 Fib 2.0 @116k , Wave 4 Fib 1.618 @93k , Wave 5 Fib 3.0 @150k -Goodluck

BTC - An Overview Here is my long-term outlook on BTC, as you can see - I am a fan of Gann Squares, this can be used as a long-term look at BTC's objectives.
I hope you all enjoy!
BINANCE:BTCUSDT
-NOT FA


My Weekly Analysis 40 Pt. 1I go through my currency pairs and analyze them while listening to music and talk to you guys.
*not a financial advisor*

BBBY: Trading the Meme This stock is all over the news these days.
Many pro traders in the biggest banks are shorting this stock; WSB is longing.
Looking at the monthly structure, it is looking better for bulls in my books. Though some of the juice has already been squeezed, it still has room for further upside for long exposure. For those not in it by now, it will be increasingly more challenging to have a good risk profile from here. At least a 20 dollar per share downside risk if one is to be exposed to short risk at the current market price.
Following this stock as it has some wild moves and will update if anything interesting is happening.
Cheers!

Time to SellBelow is my analysis, News will definitely affect this play, currently about to hit a support line, once it breaks, wait for the retest and then enter. I am placing a Sell Stop
Short Position
Entry 1.20500
TP1: 1.19400
TP2: 1.18481

AU Setup 4 Hour Supply ZoneLooking for the pullback into the supply zone on the 4 hour and then selling to the 127 Fib zone.

SELL LIMIT ORDER ON AUDUSD ACCORDING TO MY TECHNICAL ANALYSIS.Educational Analysis says AUDUSD may go SHORT. According to my technical.
This is not an entry signal. I have no concern with your profit and loss from this analysis.
Why SHORT?
On 4HR AND 1HR timeframe pair is making LOWER HIGH AND LOWER LOWS.
I HAVE NO CONCERNS WITH YOUR PROFIT OR LOSS
HOW TO TAKE ENTRY ON THIS?
On 15 min timeframe, the pair changes its character and the price push toward also pair breaks the major structure
SELL LIMIT ENTRY:- 0.69786
STOP LOSS:- 0.69828
TAKE PROFIT:- 0.66273

$ADA Cardano - potential range break outOK here we go with a potential break out of the range for $ADA
What i like about this setup is there was a swing fail pattern when price previously took out the top of the range and dropped back to the mid range/20 period SMA where buyers stepped in, since then we have rallied to the range highs again and i think its likely we see a break out, considering there is an overall bullish trend at the moment in crypto
tldr
entry 0.5156 ish
target 0.5336 ish (top of the break down candle close)
stop 0.501 below the mid range level
follow me on my twitter :)

SHOP: RECTANGLE PATTERNSHOP (SHOPIFY)
Nice rectangle pattern with prices ranging 30 and 40.
Rectangle can be either continuation or bottoming/reversal patterns.
Now trying to break the top of the rectangle . Price also above EMA 50 which is positive.
A firm break of 40 would trigger a long trade to 54, with numerous resistances on the way, including a gap (see lines on the chart).
Stop loss just below the 50EMA
Trade safe!

NVAX again - it's party time with GANNAfter 6 months of suffering, next 2 weeks will be pay-week for NVAX investors. My chart should be self-explanatory, of course there are pullback along the way, I'll let you figure this out on your own. It took me sometime to put this together. So enjoy. Hopefully some of these come out correctly :)
(This is a near term chart - the white line is the trend line)

OGN/USD - Gann Box Outlook As the Gann Box is no silver bullet, it provides a nice outlook on levels for OGN, here's my Gann Box :) enjoy

USDJPY Range Theory The small box are S&D zones.
Stoploss below the S&D zones.
1:1, leave a runner for tp.

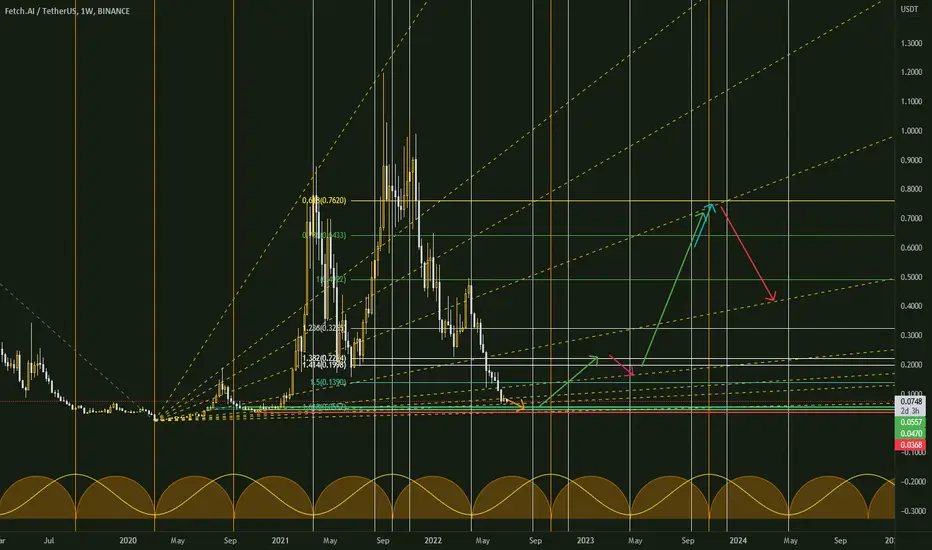
$FET Chart$FET looks good to buy in the 0.057/0.047 area, I think it will start going up on 10 OCT and below 0.0368 looks bad to me.
And you can see The targets on the chart:
1- 0.4922
2- 0.6433
3- 0.762
I will gradually reduce my intake during the ascent and not rely on one target.
>
MANYAVAR Looks Strong, Can breakout of BOX Trade soon!NSE:MANYAVAR Looks interesting, its trading in this range from last couple of days, on good days of NIFTY stock gives good momentum on Upside.
Might soon breakout of the Box trading active in last couple of days on this counter.

BTCUSD: Preparing Positional Long EntrySince our last post, the BTCUSD market went through a corrective phase that brought the price to the mid20k level, the lowest price since the onset of the price discovery phase when the prior ATH was left behind with a bang. It is an exceptionally well-behaved market despite the turmoil that many other DeFi projects incl. stable coins have been going through. It seems reasonable to be looking for opportunities to add to long exposure in this market as the risk/reward is becoming more attractive.
Key events/levels to look for clues:
25k bottom retest;
25k bottom retest +break = 7.5k extension lower;
17.5k - 22.5k as a major bottom.
INDEX:BTCUSD is at a very pivotal moment and opportunities always come with risk, do manage the risk accordingly.
Staying tuned for further tells.
