MEV Bot Exploit by MIT-Educated Brothers Leads to $25M CryptoIn the dynamic world of crypto trading, where cutting-edge innovation meets finance, abuses are inevitable. One of the most prominent cases of the year involves brothers Anton and James Peraire-Bueno, MIT graduates accused of exploiting Maximal Extractable Value (MEV) strategies to siphon off $25 million from the Ethereum ecosystem within seconds. The case may set a precedent for how automated behavior in decentralized systems is judged under traditional legal frameworks.
What Happened?
According to the prosecution, the brothers deployed several Ethereum validators and used specialized algorithms to reorder transactions within blocks. This allowed them to front-run other MEV bots and redirect transaction flows in their favor—a textbook mempool attack. In just 12 seconds, they allegedly drained $25 million in ETH and other digital assets.
Why Is This Case Unique?
First major MEV case involving such significant financial losses
Criminal charges despite actions operating within protocol rules
Academic background of the defendants adds to the public intrigue
This case raises a key legal question: Can actions that are technically “legal” under protocol rules still constitute fraud if they are knowingly harmful to other participants?
Implications for the Crypto Industry
The trial could redefine ethical and legal standards in the DeFi and automated trading sectors. If convicted, this could trigger a broader review of front-running bots, sandwich attacks, and other MEV strategies that, until now, have existed in a legal gray area.
As the regulatory landscape evolves, this trial may become a cornerstone in shaping how future MEV tactics are governed—and how automated trading fits into the legal definition of financial manipulation.
Gann Fan

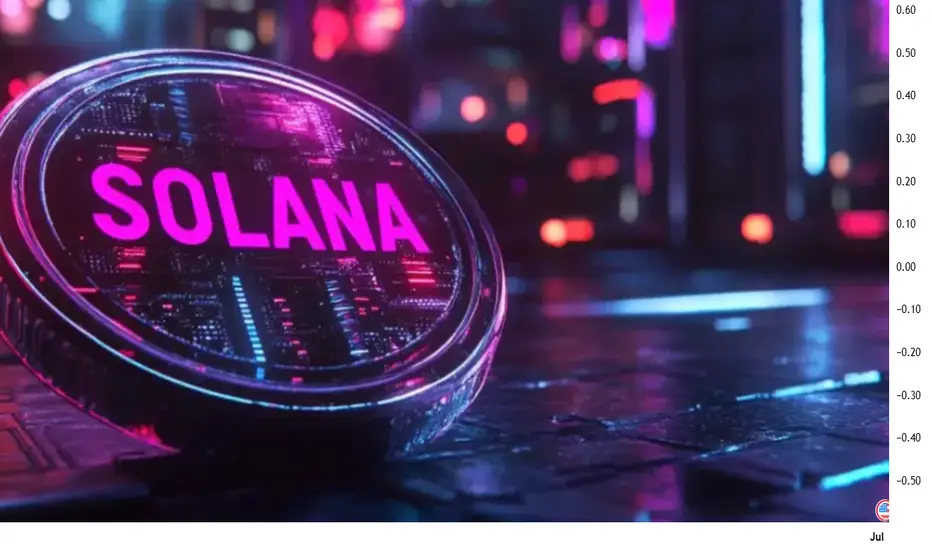
Solana and BNB Chain Lead Blockchain Growth: Weekly HighlightsRecord Activity: 342 Million Transactions in Just 7 Days
July 2025 marks a historic milestone for the crypto industry: in a single week, public blockchains processed more than 342 million transactions — the highest figure in the history of decentralized networks. Two platforms stood out the most: Solana and BNB Chain, ranking at the top in network activity and showcasing both technological maturity and growing user demand.
Solana — The Engine of Hyperactive Web3
Solana continues to prove its reputation as one of the most high-performance blockchains. Over the past week, the network processed over 200 million transactions, accounting for more than 58% of total activity. This achievement is driven by Solana’s high throughput and ultra-low fees, making it highly attractive for mass adoption and retail developers.
One of the main growth drivers has been the surge in meme coins and simple tokens created on Solana through platforms like Pump.fun. While these assets are often speculative, they generate massive traffic — tens of millions of transactions daily from thousands of users. This in turn boosts TVL and DEX activity.
But Solana is no longer just about gamified tokens. Increasingly, serious projects in DeFi, infrastructure, and Web3 gaming are launching on the network. New NFT platforms, liquid staking services, and retail investment apps are transforming Solana into a hub for both speculators and long-term participants.
BNB Chain — Stability, Infrastructure, and Maturity
While Solana grabs attention with viral growth and hype, BNB Chain demonstrates the steady strength of a mature ecosystem. The network handled approximately 65 million transactions, securing second place in the weekly rankings. User and developer activity remains consistently high, while tools for building DApps and DeFi products continue to expand.
Recent upgrades, including faster block finality and support for new standardized smart contracts, have enhanced user experience and transaction speed. In 2025, BNB Chain is targeting throughput of up to 20,000 transactions per second, aiming for scalability on par with centralized exchanges.
BNB Chain also plays a strong role in GameFi, logistics solutions, stablecoins, and cross-chain interoperability, positioning itself as a foundation for integrating traditional business models into the crypto ecosystem.
Why This Growth Matters
This record-breaking week signals that crypto has moved far beyond speculative trading. Blockchains are becoming operational environments where millions of value-driven transactions occur daily.
The surge in activity on Solana and BNB Chain underscores a key trend: platforms that combine high traffic capacity with usability and cost efficiency are taking center stage.
Risks and Challenges
Despite the positive outlook, vulnerabilities remain:
Solana could overheat. Activity driven by meme coins is volatile — if hype fades, engagement could plummet.
BNB faces competition from Ethereum L2. Fast, low-cost L2 solutions like Arbitrum and Optimism could lure users away.
Regulatory threats. Any sanctions or restrictions, especially in the U.S., could negatively impact both networks.
Conclusion
Solana and BNB Chain represent two distinct strategies for success:
Solana: speed, scale, and viral engagement.
BNB Chain: stability, ecosystem depth, and infrastructural strength.
Their dominance during the biggest week in blockchain history proves they are among the key architects of the new digital economy. Which one will maintain leadership in the second half of the year remains to be seen — but one thing is clear: the fight for the heart of Web3 is on.
The chart you've shared is a 15-minute gold (XAU/USD) CFD tradinThe chart you've shared is a 15-minute gold (XAU/USD) CFD trading chart, and it illustrates a bullish trade setup based on price action and possible harmonic or pattern-based analysis. Here's the breakdown of the idea:
---
📊 Trade Idea Overview:
Asset: Gold (XAU/USD)
Timeframe: 15-minute
Bias: Bullish (Buy/Long Setup)
---
🔍 Technical Details:
Pattern Observed: Possible double bottom or bullish corrective wave structure (Elliott Wave or ABC correction completion).
Entry Point: Around $3,430.40 (market price at time of setup).
Take Profit (TP): ~$3,450.31
Stop Loss (SL): ~$3,420.03
---
📐 Risk-to-Reward (R:R) Ratio:
Approximately 2:1, indicating a favorable reward relative to the risk.
---
📈 Rationale for Bullish Bias:
Price has completed a series of lower highs and lower lows (a corrective phase).
Price has bounced from a key support zone (~$3,429), suggesting buyers are stepping in.
The blue projection arrow indicates an expectation of upward continuation.
Volume is relatively steady with no significant bearish spike, supporting a potential reversal.
---
✅ Confirmation Indicators (Optional Additions):
You may want to look for:
Bullish candlestick patterns at the entry point (e.g., hammer, engulfing).
RSI divergence or bounce from oversold.
MACD crossover or histogram shift.
Trendline break confirmation on lower timeframes.
---
⚠️ Trade Management Tip:
Consider trailing your stop once price reaches halfway to TP.
Watch for reaction at interim resistance levels (e.g., $3,440 area).
---
Would you like me to generate a trade plan or script this into a trading journal format?

BTC Elliott wave analysis 6/8/2025 In my view, we are currently entering an A-B-C corrective wave, which is part of wave (4) and will complete wave (iv).
The bullish Crab harmonic pattern suggests that wave Ⓐ of (4) should bottom around 95,600–96,000. Following that, the Gann fan indicates that wave Ⓑ could rise to the 100,000–101,000 range, which also aligns with a key resistance zone.
For wave Ⓒ, the Gann fan suggests a downward move to around 94,000–92,000, a zone that corresponds to strong support.
Once wave (4) completes, the market should be positioned to begin wave (5), which will finalize the larger wave ⑤.
A key validation level to watch is 84,000. If the price drops below this level, the count would be invalidated, as wave (4) cannot fall below the low of wave (2).

CAPITALA to add or enter after 0.94using gann fann, it seems that it is currently at upper border
price currently retraced at 23.6% an uncommon level
for this stock, i will wait and see

XUSDT Reversal Point - Buying OpportunityIn the upcoming week, starting from June 2nd, I anticipate a price drop to 0.00006388. This level could serve as a potential reversal point, but only if the price reaches it within the current week. Please note that this price level is valid only for one week; after that, the chart conditions and traders' behavior must be re-evaluated

BTC Elliott wave analysis 5/23/2025For me , I think that the BTC price is on the way to their target price around 128,000-133,000 that we derive from Gann fann resistance.The wave structure suggest us that the impulse that create new high is just the beginning. The invalidate point is the point below wave 2 (around 101,000).

Short then Buy GOLDLong term bullish obv unless breaks happen. Shorting to get better entry then taking a long to the general upside from sustained movement and trend.

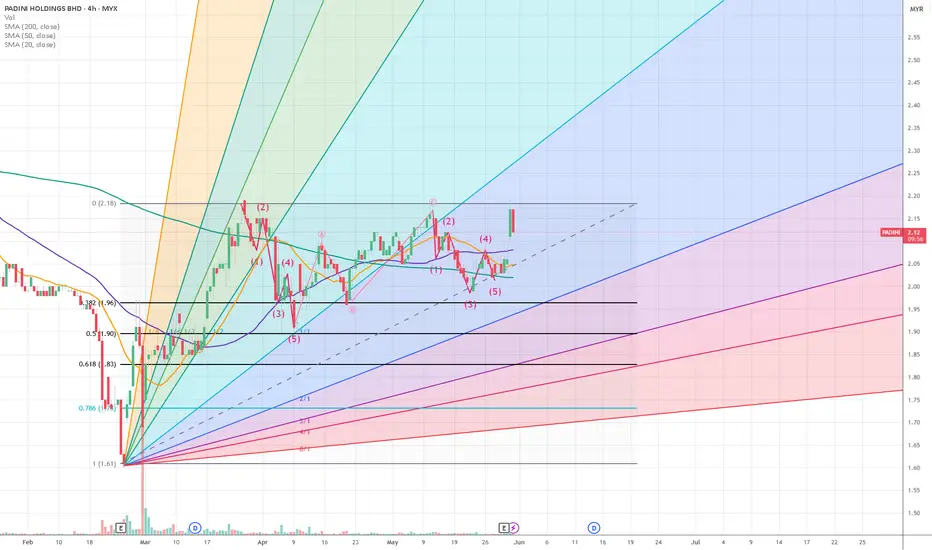
PADINI is moving to 3rd wavealready retraced to 0.5 level during retracement of 2nd wave
tried to calculate the wave ... seems like ABC correction of 5-3-5 already finished
will give dividen albeit a bit lower than previous
but still a good fundamental company
AEMULUS is retracinghow low it will retrace
this analysis is using a combination of gann and fibonacci retracement numbers
maybe from using this combination, we can also predict the time reversal will happen

will KFIMA be the SUPERSTOCKearnings released yesterday
today is friday, closing of the week
breakout
BUY signal green appeared
will give dividend with DY at current price = 7.34%

HBAR Masterclass: Fib Precision + ConfluenceHBAR has been a dream to chart lately — beautifully technical, clean reactions, and a strong respect for structure. When a chart follows fibs this precisely, charting becomes fun — like solving a puzzle that pays. You stop forcing trades and start enjoying the process.
Let’s break down where the next high-probability trade setup lies — and why.
Elliott Wave Context
HBAR recently completed a 5-wave impulse structure and is now unfolding a ABC correction:
✅ Wave A: Broke below Wave 4's low
✅ Wave B: Rejected cleanly at the 0.618 retracement of Wave A
🔄 Wave C: Currently unfolding, with price structure hinting at a Head & Shoulders forming to the downside
Interestingly, HBAR has been bouncing between golden ratios like a Fibonacci pinball machine. — reinforcing how well this asset respects technical structure.
🟢 Long Opportunity: The Golden Pocket Zone
By pulling Fibonacci retracement from the entire 5-wave leg (from $0.16941 to $0.22885), we uncover the golden pocket:
0.618 Fib → $0.19212
0.666 Fib → $0.18926
But what really strengthens this zone is the confluence:
📍 21-Day EMA → $0.19361
📍 21-Day SMA → $0.19229
📍 Anchored VWAP from the $0.15396 low → ~$0.19135
📍 4/1 Gann Fan support (if reached between May 15–17)
Together, they form a tight support band between:
🎯 $0.195 – $0.18926
📐 How We Projected the 1.618 Target
Here’s where the magic of planning comes in.
If Wave C finishes within this golden pocket, we can anticipate the next move by applying a trend-based Fibonacci extension. This gives us a realistic projection for the next impulsive move:
📈 1.618 extension lands at → $0.28654
This level also aligns with the yearly level and previous key high — forming an ideal final target
📘 Educational Insight: Why Golden Pockets Matter
In trading, the “golden pocket” — the 0.618-0.666 Fibonacci retracement zone — is often where high-probability reversals take place. It’s a zone where buyers (or sellers) return with conviction after a correction. When this area also aligns with EMAs, anchored VWAPs, Gann levels etc. and previous structure, it becomes more than just a level — it becomes a decision zone.
This is where confluence transforms a trade idea into a trade setup.
🟢 Long Trade Setup:
Entry: Laddered between $0.195 – $0.18926
Stop-Loss: Below $0.185
Take-Profit: $0.28654
R:R: ~10:1
Potential Gain: ~+50%
🔴 Short Setup (If Rejected at Extension):
If price hits $0.28654 and shows exhaustion or bearish reversal patterns (SFP, engulfing candle, volume spike), a short could be considered:
Entry: ~$0.286
Stop-Loss: $0.2967 (better above $0.3)
Target: $0.2622
R:R: ~2:1
HBAR is giving us a textbook case of structure, rhythm, and precision. Whether it’s the golden pocket, the 1.618 extension, or the alignment of multiple tools — this is how clean setups are built.
Set your alerts. Trust the plan. Let the chart come to you.
In trading, silence is a skill — knowing when not to act is as powerful as knowing when to strike.
____________________________________
If you found this helpful, leave a like and comment below! Got requests for the next technical analysis? Let me know.

BTC Elliott wave Analysis 23/4/2025I think we have close to the End of the big B wave that is the part of the the wave 4 (Start from Nov 2022 crash).We Should see a clear Divergence soon in big time frame like 2 , 4 Hours to confirm that the pivot has come.For me I think the target price that is the pivot point is around 96000-97000 since bearish shark pattern harmonic and Gann fan suggest us.

$NQ 2H April PlaybookWe've got some serious overhead resistance and unless something truly blows us away in earnings, the path is lower but with less volatility than recently. No new lows in April and certainly no highs.

92% Win Rate Strategy Using Gann’s Planetary LongitudeHave you ever wondered how some traders seem to anticipate market reversals with uncanny precision, almost as if they can see into the future?
Well, what if I told you that the secret doesn’t lie in guesswork or traditional retail indicators, but in the heavens themselves?
Let me walk you through one of the most powerful forecasting tools in Gann's arsenal—the Planetary Longitude Method and how I used it to identify the exact price level from which the market reversed.
The Power of Planetary Time Cycles in Trading
This technique isn’t based on patterns, trendlines, or lagging indicators. It’s rooted in precise planetary time cycles, the same natural laws that govern the movement of celestial bodies.
Gann believed the markets were not chaotic but deeply connected to universal rhythm and planetary motion. According to his planetary longitude method, each planet holds a specific degree of longitude at any given time. These degrees can be directly mapped onto price charts, turning astronomical data into actionable trade setups.
When price meets planetary longitude, something extraordinary happens. These degrees act as invisible support and resistance levels—ones that retail traders never see. They are silent yet powerful markers of change, and because they are rooted in cosmic cycles, they give you a strategic edge in timing your trades.
Why These Degrees Matter
As a trader, what you’re truly looking for is reaction zones, areas where price is likely to pause, reverse, or accelerate. When planetary time and market price converge at a particular degree, it creates what Gann called a "vibrational point", a moment of energetic alignment. These are high-probability zones where you can anticipate market turning points with accuracy.
By tracking the longitudes of key planets, such as the Sun, Moon, Mars, Jupiter, or Saturn—you can identify these critical junctures. Each planet brings its own cycle, its own tempo. For deeper, longer-term reversals, I often rely on the slower-moving planets like Pluto, while for short-term setups, I look at the faster ones like the Moon or Mars.
How I Forecasted the US100 Reversal from 19,384.6
Now, let’s get practical.
In this recent example, I was closely watching the US100 index, where I anticipated a potential reversal around the level of 19,384.6. Was this just another support/resistance zone? Absolutely not.
Here’s how I arrived at this precise level using Gann’s Planetary Longitude Technique:
First, I took the price level of 19,384.6 and converted it into degrees. To do this, I simply subtracted 360 repeatedly from the price until I arrived at a number less than 360. This process is based on the 360° circle of the zodiac—once the price cycles through the full circle multiple times, what's left is the vibrational degree associated with that price. In this case, the price level of 19,384.6 converted to approximately 304.6°.
Then, I checked the planetary position of Pluto which was 303.55° in longitude.
This created a near-perfect alignment between Pluto’s time cycle and the vibrational price degree. When planetary time meets price, it forms a cosmic convergence zone—a point of natural balance where the market is highly likely to react. So, I wasn’t just guessing—I was waiting for that moment of planetary resonance.
And as the chart clearly shows, the market reacted sharply the moment it touched 19,384.6, confirming the sensitivity of this degree. It wasn’t random. It was a harmonic response, echoing the laws of cosmic vibration that Gann so strongly emphasized.
This is a real-time example of how combining planetary time with price geometry can give you a decisive trading edge, especially in forecasting major turning points.
Why This Method Works
The market respects these planetary degrees not because of mysticism, but because it moves in cycles—natural cycles that repeat. The alignment of price with planetary longitude often marks pivot points in the market.
And this method doesn’t just help with identifying reversals. It also enhances your entry and exit timing, allowing you to trade with confidence, knowing you're aligned with the larger cosmic structure that influences all things—including financial markets.
Final Thoughts
This is just one example of how planetary geometry, when applied correctly, can lead to powerful trade setups. While Pluto offers long-term signals, don’t underestimate the value of the Moon, Mars, or Jupiter for shorter timeframes. The market dances to their rhythm too.
And once you learn to listen to that rhythm, you'll never look at price the same way again.

SUIUSD I Weekly CLS, Key level - OB I Model 2, Multiple targetsHey Traders!!
Feel free to share your thoughts, charts, and questions in the comments below—I'm about fostering constructive, positive discussions!
🧩 What is CLS?
CLS represents the "smart money" across all markets. It brings together the capital from the largest investment and central banks, boasting a daily volume of over 6.5 trillion.
✅By understanding how CLS operates—its specific modes and timings—you gain a powerful edge with more precise entries and well-defined targets.
🛡️Follow me and take a closer look at Models 1 and 2.
These models are key to unlocking the market's potential and can guide you toward smarter trading decisions.
📍Remember, no strategy offers a 100%-win rate—trading is a journey of constant learning and improvement. While our approaches often yield strong profits, occasional setbacks are part of the process. Embrace every experience as an opportunity to refine your skills and grow.
Wishing you continued success on your trading journey. May this educational post inspire you to become an even better trader!
“Adapt what is useful, reject what is useless, and add what is specifically your own.”
David Perk ⚔

SPY: Yet another bearish SPY forecastLooking at the previous sell-off patterns, theres a strong possibility that if the downtrend continues, SPY will head to low 500's by mid-May before rebounding in the summer to retest current levels (540-560) before completing the final leg (or first) of a correction to the high mid-high 400 price level - or potentially low 400s in September. Its been a while since I've shared a predictive chart but the current market behavior makes it hard not to try to paint a picture. Heaps of salt to be taken - I've been wrong many times before

$NQ! Outlook through 3/21NQ has been falling one rung at a time on the Fibonacci circle from the most recent all time high. Normal behavior for a recovery would be to round the circle until the path becomes more upwards, so the path will take a while for true recovery. However with FOMC this week, I've allotted a short term good and bad path depending on the market reaction.

BTC on weekly to 73kClearly we can see bitcoin is down on a weekly chart. We just started to go up on a daily, just to find it's right fan line to a path down. Daily shows resistance at 93k, so it will make a double top - a right sign for swing down.

GBPUSD - SHORTConsider the development of a strong South Impulse. Sell on a false breakout or current price level! Target the lower Demand Zone.
GBPUSD - SHORT
ENTRY PRICE - 1.29420
SL - 1.30700
TP - 1.26240
Always follow the 6 Golden Rules of Money Management:
1. Protect your gains and never enter into a position without setting a stop loss.
2. Always trade with a Risk-Reward Ratio of 1 to 1.5 or better.
3. Never over-leverage your account.
4. Accept your losses, move on to the next trade and trust the software.
5. Make realistic goals that can be achieved within reason.
6. Always trade with money you can afford to lose.
Please leave your comment and support me with like if you agree with my idea. If you have a different view, please also share with me your idea in the comments.
Have a nice day!

AUDUSD – LONGAUDUSD – LONG
ENTRY PRICE - 0.62850
SL - 0.61800
TP - 0.64900
Always follow the 6 Golden Rules of Money Management:
1. Protect your gains and never enter into a position without setting a stop loss.
2. Always trade with a Risk-Reward Ratio of 1 to 1.5 or better.
3. Never over-leverage your account.
4. Accept your losses, move on to the next trade and trust the software.
5. Make realistic goals that can be achieved within reason.
6. Always trade with money you can afford to lose.
Please leave your comment and support me with like if you agree with my idea. If you have a different view, please also share with me your idea in the comments.
Have a nice day!

GBPUSD - LONGStrong cumulative flat. Buying opportunity after the formation of the Cypher pattern.
GBPUSD - LONG
ENTRY PRICE - 1.2912
SL - 1.28500
TP - 1.30780
Always follow the 6 Golden Rules of Money Management:
1. Protect your gains and never enter into a position without setting a stop loss.
2. Always trade with a Risk-Reward Ratio of 1 to 1.5 or better.
3. Never over-leverage your account.
4. Accept your losses, move on to the next trade and trust the software.
5. Make realistic goals that can be achieved within reason.
6. Always trade with money you can afford to lose.
Please leave your comment and support me with like if you agree with my idea. If you have a different view, please also share with me your idea in the comments.
Have a nice day!

Using Gann fan on BTC
By using Gann fan, we can easily see that BTC is bouncing between the lines. The projections of the 2 highs down to the low at 49k were the turns of the BTC. I expect the major trend to continue until a stronger projection at a very low.
