Nas100 short and hold small position Pivot: 14670.00
Our preference:
short positions below 14670.00 with targets at 14365.00 & 14150.00 in extension.
Alternative scenario:
above 14670.00 look for further upside with 14755.00 & 14830.00 as targets.
Comment:
the RSI calls for a drop.
Gann Fan

IDX: ADRO FOR NEXT MONTH STRONG SUPPORT AT 1830
MEDIUM RESISTANCE AT 1985
I PREFER GREEN TRADING PLAN
Disclaimer:
This information is for educational purposes and is not an investment recommendation or representative of professional expertise. This analysis used herein is for illustration purposes only. This personal opinion should not be considered specific investment advice. I am not responsible for any trades, and individuals are solely responsible for any live trades placed in their own personal accounts.

BTCUSD My prediction for BTC, I believe there will be an increase to 2, as the current cycle should close and the price will turn around and start falling, closing the old cycle on time. I may be wrong about the price ranges, but even if I'm wrong, the price usually follows the lines I drew.


IDX: INCO FOR NEXT WEEKMEDIUM SUPPORT AT 4410
WEAK RESISTANCE AT 4580
I PREFER BLUE TRADING PLAN. BEWARE DEAD CROSS
Disclaimer:
This information is for educational purposes and is not an investment recommendation or representative of professional expertise. This analysis used herein is for illustration purposes only. This personal opinion should not be considered specific investment advice. I am not responsible for any trades, and individuals are solely responsible for any live trades placed in their own personal accounts.

IDX: UNVR FOR NEXT WEEK STRONG SUPPORT AT 3550
STRONG RESISTANCE AT 4990
I PREFARE FOR YELLOW TRADING PLAN, PREPARE FOR REBOUND
Disclaimer:
This information is for educational purposes and is not an investment recommendation or representative of professional expertise. This analysis used herein is for illustration purposes only. This personal opinion should not be considered specific investment advice. I am not responsible for any trades, and individuals are solely responsible for any live trades placed in their own personal accounts.

IDX: MEDC FOR NEXT WEEKSTRONG SUPPORT AT 480
STRONG RESISTANCE AT 605
I PREFER YELLOW TRADING PLAN
Disclaimer:
This information is for educational purposes and is not an investment recommendation or representative of professional expertise. This analysis used herein is for illustration purposes only. This personal opinion should not be considered specific investment advice. I am not responsible for any trades, and individuals are solely responsible for any live trades placed in their own personal accounts.

IDX: TINS FOR NEXT WEEKMEDIUM SUPPORT AT 1370
STRONG RESISTANCE AT 1690
I PREFER RED TRADING PLAN
Disclaimer:
This information is for educational purposes and is not an investment recommendation or representative of professional expertise. This analysis used herein is for illustration purposes only. This personal opinion should not be considered specific investment advice. I am not responsible for any trades, and individuals are solely responsible for any live trades placed in their own personal accounts.

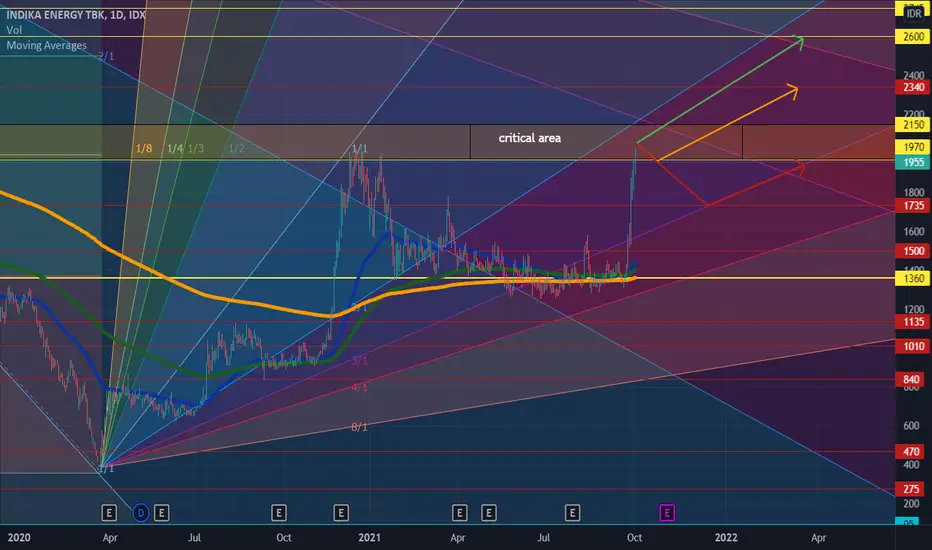
IDX: INDY FOR NEXT WEEKMEDIUM SUPPORT AT 1970
MEDIUM RESISTANCE AT 2600
I PREFER YELLOW TRADING PLAN
Disclaimer:
This information is for educational purposes and is not an investment recommendation or representative of professional expertise. This analysis used herein is for illustration purposes only. This personal opinion should not be considered specific investment advice. I am not responsible for any trades, and individuals are solely responsible for any live trades placed in their own personal accounts.
Bitcoin 💣 #btc #bitcoin $btcIf Bitcoin can close its daily candle above the price of $ 47,700, it can start growing towards the ceiling of this side of the fan, which is 1.1, but there is a point that we see a 4-hour time frame on our MACD indicator. We are a bearish divergence that may lead to a fall in prices. In any case, if bitcoin can establish itself on this side of the fan, we can hope to climb. Given the average strength of the trend, I do not expect Sharp to grow unless certain news accelerates its growth. Price supports and resistances are plotted on the chart.
I hope you find this analysis useful🌹
Follow for more...
#DYOR
My bitcoin address if you want to invite me for a cup of coffee:
bc1qpczs7uajtsu9qw2eszzmcjrsd0geq4jg7syznx


GBPUSD+ELLIOT WAVE+GANN FAN+FIBOThis chart shows the combination of the two fib cluster zone for wave 4 correction and the GANN FAN . The 2/1 ray will act as a strong support along with the blue fib cluster zone thus the blue zone cluster has a high probability and considered to be an ideal target zone. The price still has a possibility to dip lower to red zone but with a lower probability .
Good Luck

#btcstarburst OCTOBER 4th BIG DAY!! & MAY!!So after many hours of charting, and possible play out patterns BTC seems to follow two patterns according to the Gann theory AKA the only theory that i can come up with in the trading market…STUDY so far…. (These are only studies getting the timing right is key)… Hourly, daily and so on all seems to make sense…. There was a time Wyckoff apparently followed him around for a bit to figure out his own concepts, so there is that…. Entry and exit .75 (BLUE TO BLUE the run is….) At some point making an exit off the .25 has to happen to finish the structure to be consistent with all of the patterns. Downtrends seem to be easier to spot when using this formulation in reverse. The Geometry of the technique seems to play out very consistent. This chart shown should give a good outline of where we can go an where we need to be… Study Jon Fiorucci Breaking $79,800 would most likely boast into higher numbers that’s saying if we would go that direction…. I can see if we fall under $38,000 we would be sliding into the bear market and heading to around $29,500 In MAY…. But “BEAR MARKET” would only be the beginning of the upward structure that needs to be created according to Gann Theory SO IS MAY THE DAY???????? I could see big numbers in flowing in that Structure.. since the range is so large… The follow up structure will appear soon.
Study Jon Fiorucci

IDX: DOID FOR NEXT WEEKMEDIUM SUPPORT 320
MEDIUM RESISTANCE 380
I PREFER YELLOW TRADING PLAN
Disclaimer:
This information is for educational purposes and is not an investment recommendation or representative of professional expertise. This analysis used herein is for illustration purposes only. This personal opinion should not be considered specific investment advice. I am not responsible for any trades, and individuals are solely responsible for any live trades placed in their own personal accounts.

IDX: HRUM FOR NEXT WEEKSTRONG RESISTANCE AT 8475
MEDIUM SUPPORT AT 8000
I PREFEER YELLOW TRADING PLAN
Disclaimer:
This information is for educational purposes and is not an investment recommendation or representative of professional expertise. This analysis used herein is for illustration purposes only. This personal opinion should not be considered specific investment advice. I am not responsible for any trades, and individuals are solely responsible for any live trades placed in their own personal accounts.

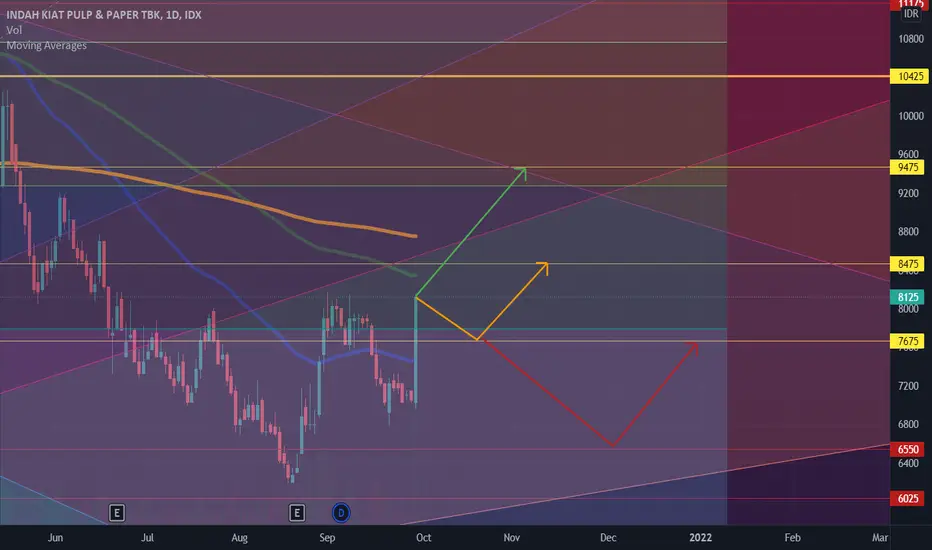
IDX: INKP FOR NEXT WEEKMEDIUM SUPPORT AT 7675
MEDIUM RESITANCE AT 8475
I prefer yellow trading plan
Disclaimer:
This information is for educational purposes and is not an investment recommendation or representative of professional expertise. This analysis used herein is for illustration purposes only. This personal opinion should not be considered specific investment advice. I am not responsible for any trades, and individuals are solely responsible for any live trades placed in their own personal accounts.

IDX: PTBA FOR THIS WEEK STRONG SUPPORT 2300
STRONG RESISTANCE 2700
I PREFER GREEN TRADING PLAN
Disclaimer:
This information is for educational purposes and is not an investment recommendation or representative of professional expertise. This analysis used herein is for illustration purposes only. This personal opinion should not be considered specific investment advice. I am not responsible for any trades, and individuals are solely responsible for any live trades placed in their own personal accounts.

IDX: PGAS FOR NEXT WEEKMEDIUM SUPPORT AT 1040
MEDIUM RESISTANCE AT 1325
I PREFER GREEN TRADING PLAN
Disclaimer:
This information is for educational purposes and is not an investment recommendation or representative of professional expertise. This analysis used herein is for illustration purposes only. This personal opinion should not be considered specific investment advice. I am not responsible for any trades, and individuals are solely responsible for any live trades placed in their own personal accounts.

IDX: HRUM FOR NEXT WEEK Strong support at 7425
strong resistance at 8000
i prefer yellow trading plan
Disclaimer:
This information is for educational purposes and is not an investment recommendation or representative of professional expertise. This analysis used herein is for illustration purposes only. This personal opinion should not be considered specific investment advice. I am not responsible for any trades, and individuals are solely responsible for any live trades placed in their own personal accounts.

COTIUSDT DAILY GANN FANN COTIUSDT daily GANN FAN shows how the price is respecting the rays power acting as either a resistance or support .
Good Luck

DOGECOIN DAILY GANN FANDOGECOING daily GANN FAN. currently the price has the 8/1 ray as a support and the 2/1 down ray as a resistance.
Good Luck
