IDX: WSKT BECAUSE WHY NOTWeak support at 1405
Medium resistance 1465
Long for tommorow, potentially go to its medium resistance if it surpass, can fly to 1600. Remember , dont push your luck, go at 1420 out at 1460 . N enjoy
have a nice trading.
Disclaimer:
This information is for educational purposes and is not an investment recommendation or representative of professional expertise. This analysis used herein is for illustration purposes only. This personal opinion should not be considered specific investment advice. I am not responsible for any trades, and individuals are solely responsible for any live trades placed in their own personal accounts.
Gann Fan

BTCUSD Gann Fan and Square AnalysisThe analysis I make is just an idea not an investment advice. Please manage your risk while trading and please make your investment decisions only by yourself.

My planAs I am new to this stock market, I am learning as I go along. As I keep learning the stock market, I am learning that I need to make my own rules to follow from the past data I see and the news that the company news that I see.
If anyone can shed some enlightenment on me, please feel free to share it with me. I am here to learn and make a little money for a little rainy day.
Thank you

USDJPYIf you liked the idea, the analysis please click on like and follow up, and you will receive everything new and exclusive
The analysis used William Delbert Gann
And astronomical analysis
And my own method that I have adopted in analyzing the price movement is very special

New Low on XAUUSD, let's go buy to the next resistanceNew analysis, this is my point of view about XAUUSD, we have a new lower point.
The last time this price was reached was the 10th june 2020, then the price go up to 2014 (The Highest point actually).
The price should bounce to higher point for now, so i have target 2 resistance as you can see on the chart.

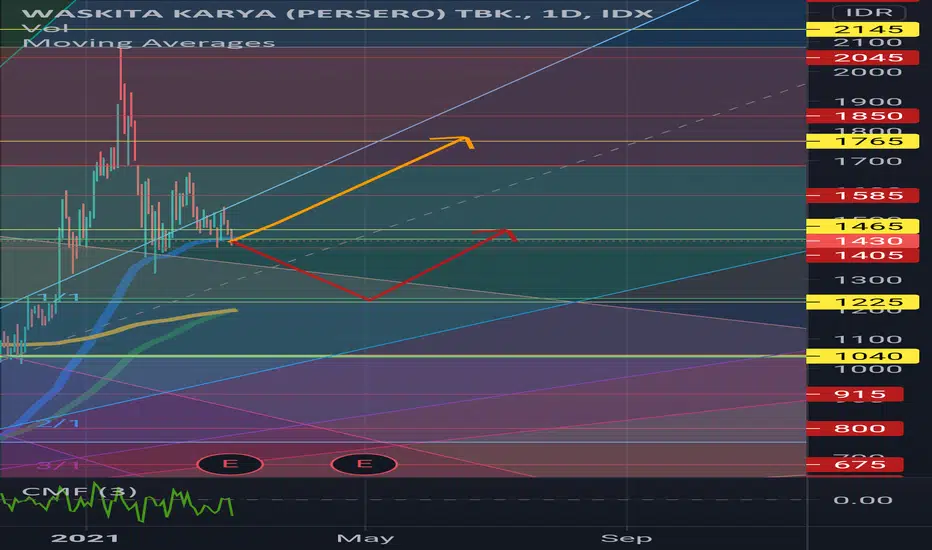
IDX: WSKT UPDATE MARCH 4, 2021Weak support at 1405
Weak Resistance 1585
Golden cross
Go at 1470, potentially surpass its weak resistance
have a nice trading.
Disclaimer:
This information is for educational purposes and is not an investment recommendation or representative of professional expertise. This analysis used herein is for illustration purposes only. This personal opinion should not be considered specific investment advice. I am not responsible for any trades, and individuals are solely responsible for any live trades placed in their own personal accounts.
Costco RSI weekly goes back to 40 soonit could take a long time but at some point, RSI 40 weekly is going to be touched
that means it can loose 50% during a recession and still be very bullish historicaly


BAND - may have found its footingSo, I'd gotten sucked into the false belief that BAND didn't hit an intermediate top when it did.
I was fooled by other coins blasting through similar points.
All the while I was noticing that Bitcoin was showing signs of weakness, and perhaps reaching an intermediate top of its own. That did end up happening, and we got the corrections in the USD pairs as we did.
So, this brings us down close to the 11 dollar support, where we are repeating an accumulation area close to the first 10 days of February. Once we were able to break out of that area in february, that is when we went close to $20.00 US.
Currently I think that we just did our confirmation "hook" onto the top area of a local downtrend (which has confluence with a Gann Fann for this price action area) to confirm it as support, and there is a chance that we may go up from here to test the ATH, where my next target area is $23-24.00.
There is an area just below this that goes to the strong support of $7.00, but I think that just as we do to the upside, everyone tends to over-shoot the correction, too, and expects it to go a little bit further than what it actually ends up doing.
I would keep funds on the side just in case we do go visit the $7.00 region, but I would not hold my breath on it, either.
So again, I would have my eyes on our current All Time High in BAND around $20.00 as a first target, $23-$24 as a second target, and $32.00 as big target for this intermediate term run if we get it. I have targets higher than this, but I tend to trade in what I see as intermediate trends in the market.
Thank you!


IDX: GIAA CRITICAL AREAweak support : 374
medium support : 386
Medium resistance : 414
EMA 144 AT 333
EMA 377 AT 335
374 - 386 is a critical area, I'm prefer waiting until golden cross. in when 388 , out at 410.
have a nice trading.
Disclaimer:
This information is for educational purposes and is not an investment recommendation or representative of professional expertise. This analysis used herein is for illustration purposes only. This personal opinion should not be considered specific investment advice. I am not responsible for any trades, and individuals are solely responsible for any live trades placed in their own personal accounts.

IDX: WSKT DONT PUSH YOUR LUCKSupport 1465
Resistance 1765
EMA 144 at 1188
EMA 377 at 1192
Dont push your luck, i'll prefer orange plan. wait until golden cross
WSKT will go to it's support and bouncing to resistance
have a nice trading.
Disclaimer:
This information is for educational purposes and is not an investment recommendation or representative of professional expertise. This analysis used herein is for illustration purposes only. This personal opinion should not be considered specific investment advice. I am not responsible for any trades, and individuals are solely responsible for any live trades placed in their own personal accounts.


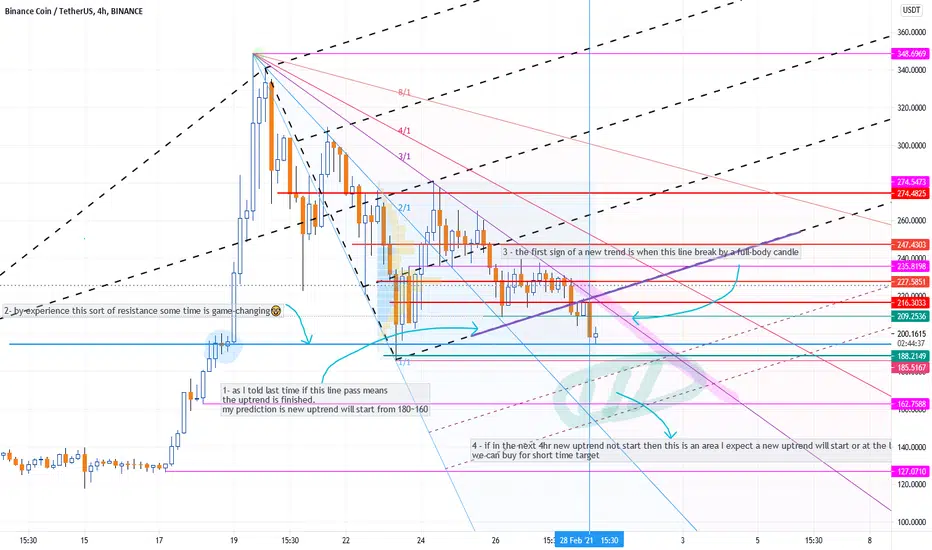
Open test drive on MondayThe market is going to open near the previous weeks' highs (blue both dotted and solid). It will probably reach for sell liquidity and draw the market back down before Wednesday. Although I favor a bearish scenario, bullish price action is also possible.
I also put a Gann Fan on to see if this tool can be any useful.

IDX: SMBR GOLDEN CROSS Medium support = 920
Strong resistant = 1090
Golden Cross EMA 144 x EMA 377
will fly to 1050, Long for next week
have a nice trading
Disclaimer:
This information is for educational purposes and is not an investment recommendation or representative of professional expertise. This analysis used herein is for illustration purposes only. This personal opinion should not be considered specific investment advice. I am not responsible for any trades, and individuals are solely responsible for any live trades placed in their own personal accounts.

EURJPYIf you liked the idea, the analysis please click on like and follow up, and you will receive everything new and exclusive
The analysis used William Delbert Gann
And astronomical analysis
And my own method that I have adopted in analyzing the price movement is very special
The euro-yen movement expected for this week will be pivotal for the decline, and any rise is a force for a drop to the resistance level shown in the picture, and by breaking this resistance indicated in gray and closing a four-hour candle with Price Action above it, any drop is forgotten, but the market maker in this region entered into selling
By God, I know that euro is jpy to drop for this week, at least to the level of support shown on the quarter-hour frame
Attention, just the thought of the decision in your hand before and after anything, and we ask God for success from his bounty


Reputation gather: ZRXUSDHi there, new to charting and trying to get some recognition so I can chat in the forum there and learn how to do this for REAL. Im seeing some breakout potential here on the 1 hour chart after a pretty good consolidation period. Again, still new to this so feedback is welcome!

Dogecoin on Big Move Up?Do we have here big up trend for dogecoin?
Target 1 - 0.07520
Target 2 - 0.10521


Holo Is About to kick offHolo is getting ready to explode.
My target's
Target 1 - 0.0043531
Target 2 - 0.0059243
