PLTR Bottom?Had a great run after it formed a symmetrical triangle and broke out. Since the breakout, we have pulled back nearly 40%. Like many of my analyses, we see key pivots in the stock at the 8/1 Gann angle. I believe this along with the fundamental news of the companies quarterly earnings will continue this breakout and bring the price above the recent highs of $44.
Gann Fan

BTC 4 hour analysiswill we break out of the rising wedge to the upside, extend it, or fall down? 55k looks like a nice target to take profit to me


Gann Fan Analysis and Short Term ProjectionGBPUSD has the probability to continue a downward retracement early next week after rejection of the fan angle currently being tested as resistance.

DXY: Advanced Gann Analysis; Dollar Ready to Rally?The Dollar appears to have found it's legs and bounced off of a deep down trend angle. This could be a sign that the Dollar is ready to rally. Additional confluence will be needed to be secure in longing from here, but probabilities look good that new local highs may print in the near future.

GBPUSDIf you liked the idea, the analysis please click on like and follow up, and you will receive everything new and exclusive
The analysis used William Delbert Gann
And astronomical analysis
And my own method that I have adopted in analyzing the price movement is very special


King of Coins - BTCBitcoin seems to be in the last wave of its rising Elliott.
Thank you for your comment.

Corn: A Potential Fade Approaching Corn seems to be in the final stage of a bullish run here. In terms of % gain, it is almost at the psychological 100% increase area from Mar'20 low. Short risk exposure is becoming more risky at these levels. With another push higher, some decent supply inflows are expected.

GBP/USD: Wargaming the Remainder of February.Ah, GBP...she's enough to make a grown man cry sometimes. We just witnessed the market make a massive breakout bull run against the USD, with not a single significant pullback. Shall the insanity continue into March? Or shall we see GBP cool her heels a little bit in the massive liquidity pools that have been building below for ages now? In this analysis I use the Gann Fan to assist with projecting price into time. The market seems to want to do everything it can to keep GU from making any type of significant retracement on the higher time frames. These fans were somewhat difficult to pull handles for, as price action has been extremely one sided for quite some time now. Time for a rest, perhaps? Let's find out...
What do you think? Let me know in the comments which scenario you think is more likely and why!

AUD/USD: Wargaming the Remainder of February.In this analysis I use the Gann Fan to assist in projecting price into time. I've come up with two probable scenarios based on previous price action and current market context. Given the incredible bull run that AUDUSD has been enjoying, it's easy to favor more upside. However, developing market structure at this level suggests a potential period of consolidation or even moving to retest support or make new lows below last support into March.
Which scenario are you most biased towards? Let me know in the comments which one you favor and why!

EUR/USD: Wargaming the Remainder of February. In this analysis I use the Gann Fan to assist in projecting price into time. I've provided three scenarios that appear likely given previous price action.
Which scenario do you think is most likely?

Gann Fan Analysis and Short Term ProjectionDXY appears to have an opportunity for upside recovery early in the next trading week if price holds above the current fan angle until today's market close.

There was no real correction since 2012 - monthly YMblack line is 200ma montly
if i use gann fan, the succession of up and down was realistic till 2012
monthly you can see that all the tries to go down were stoped before completing the gannfan
last march was a ajustment for 2016-2017, but nothing connected at 2012
so i draw my gann fan and then complete a normal triangle period over it, so IF it goes down, that bottom is a probability

LAZR Bullish BreakoutI used gan fan 8/1's as the flag support and resistance and excluded the unneeded counterparts of the fan. This use of the Gann fan recently worked out for me very well for the PLTR breakout, which shares many similarities to this particular breakout. I believe the breakout has just begun and I predict a conservative 32% ($47.49) upward move or an optimistic 75% ($73.22). Please comment with any questions or suggestions!


market structure changed buy opportunitymarket structure has ben changed due to new higher low and it can be a good entry price
put sl under the supp line


waiting for a confirmation patternwaiting for a bearish candles to sell it till the gann fan support line
we have divergence on RSI
GoodLuck

IDX: HRUM analysis Continuecheck my previous upload.
its already reach 6200.
6325 is a critical point, when it pass. you should buy and it will be fly to 6625
if not it will down to 5950 as it's strong support
have a nice trading
Disclaimer:
This information is for educational purposes and is not an investment recommendation or representative of professional expertise. This analysis used herein is for illustration purposes only. This personal opinion should not be considered specific investment advice. I am not responsible for any trades, and individuals are solely responsible for any live trades placed in their own personal accounts.


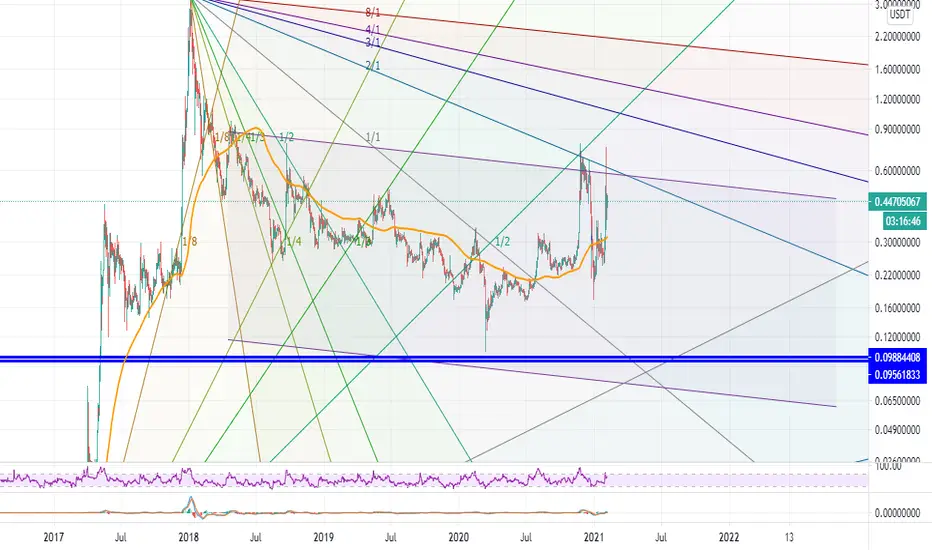
#XRP _ RESURRECTION _ orderI place a buy limit order for #XRP at
0.098
with only 1 % of my trading account.
And I won't remove it and I'm very willing to lose it regarding it's R:R ratio, in case of any unpredictable dumb
Don't forget to give this idea a like if you like it
and share it with your friends
your support is really appreciated
thanks in advance