INJ/USDTThe 4.60 support could be the start of a new rally and has the potential to reach the $ 7 rang e, with a stop loss of $ 3.85.
Gann Fan

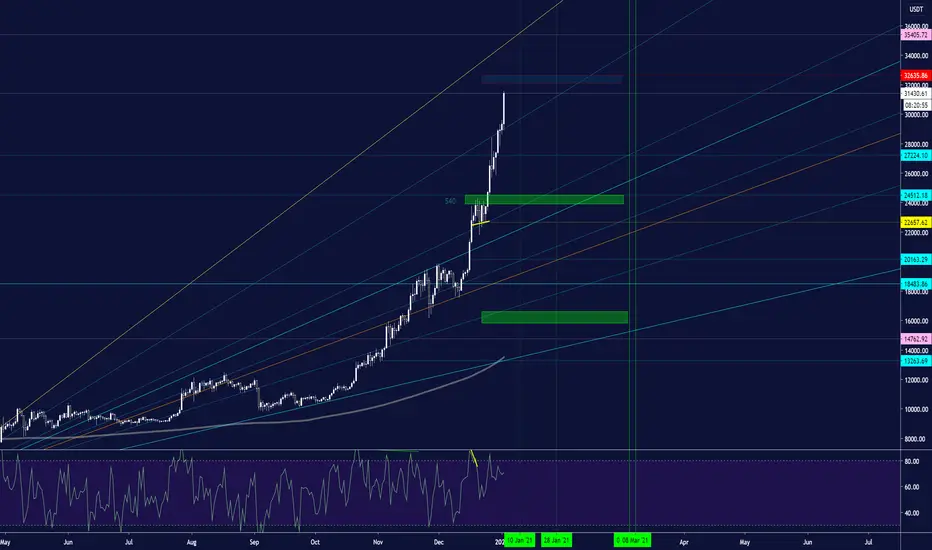
TIME FOR REST BTCLet’s wait for btc
And let’s wait for correction from the red area
It’s a cluster combination of 1.618 extended fibo and 135 angle
The buy areas determined in green color and they are a combination of fibo 0.618
And angles of gann
About the important times are determined in green color
I hope you a nice night
zec will break the descending trendline one way or another!Using fib extension targets are 80.5 and 85.5 and +++. Of course you need to keep an eye on BTC before opening any position on altcoins. I think green scenario has a higher chance (it leads to a beautiful inverse head and shoulders). I have buy orders at 64.5 and also 58.5 (futures is a bit risky now, so I will stick to spot trading! Cheers!
ps: yellow boxes are monthly and weekly pivots!


Happy Holidays and Merry Christmas!The year 2020 was a year full of problems which we tried to face in the best possible way. I wish you from the bottom of my heart a happy new year 2021 and may this year be a full year of miracles for you and your families. A good year for trading.
Happy New Year 2021 from ME !!!
ALBANIA: Vitit 2020 ishte nje vit plot probleme te cilat ne munduam ti perballonim ne menyren me te mire te mundshme ju uroj thelle nga zemra gezuar vitin e ri 2021 dhe qofte ky vit nje vit plote mrekulli per ju dhe familjet tuaj. Nje vit i mbare per tregtim.
Gezuar Vitin e Ri 2021 nga MUA !!!
ITALIAN: Il 2020 è stato un anno pieno di problemi che abbiamo cercato di affrontare nel miglior modo possibile. Ti auguro dal profondo del cuore un felice anno nuovo 2021 e che quest'anno sia un anno pieno di miracoli per te e le tue famiglie. Un buon anno per il trading.
Felice Anno Nuovo 2021
DUTCH: Het jaar 2020 was een jaar vol problemen die we op de best mogelijke manier probeerden het hoofd te bieden.Ik wens je uit de grond van mijn hart een gelukkig nieuwjaar 2021 en moge dit jaar een vol jaar van wonderen zijn voor jou en je gezinnen. Een goed handelsjaar.
Gelukkig nieuwjaar 2021

beautiful Gann Fan on Beyond Meet, WeeklyGann Fan is my thing, i like it,
sometimes everything goes wrong but when it works, its awesome
you can see all price action was included in Gann Fan here
i did a typical break out but at this point normally, the bulls are tired
you can expect momentum to be off, and see a new brearish gann fan formed
sometimes its for a short time
but still now, i think the move up is over

BTC 30k or 23k?As the price action develops and 27400 holds as support, it's likely we'll retest the ATH.
In the previous period of consolidation around 24k, we saw the ATH tested once with a small short and then again with an even bigger short, before trend continuation upwards.
We could see the same thing develop here - would be great to long the Weekly Open again but making sure to have a stop loss in place in case of a break to the downside.

We all want another shot at longing ETH from 700ETH is always at the mercy of BTC so the same idea could play out. We retest 740 again, short, retest 700 and then we either go balls deep into Alt Season to kick off 2021 or it is delayed for a couple of weeks.

Ambitious entry targets to get in on this trending move to 30kBTC posted a new all time high overnight but looks more like a rejection from previous all time high. We're seeing a small pullback and I'm setting ambitious price targets to capitalise on the pullback and get in on this trending move which should take us up to 30k.
Targeting places where Fib and Gann intersect.
Targets:
27100
26793
26636

Bearish scenario: descending trend breaks down taking us to 23kDespite defending the weekly open, the bearish scenario is highly likely to play out. We have a descending trend / triangle and these have a high probability of breaking to the downside.
Rejected from the .5 fib level.
Fundamentals - poor week for Ripple has caused fear in the market, particularly for institutions.
One of the largest ever CME gaps from 23.8k, we pumped to 28k VERY fast which will have surprised many institutions who want to buy at that level.
Pullback is natural and due.

Bulls defend BTC weekly open and push for a breakout to 30kBTC has been in a descending trend since reaching 28k but looks like it may make a breakout if we retake the .5 fib level. The weekly open has been defended thrice.

BNT/BTC (15m) Gann Fan PlanGann Fan illuminating and spreading possibilities of price movements.
It is beautiful to behold, as it does unfold.
Our friend Fibonacci no doubt would love to enter the fray, and why not?

Quick Look at CorsairI like $CRSR as a company, and they are bullish but waiting for a pullback to take a position

Bitcoin: where is the top for the price?based on historical movement of price and the previous top for price the 30000 is the potential new top for the price. Also according to 1*1 Gann angle at 45 we can expect there will be no great retracement until end of January.
What is your Idea about it?
Please comment and like if you like the idea!

CVC/USDTForming a triangular pattern, but given that the market situation is declining. It is not suitable for oscillation and I do not recommend investing.

Ridiculous XRP ChartToday, in our new series of ridiculous charts, we look at XRP.
It has come to our attention that there is an article, written by:
"a seasoned investment professional and a crypto analyst covering the blockchain space. With a dual degree in Business Administration and Creative Writing"
that addresses the possibility of XRP rising to $ 692 in 2020 (or after).
Using a Gann fan (at angle 45° !), we can see (after defining top and bottom of trend !) XRP respecting the 4/1 ratio.
Furthermore we can note that previous "bull-runs" knew an incline of 73° and 77°.
In order to get to $ 692 an incline of only 58° is needed .. so ..plausible. ($ 69.200 seems logical based on previous data)

EUR/AUD is Marching downsideHere's the 15m chart of the EUR/AUD. I have used Gann fans to make it easy to understand. Currently, it's moving downside, and it will hit the following levels 1.6086 - 1.6060 .
But if it starts to march upside, then the trend will touch the following levels 1.6146 - 1.6166 .

AMAZON What happened in the future?{GANN FAN} AnalysisHi every one
no need to say something , chart is speaking it self
Remember that Trend is our friend and we have to hold his hand and go with it .
Traders, if you liked this idea or have your opinion on it, write in the comments,We will be glad.
This is not financial advice.
Remember to do your own research and build your own plan before you trade
Thank you for seeing idea . please support us
Good luck.

Let’s give EURUSD the last warning todayThere is a big time on this pair on Monday so let’s see what will happen

XAUUSD Gold Price Technical Gann Analysis for 12/21/2020The price movement is pretty high today, and both support and resistances holds for now. My analyze is telling it is good to watch until one of supports or resistances break.
supports:
1855.69
1818.10
17.68.00
resistances:
1907.65
1964.42
Best strategy:
With news of agreement on stimulus, the price will be bullish and best place to enter the market is long in 1860.00 with tp of 1950.00 and sl of 1845.20
please write your comments below, what do you think about the analysis?


USD/JPY Day Trading Gann strategy: 12/16/2020Be prepared for a volatile session especially if Congress announces a coronavirus-aid package and the Fed comes out as dovish.
Today news is extremely important for the market.
The price is breached the fibbo level at 104.132 and headed to the November 6 main bottom at 103.177.
It is better to lower your risk.
I think we will see the new main bottom today!

AUD/USD Technical Gann Analysis for 12/16/2020According to the chart the trend is up and reaching 0.7578 will resume the uptrend. we have to wait until the stimulus agreement to counter trade and short selling.
If USD becomes weaker we can see the price at 2018 June top in 0.07677.
resistances: 0.7578 - 0.7677
supports: 0.7542 - 0.7507 - 0.7475 - 0.7458
It is better to trade with buy positions.
