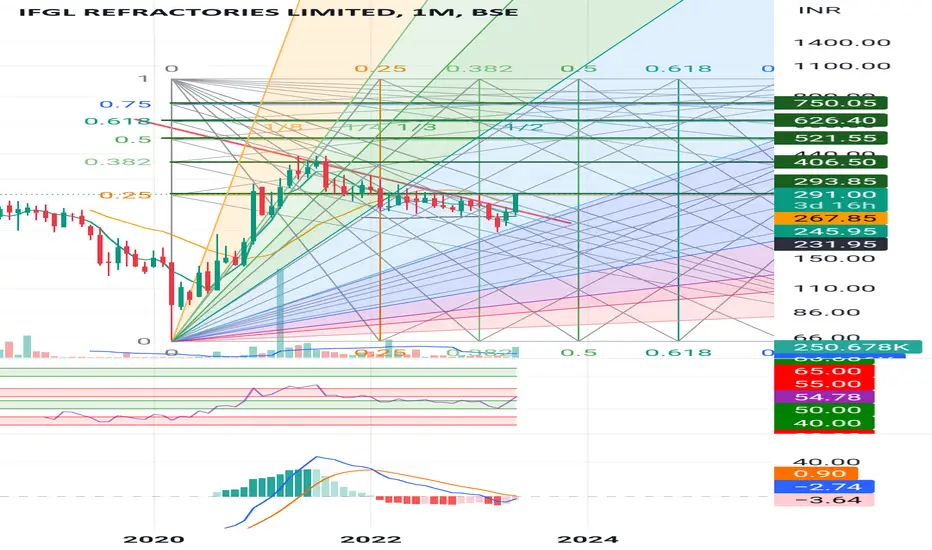
IFGL RefractoriesMonthly BO is expected after a long time where Flag pole BO is already done with good volumes and almost ready to break the Gann box levels too above 293
MACD crossover about to happen.
Gann Fann angle support has already been taken
Weekly chart already looks bullish
Gann Fan
XAUUSD 15M It is my opinion about the XAUUSD
until the price is under 1980 it will go for 1962 and 1955 and 1936 for sure if it can go above 1980 it will go for 2000 2016 targets

$VIX gearing for a return of volatility post May expirationVIX volatility has been bottoming out over the past week, hitting a 15 handle last week. It's possible we may see that again this week. But the stars have aligned here using this Gann fan to pinpoint where we'll hit through the 2/1 line on the fan likely hitting as high as $22 sometime before the end of the month as the Debt Ceiling debate heats up, banking crisis continues, Fed speak flows and markets adjust to the idea that June may not be a pause.

Shiba , technical analysis 🐶Shiba's weekly goal is 4000, currently it can go up to 1300, 1400 and then we have to see how it goes.🐶

Update $BTC ChartDaily chart for BTCUSDT
(First of all, this is my own view, that is, it is not a recommendation or advice to buy or sell.)
My way of dealing with Bitcoin lately is that I deal with it in stages, once I look at the next stage, and each stage has places of failure and confirmation.
For me, Bitcoin still targets higher areas, unless it breaks 26942.82, it fails and then forms a descending wave targeting as shown and the extension is confirmed by breaking through its current high.
Let's discuss the next step away whether the price of Bitcoin extends or not.
Is Bitcoin still targeting falling price zones?
-Yes, it still is.
Is Bitcoin currently in the lows of new highs?
-Yes, although I would rule it out very much.
That's why I said earlier that I deal with Bitcoin in stages and don't skip it until it's confirmed to the other stage.
However, Bitcoin is an outright correction both now and if the price is extended.
After an explicit correction, there may be a good period for speculation to take advantage of the rebound.
When we are sure that the retracement is speculative rally and not a continuation of the bullish wave, simply if breaking the specified areas, it is enough to continue to the next.
(Now we return to explain the chart.)
If the 25k areas are maintained, it may be positive for Bitcoin, which may continue to target higher numbers than before.
If we break it, we'll see the 20k area and then we'll see a beautiful bounce to complete the station to the more important numbers 16k areas, as shown in the chart.
The question now is, Will Bitcoin suffice at this place, or will it still fall to the next area? Although I am a supporter of the big relegation to the 9k zones, it is very possible that he formed a bottom to complete the ascent for the next bull run, but we do not deal with emotion whether he will be satisfied or not! We see that as soon as Price Action appears clear and explicit in that area and we see the factors surrounding him having had enough of landing, then we continue to ride the bullish wave with him. However, in such areas, emotion prevails over the trader, so care must be taken.
On the chart, it is clear that if the 16k area is not respected, it will fall to 9k, but there are areas that precede it, so it may be enough for any one.
Good Luck^


Gann Fans: A Tool for Predicting Price MovementWhat Is A Gann Fan?
Gann fans are a popular technical analysis tool used by traders to predict price changes by analyzing the geometric and cyclical nature of the market. The Gann fan tool consists of a series of lines called Gann angles, which are drawn at specific angles based on price-to-time moves.
The tool is different from trendlines because it moves at a uniform rate of speed. While it helps gauge the strength and direction of the trend, it does not always predict the market's exact location. However, an appropriately set-up Gann fan can provide valuable insights into the market's future price movements.
How To Set Up A Gann Fann
To set up a Gann Fan, you first need to identify the main tops and bottoms on a price chart for your chosen time frame. Once you've found these points, select the Gann Fan tool and draw it from the identified earliest bottom to the most recent main top for an uptrend or top to bottom for a downtrend.
To adjust the Gann Fan, you need to set the correct scale ratio. This can vary depending on the market you're trading in, but a common ratio is 1:1. This means that each unit on the vertical axis (price) is equal to each unit on the horizontal axis (time).
Once you've set the scale ratio, you can adjust the Gann Fan by moving the starting point or the angle of the fan. The angle should be set so that it lines up with the trend line connecting the main tops and bottoms.
For more educational content don't forget to give us a boost and a follow!


BTCUSDT Possible 3 Target Zones With High Probability Possible 3 target zones with high probability using Volume Profile, GANN FAN, Fibonacci Levels and Order Blocks
Watch for the Low Volume Node (LVN) which are areas of low liquidity where participation is low. Usually the price moves very quickly in suck areas
High Volume Node (HVN) acts like a magnet and harder to break and usually form a range or sideways trading until the price breaks above or below the POC
Darker zone are harder to break .
Good LUck

short term mask correctionin a day or two price gonna touch 4 and a half. next might be 3 something ...

#SAIL - major resistance lineNSE:SAIL
Start investing on the breakout of trendline...
GANN THEORY
let hope
INVEST ON YOUR OWN RISK

GOLD updategold update ..
We reached a strong supply area, which I expected to bounce back from previously .
And now we are approaching the end of the wave due to the overlap between the daily and weekly supply areas .
I think the price will extend to (1987\2032)
according to the trend strength indicator which still gives strength to ascension and has not yet given the will to break .
But I think that the rise will be with a tail candle, and then I expect the gold bullish wave to end .
Good Luck


BSWUSDT bottom spottedPretty obvious for me to go in.
1. We have fib channel multiple tops
2. We have breakout at gann fan to middle part which indicates correction start
3. RSI trend channel already started uptrend movement with current stop loss killer is another signal to buy
Similar predictions / strategy:


Just another viewPossibility wise sensex may have completed wave 2today at 61.8% of previous fall. And conincidently that came on 55th bar. So untill and unless today's high is crossed, sab becho aur nikal jao.
And lastly I'm not a sebi registered analyst. Toh risk v apna apna aur Ishq v apna.

Flag Pattern of GALAUSDTThe Gala chart is a flagged pattern It is likely that the chart will continue to decline after completing the flag.

EUR/NZD UPTREND for Feb 06EURNZD is moving in the Ascending channel based on Gann Fan for 2 HR should able to achieve a TP of 1.71450 by tomorrow

XRP - GEO 2023Geometry
Vibrational Law
Future projection
where could XRP take us in the near future? these degree lines project out from 3 - 45 degrees into the future from prev low

What's Next Move For GOLD!Gold bounced from a strong sell and resistance area ..
Where I see that the price is moving to the desired or specified area.
and until then we will update.

Bitcoin weekly chart goes bullish! 2023 and beyond...For the first time since March 2022, Bitcoin has moved into the bullish zone on the RSI
honestly, a year ago it was not long in this zone but its still a marker, never the less
who knows if the bottom is in but looks good for now with current moves toward higher prices
very good move but unsure how long it can sustain with correction, certainly time to set you stop losses if bought in recently

BNBUSD 14 JANUARY 2023 1030hrsHit a more selling in that previous supply zone (zoom out and its clear as day). Exactly what you would expect. The CO is taking profits (Sell high, buy low). The CO is a bot. A state of the art, industrial level, multi-million dollar trading bot. He doesnt need to eat, sleep. use the bathroom. He never complains and he doesnt care about anyones politics. The CO is here to win and take every last penny of the impatient retail trader.
Waiting to see hpw far it comes down so we can get in a bargain prices before the next up move.
