LTCUSD | 9D | HARMONIC GANN WHEEL To retrace a bit IMO, but it may resume higher highs until 156$ level is reached. enjoy!
Cheers,
Keops
Gann Square

longI think it is a good time to long (buy) AUDCAD .
Targets are Fibo levels 38, 50 , and finally 61 fibo.
stop loss is a closing daily candle below .92460

THE Power of combining Gann Square math & Andrews Median LineTHE Power of combining Gann Square math & Andrews Median Line studies gives one a clearer picture of what is happening in any market.
NB: Rule #1 : Price will tend to return to the Median line 80% of the time.
This alone by charting for about 2 mins give us a 80% trade probability. No need to spend hours pouring over data.
It works on anything on any timescale.


Is Crypto ready for the next BULL RUN? Ethereum seems to be!It seems ETH could be in the early stage of a bull run. As you can see in this chart, ETH could be forming a giant ADAM & EVE pattern with a potential to test ATH by sometime in December of this year.

USDCHF - Potential Reversal -Short Term SELL & Long Term BUYUSDCHF is looking towards short term SELL and Potential Reversal with Strong BUY Signal


Broad market analysis FX Indices Commodities Crypto. 09 May 2019I was thinking... They say "be specialized in only 1 market", but how does that work? Everything matters and there are correlations everywhere. Be specialized in 1 strategy sure, but what better way to do this than have a global view on everything?
I like it this way. People that only focus on 2 - 3 symbols can look at everything but really go in detail with their 2-3, but why not go all the way. And specialized in 1-2 strategies.
- Indices -
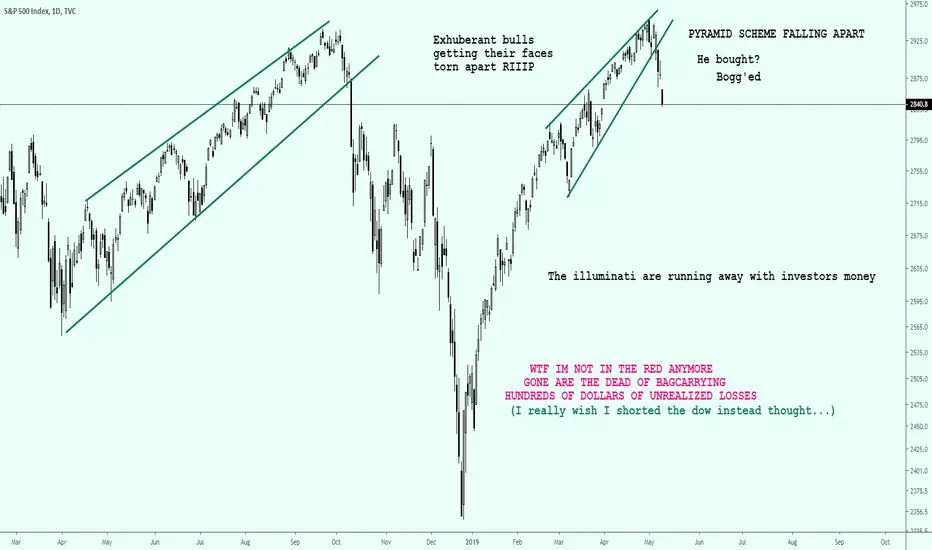
Moderators of the SnP & DowJones pump and dump group (Trump Powell & XiTrolliPing) have reached their target & now sent a sell signal.
Of course, they have not told anyone their target. Several people have asked Trump on twitter to just tweet his target, but he is not going to.
Investors should not panic, but I would definitely call it time to be preparing to panic.
- FX Majors -
The Yen has started rallying. Something is happening!
USDCHF rally is over. Sucker's rally. Watching for bear break then buying the bear sucker rally.
USDMXN to the MOON! Waiting a pullbacl to buy.
EURJPY bearish
- Commodities -
Gold either is consolidating or made a higher low? Nothing to do.
Oil tightening, waiting for that bear break soon, and buying at the target pattern more or less.
Soybean futures I bought that multi year low. We shall see. I am thinking it's 50/50 odds but RR is between 1.5 and 2.
Copper made a lower low. Might "capitulate" soon. Waiting on that full (bull trend) retrace.
- Crypto -
Bitcoin wow what a great transition. It has not reached resistance yet but it is close. Maybe overcut a little...
Posted an idea about scaling in early because crypto traders take profit early. Will they now overcut the overcut?
Alts... They are all consolidating (well not all thousands of them but in general). Not interested.
- FX Minors -
Nothing very interesting and there is already alot going on elsewhere.
Got stopped on GBPAUD but it is trolling me hehe. Might re-enter...
Summary: MY HEART! EVERYTHING IS MOVING AT THE SAME TIME. TRUMP PONZI STOPPED GOING UP TRADE WARS UNCERTAINTY STOPPED. SO INVESTORS ARE MOVING MONEY NOW.
To watch:
All Indices
Yen (USDJPY bearish)
USDCHF possible bear break
USDMXN TO THE MOON
EURJPY bear trend
Gold & Oil & Copper there is time.
Soybeans entered the trade, hope it bounces now :p
Bitcoin short, might as well overcut that resistance. I think 6300 is good.
GBPAUD re-buy, re get rekt.


Is it possible that the SPX might just hit 1535?
In my opinion this is a very good possibility. We might just be in the early stages of a recession and the market is letting us know that it is not liking what it sees coming.
Lots of investors have been overlooking all the bad data and indicators. But to tell you the truth, this does not surprise me at all, considering they did the same exact thing right before the 2008 crash.
I see a lot of volatility in the market in the next few months to come, with a potential crash sometime during the end of the summer and beginning of fall.
Let’s hope that I am wrong for the sake of the middle class!
Crypto is where I will be putting my money


Hewlett Packard Enterprise Horizontal purple lines above 18,58 are your targets / potential tops.
I don't advice to buy for the long term until we see a good uptrend above 18.58.
The vertical lines represent an expectation of a change in trend, a pivot high/low or start of a new bull market.
Q4 2020 is going to be very interesting.

A clear break out of the parallel channel, doom loomsThis Gann Square has consistently been accurate throughout this entire correction, as I've previously stated. There has been a clear break out of the parallel channel that has contained price movement for the past two weeks. The final curve of my Gann square still holds, as you can see. But, I still believe there will be a severe break downwards, if not today or tomorrow, some time in the future.
My guess, is this month. But that is only a guess, and a test of my eye.
Like and follow me for daily updates for BTC. Thanks for reading.


FETUSDT BUY OPPORTUNITYBUY ZONE: 0.3750 - 0.3850
Targets:
First: 0.4060
Second: 0.4385
Third: 0.4722
Fourth: 0.5072

Bullish Harami candle...possible reversal ?> BARAKAH reach resistant level
> Bullish Harami candle
> Price momentum area 50%

EURUSD by GannSegún Gann, al EURUSD aún le falta bajar al key level señalado.
Esperar a confirmación de un patrón envolvente confirmatorio a un cruce de medias.


XLM buy/sell setup 50% profit in 50days (Rebuy of old bags)This is not a financial advice but Educational self explanatory TA builded for BITTREX:XLMBTC on:
Hidden Technical Indicators showing extended bull divergence across more timeframes
Price action/volume supports
Gann square
(+BONUS) Entry setup separation & Target Points supported by fractal visualization
** 1st entry (Green Zone) initiated in TA added in Related Ideas
*** More updates & Explanation will come for this TA if it will hit at least 25 likes
Original Entry 376 Satoshi ( Keep hitting play button :)
Visualization of previous trade (Sell 4-6K Satoshi)

SPX | 108D | KING PUMPLow volume, high spot in the sky. mmmm... and plus the slicer! something has to give. Will be playable only on Jun 1st 2019.
Cheers,
Keops

CND/BTC; La zone d'accumulation - Potential profit; 162% / 2533%My Targets:
0.000002772
0.000007255 (162%)
0.00001646 (501%)
0.00002725
0.00002772
0.00004036
0.00005838
0.00006860
0.00007255 (2533%)
0.00007422
0.0001646
0.0002725
0.0002772
0.0004036
0.0005838
0.0006860
0.0007255
0.0007422
0.001646
0.002725
0.004036
0.005838
0.006860
0.007422

