Going to form a Bearish Flat?
Just speculation.
This chart seems to respect Gann Box, Gann Square, and Arcs as depicted.
If so, Gann 1 x 1 would exhibit a significant resistance at the 17400-17700 level.
If so, an Elliott wave theory's Bearish (expanded) flat could form.
Again, this is just speculation- for a more orthodox analysis, see my previous ideas linked below.
Hate comments won't be welcomed but will be immediately reported.
Gann Square

WD Gann - Square of 9 - BTCUSDApplying one method from WD Gann's "Square of 9" toolkit.
Find a range low and run this calculation to get the range high:
```
( sqrt(range low) * 2 ) ^ 2 = range high price
```
Find a range high and run this calculation to get the range low:
```
( sqrt(range high) / 2 ) ^ 2 = range low price
```
This chart has 4 example of this in action. Black, green, red, purple.
Calling it right now that 15800 (red) and 18600 (purple) are our "range low" relative to BTC's all time high.

Bearish Speculation: Short from here, or from 17600?
I have presented some ideas where this downtrend is interpreted as Elliott's triple zigzag (WXYXZ) (see also links below).
So let's continue the speculation.
If the Z wave of it is now developing, it would have, by definition, a three-wave zigzag structure (WXY as presented, but ABC also possible) comprising 3-3-3 waves.
No wonder this chart begins to decline from here onward, but if BTC shows at least some strength the next week, an ideal double top setup will be complete (bullish scenario excluded from consideration here).
For H & S's right shoulder (or a symmetrical triangle), if FE 1.786-2.000 is the target zone (FVG agrees with it), and if we confirm a smaller double top at around 17600, it would be another ideal setup for the bearish progressive wave (here an impulse, 12345).
This scenario is nothing more than a speculation, but it is theoretically clean and would support my WXYXZ hypothesis.
I have not mentioned Gann Square, but its presence would be self-explanatory (if you hate it, please ignore it. This idea isn't affected by removing it).
Pitchfork is also for reference (based on the hypothetical downward impulse).
Just so you know, I premised the Z wave as WXY, not ABC- because this could, in my opinion, develop into WXYXZ where the actual bottom is below 12500 (possibly 9500-7500?).

Bearish Speculation: Short from here, or 17600? (Clean version)
This is a clean version where Pitchfork is removed.
For details, please look at the idea I've included below.
For some people, this could still be nothing more than a messy chart.
So if you think, "where on earth could this chart be clean?" please don't say it...

BTC Gann starb6a6a Gann star from walmart
Intersection of Gann fan usually come with unusual price action and potential seperation to upside
buystops 17635 right off angel 120
as long as price trading above 16250 and see action to upside within 5days

Corrective wave scenario
This is supplementary/alternative to my previous idea.
Examining the internal waves of my presupposed "impulse," I realized some counts might mismatch Elliott's Law.
Instead, this move may form a corrective wave, e.g., complex correction (WXYXZ, Gray) or Diagonal Triangle (ABCDE, red; could be longer if with a thrust).
The chart would be self-explanatory, but the Triangle annotation is shifted for visibility.
In either scenario, the retracement in the fourth (corrective) wave is deeper than that of the impulse.
Downtrend did resume, and what's next?
The chart would be self-explanatory.
Here we are rebounding from FE 0.886.
I marked 1.000 and 1.114, respecting the H & S.
This article is tagged as "short," but beware of possible extensive upside moves. Better be cautious until the candle crosses down the arcs' crosspoint (at least in a lower timeframe).
By the way, this is an update for my most notorious chart.
While my previous analysis has astonishingly been trolled, the chart didn't take care of what they felt-
Like it or not, this is the fact.

Weekly candle to close red suggesting trend continuation
Gann Square, the built-in smart tool of TradingView, is provided with many fans and arcs. Every single one of them, if properly plotted, is considered to serve as S & R. Not to mention their crosspoints.
In this chart, I applied it so that only the strong movements (progressive waves in the E.W. Theory) in the trend direction penetrate the arcs and the crosspoints.
So if the weekly candle closes red, the arc resistance is confirmed together with the trendlines, making any upside to mark HH more difficult (implying a continued downtrend).
Let's check this scenario.
Although this is not textbook theory but my empirical analysis, the light-green shaded zones act as resistance zones like the Ichimoku cloud.
Considered in conjunction with the low of 17600, we would see a large or small rebound there.
However, a move beyond 25k, especially over 28k, within one or two weeks is almost unlikely, given the overhead crosspoints and the likely continued macro downtrend.
Gan Fan 1 x1 (thick black) may serve as support. Watch 16500 if 17600 support is lost.

Bullish or Bearish: Watch Clitical Support Level of 18700
With the crypto exchange's asset liquidation plan flowing as FUD, the BTC chart, which looked strong, looks fragile.
Technically, a Bullish Dragon (green)' s TP (21700) has almost been (but has yet) reached, and BTC is on the path to test the support of another giant Dragon (blue).
Dragon patterns (often simply wedges), large or small, bullish or bearish, their theoretically cleanest target is a Fibonacci retracement level of 0.786.
So let's look at the red, bearish dragon's FR 0.786, where several supports converge. It's around 18700.
If BTC is on the bullish path, but a further correction is needed, we would likely see a rebound at around 18700 (green trendlines), and a bullish Elliot progressive wave (green 12345) will follow.
On the other hand, if the price breaks down through the critical support level of around 18700, we would witness a massive decline reopening the downtrend (red 12345).
If the market turns out to be bearish, my immediate previous idea will be invalidated.
This analysis should be neutral, but I see corrections in a bullish path. So this is tagged "short."
Note: Gann Square and arcs are for reference. If you dislike it, you can ignore it. Criticism for Gann Square isn't welcome in the comment area.

BTC Possible Middle Term Scenario (Rev)
Some errors and issues in precision are addressed.
No change in fundamental concepts.
The bear market shouldn't have been over, but we are likely in a relief rally if the price rises above the threshold of around (21600-) 21800.
Beware of still possible correction before the bullish move after the breakout.
Long until December, and maybe short (in January) at the 33k-34k zone.
If the market is more bearish, the downtrend could resume at 28k-29k.
I changed my view because the bullish dragon in the related idea now seems to have been in action.
The chart and annotation would be self-explanatory: the keys are harmonic patterns and Fibonacci.
To those who hate Gann Square and arcs: Ignore them, or ignore this idea. It's simple. Think twice before you post anything in the comment area.

BTC Possible Middle Term Scenario
The bear market shouldn't have been over, but we are likely in a relief rally if the price rises above the threshold of around (21600-) 21800.
Beware of still possible correction before the actual bullish move.
Long until December, and maybe short (in January) at 33.5k-34k.
If the market is more bearish, the downtrend could resume at 28k-29k.
I changed my view because the bullish dragon in the related idea now seems to have been active.
The chart and annotation would be self-explanatory: the keys are harmonic patterns and Fibonacci.
To those who hate Gann Square and arcs: Ignore them, or ignore this idea. It's simple. Think twice before you post anything in the comment area.

My Weekly Analysis 50 Pt. 1*sorry for the early cut off I didn't realize how much time I had left*
I go through my currency pairs and analyze them while listening to music and talk to you guys.
*not a financial advisor*

CBOT Wheat Futures (ZW1!) with Sq Root Levels and AnglesCBOT Weekly Wheat Futures (ZW1!) with √ 2 + 2 support, resistance, and angles. Note square out turning points.

Tesla, Inc. (TSLA) with Sq. Root Support, Resistance, and AnglesTesla, Inc. (TSLA) Daily with √ 2 support, resistance, and angles.

BTC: Watch 18460 if it breaks below the bottom of pennant
As we predicted, the bearish dragon pattern (red) is unfolding to pull the price down to approx. FR 0.786, almost the bottom of the pennant (gray).
If it breaks, what's the next target?
Because Gann Square works well, we could focus on its crucial component - two Gann Fans 1 X 1 (blue).
Interestingly, the crosspoint of the two Gann Fans coincides with the FR 1.272 level of the bearish dragon.
If you look at the left side of the chart, this horizontal, 18460, will be conscious initially.
But, because so many things overlap, no wonder it serves as significant support before the price reaches the current market low of 17600 at a continued downfall.

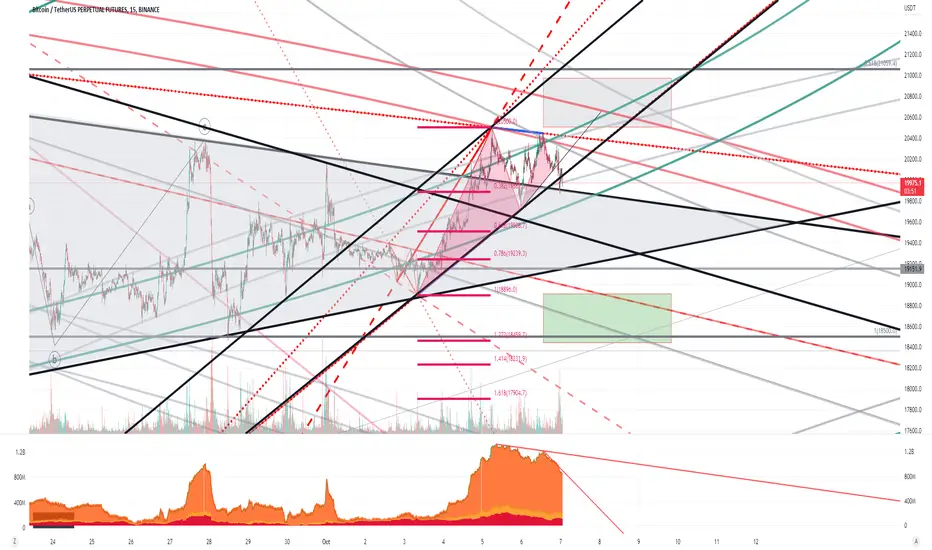
BTC Bearish Dragon Pattern Unfolding
On top of what could be a relief rally or a tentative bull run, a Bearish Dragon Pattern is unfolding, with active OI in Binance rapidly decreasing (indicator pane).
Typical TP is FR 0.786, but if it breaks the channel and re-enters the pennant this time, I'd like to point out the possibility of passing down through it to reach, e.g., 1.272.
The green ark would serve as a support.
The scenario is invalidated if the top of the dragon (approx. 20500 ) is broken.
See the related ideas for details of the scenario, the lines, arcs, etc.

BTC at the intersection
This is just a sketch.
BTC is at the intersection of the arcs. It seems it's confined within.
As always, meaningful moves would be after CES a couple of hours later.
If the Gann Square works as expected, the more straightforward direction for BTC to go is down.
In addition, the bearish dragon pattern of my previous idea hasn't unfolded completely.
I have been bearish (at least) since it fell from 25k, so I am shorting as always.
What would you see?

Two Bearish Scenarios
This is supplementary to my previous idea.
If you don't like Gann Square and Arcs, ignore them, or skip this article.
But how about the case where this upside was merely a fake out of the pennant?
In the previous idea, I introduced a bearish scenario with an Elliott-wise impulsive movement.
Considering the arc S&R, or the overall diagonal movement, it could also develop in a triple zigzag way (WXYXZ).
I didn't examine a diagonal triangle scenario because it doesn't well fit the art S & R, but it could also be possible.
On the other side, wave E of the triangle wave can extend to mark a new high. A robust bullish movement from here may invalidate all my bearish scenarios.
Still, theoretically, these scenarios aren't invalidated until the previous high (22850) is broken (though I would close my short position if it went far beyond 21200).
Regarding the support, whether approx. 19750 and 19150 lines hold or not would be the judgment (19750 once having been attacked).

btc longs vs. btc shorts on Bitfinex I squared the chart added fib circles. based off this idea, today October 3rd could be a major pivot point, either longs take control and break above resistance or the bears are back in action, pulling the price downwards.

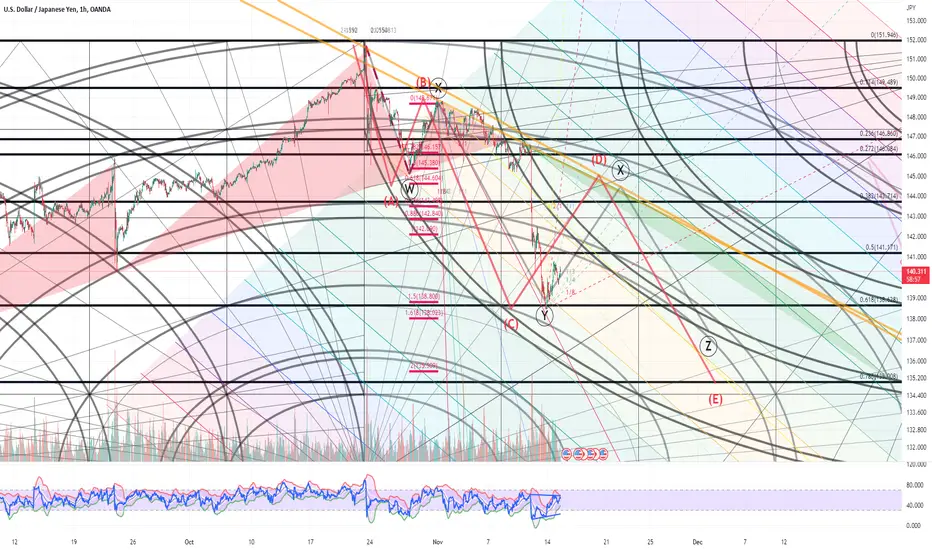
DXY [Weekly] The sign of weakness began to appear on the dollar index with the look of wave analysis . and by classical analysis we are on a strong resistance - channel upper band - so we are waiting for the landing .

One idea for BTC Elliott wave count (revised)Wave counts corrected.
The uppermost W wave begins with a zigzag whose first part is a diagonal triangle with a thrust, followed by wave X adjacent to wave Y, which is also counted as a triangle.
The whole structure can be counted as a diagonal triangle ABCDE instead of the triple zigzag WXYXZ, in which case a thrust will likely appear at the end of wave E.
Just an idea. Including revisions on previous ideas.
WXYXZ: Elliot triple combo waves (e.g., a triple zigzag )
WXY: Elliot double combo waves (e.g., a double zigzag )
Basic principle:
If a wave is a zigzag, it comprises three waves decomposed as 5-3-5.
If WXY or WXYXZ is a zigzag , W, Y, and Z are each a zigzag .
W, Y, and Z waves can each be a double or triple zigzag .
X wave can be any corrective wave.
Notes:
A complex corrective wave often comprises fractal complex corrective structures.
A triangle RARELY appears in the second wave of an orthodox impulse.
A triangle prevents an equal-sized reversal pattern (a double top, a head-and-shoulders) from forming until it completes.
If a HORIZONTAL triangle seems to have an extended E wave, it should instead be counted as a three-wave structure.
Truncation is not considered in this count.
Gann Square placement is just an idea. Please don't blame me for the number of components.
I applied it this time so X waves or minor corrective movements don't penetrate the arcs.
Warning:
This is just an idea. Another counting would be possible. I don't insist this is the only correct answer.
Before posting meaningless comments (e.g., "so many lines!") or groundless criticism (e.g., "no way!"), or any insulting comments, check your knowledge for counterarguments and read THE ABOVE, relevant textbooks for definitions of any theories and tutorials for the built-in tools.
Any inappropriate posts will be immediately reported.

One idea for BTC Elliott wave count (revised)
Just an idea. Including revisions on previous ideas.
WXYXZ: Elliot triple combo waves (ex. a triple zigzag)
WXY: Elliot double combo waves (ex. a double zigzag)
Basic principle:
If a wave is a zigzag, it comprises three waves decomposed as 5-3-5.
If WXY or WXYXZ is a zigzag, W, Y, and Z are each a zigzag.
W, Y, and Z waves can each be a double or triple zigzag.
X wave can be any corrective wave.
Notes:
A complex corrective wave often comprises fractal complex corrective structures.
A triangle RARELY appears in the second wave of an orthodox impulse.
A triangle prevents an equal-sized reversal pattern (a double top, a head-and-shoulders) from forming until it completes.
If a HORIZONTAL triangle seems to have an extended E wave, it should instead be counted as a three-wave structure.
Truncation is not considered in this count.
Gann Square placement is just an idea. Please don't blame me for the number of components.
I applied it this time so X waves don't penetrate the arcs.
Warning:
This is just an idea. Another counting would be possible. I don't insist this is the only correct answer.
Before posting meaningless comments (e.g., "so many lines!") or groundless criticism (e.g., "no way!"), or any insulting comments, check your knowledge for counterarguments and read THE ABOVE, relevant textbooks for definitions of any theories and tutorials for the built-in tools.
Any inappropriate posts will be immediately reported.
