SPX Gap Fill Play!SPX has 2 gaps on the daily chart. One gap occurred June 10, 2022 and the other on June 13, 2022.
On June 15, 2022 SPX closed the day with a spinning top.
My plan is to take SPX to the upside after it breaks 3838.51. However, should it break below 3722.08, I will take it to the downside. I have an alert set at 3838.51 with the expectation of a gap fill to approximately 3900.
Please reference the screenshots of the SPX daily chart below.
*This is not financial advice.
Peace,
MrALtrades00
Gap

BTC unfilled gaps#BTC1!
$BTC filled the lowest gap between $26650 and $23685. and reached the support zone.
now #BTC have 2 gaps above the nearest is between $27355 and $28920, that if price hold this support zone, then bulls will head up to fill these gaps.

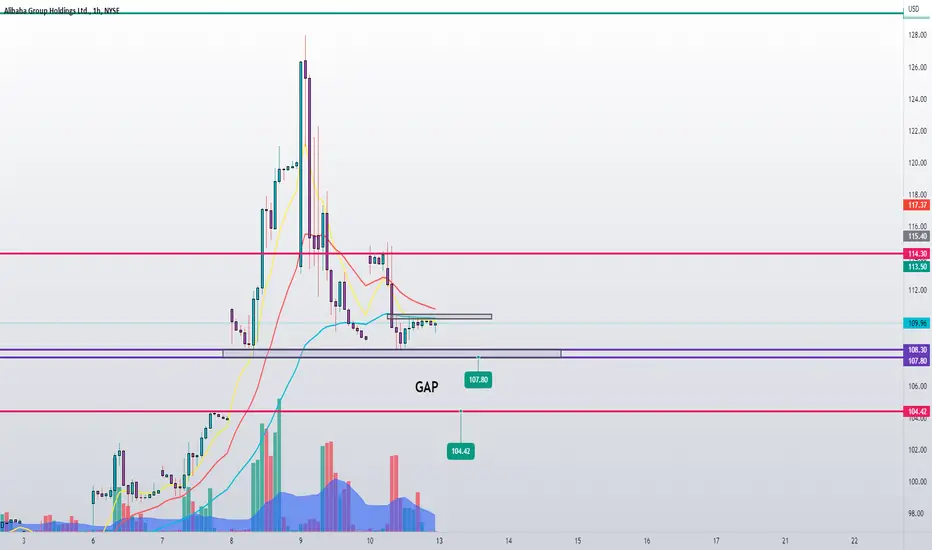
BABA GapNice gap play opportunity.
Nice and strong support at 108.30 / 107.80 . If we lose that support, there is a change price will accelerate to the downside to fill this gap towards 104.42
$GPS ~ Looks as if the correction continues...As shown, the wave 2 has pushed through the 61.8 and is now headed to the 78.6. Would expect the correction continues and will need to track closely.


3 gaps that have not been filledIn the btc cme future chart I found three gaps that have not been filled yet. Given the current situation, I imagine a green scenario for the price.

AAPL: Doing exactly as expected. What's next?Hello traders and investors! Let’s see how AAPL is doing today! It did exactly what we expected it would, since our last analysis. Now we must update our thoughts.
First, in the 1h chart, it did what it was supposed to do, and it dropped to the $ 144 area to fill the gap (blue square). Since this gap was around the 38.2% Fibonacci’s Retracement, the price found support there, and now it is bouncing back up. For us, this is not a surprise, as I already detailed this movement in my last analysis (link below this post, if you are curious), but the recent movement has some interesting implications.
Despite the congestion, we still see an open gap at $ 150, and this could help the price to retest its previous resistance at $ 151. Meanwhile, any correction to the $ 144 is ok, but again, if we lose this point, then any possible bullish thesis will be frustrated for now.
In the daily chart, we are still bearish, doing lower highs/lows and below the 21 ema. However, if we break the 21 ema again, AAPL will have decent chances of retesting the $ 151 again. Now, this alone is not a bullish reversal, but if we actually break the $ 151, then we’ll see a bullish pivot point.
If AAPL triggers this pivot point, by doing a higher high/low, it’ll reverse the bear trend in the daily chart, and in this scenario, we could think about the gap at $ 174 (red dashed line).
But we must wait for better signs, as for now, it is still a bear trend with low volume. I’ll keep you guys updated on this, so remember to follow me to keep in touch with my daily analyses.

NVDA: Doing as we planned! How to proceed from here?Hello traders and investors! Since my last update, NVDA is doing exactly as expected. Let’s see what to expect from here.
First, in the 1h chart, NVDA broke our line at $ 182.90, and it kept going up, as the momentum was clearly bullish. Since then, it seems NVDA lost its strength, but as long as we stay above the $ 182, it won’t reverse and turn bearish again.
The 21 ema is flat, and this means congestion. In my view, this is a sideways correction, before it resumes the next bullish leg, but the confirmation would only come after the breakout of the $ 196 area (upper black line).
In the daily chart, we are still bullish, as NVDA is above the 21 ema (which is ascending now), and we are above the $ 182. In the daily chart, we understand better why this purple line is so important.
The $ 182 worked as a support and resistance multiple times since April. Clearly, this is an important price level. In addition to this, it was the break point of this Double Bottom chart pattern, a reversal pattern. I mentioned this pattern in my last analysis, and the link to it is below this post, as usual.
The $ 204 is the first resistance to work with. I still believe we’ll fill all the previous gaps and hit the $ 258 again, but this is going to take a while. For now, let’s pay attention to the $ 182 area (the most important key point) and the $ 196 resistance.
I’ll keep you guys updated, so remember to follow me to keep in touch with my daily analyses!

AMD: You should pay attention to these KEY POINTS!Hello traders and investors! My last analysis on AMD was on April 27, but my previous reading was very accurate, as it respected our key points very well (link to my previous analysis below this post, as usual). Now, we must update a few things.
First, in the 1h chart, AMD reversed the trend, as we expected, and even when the volatility increased, it couldn’t lose the blue line at $ 84.24, which was our most important support level (the daily chart will show it better).
Now it seems AMD is doing a pullback to the previous support level around $ 104, which worked as a resistance two times recently, and now it is working as a support. This is the Principle of Polarity in Technical Analysis. Only if it loses this support we would see AMD dropping more. The next support is the black line at $ 99, which is an interesting point that we’ll talk about later.
For now, all we can assume is that since it is a bull trend, AMD will seek higher levels, even considering it’ll do pullbacks along the way. Remember: Trends persist until a clear reversal occurs (Dow Theory).
Remember the $ 84.24, the most important support? Here we see that AMD did a Double Bottom chart pattern just above this price level. In addition to this, if you zoom out, you’ll realize that this support dates back to July 2021. In order to trigger a long-term bear market on AMD, we must lose this line, and this won’t be easy.
For now, AMD is clearly bullish, doing higher highs/lows, heading to the target I mentioned in ym last analysis, when we were below $ 90: The Gap at $ 118. Meanwhile, pullbacks are acceptable, and would be just opportunities to buy. The 21 ema is a good support level to work with in the daily chart, and coincidence or not, it is at $ 99 right now (remember the black line I mentioned in the 1h chart?).
Let’s keep our eyes open, as AMD is near its key points right now. Maybe it’ll give another buy soon, if it reacts near any of its support levels. What could ruin the bullish bias? If it does a clear reversal sign, and if it loses its 21 ema in the daily chart.
I’ll keep you guys updated, so, remember to follow me to keep in touch with my daily analyses!

Ethereum ETH - CME gap close not unlikelyEthereum ETH - CME gap close not unlikely (see green boxes)
The bottom of this gap correlates with the highest volume on the day before the gap
Specifically $1.757 would be the target for this gap close
What do you think dear Crypto Nation? 😎
Drop me a nice comment
*not financial advice
do your own research before investing

Queen Bee & the Gap. Path to TargetThis has been trading nicely and I wanted to post a most likely path to target from here:
** Initial Target 47 by July 15, 2022
If you're playing the options you might be interested in how it will get to 47. There are a few factors at play here from a technical perspective that make the probability of success here very high.
- I don't use bollinger bands often but they have their utility for gauging explosive breakouts from narrow ranges, and for continuation plays (BMBL is the latter)
- The purple downtrend lines represent resistance (solid = has yet to be tested/broken, dashed = recently broken)
- The black rectangular boxes are price consolidation zones around critical levels, the 9 day sma is used here as a timing mechanism, and the RSI is useful for gauging the strength of the momentum
- the horizontal red dashed line is something I call a capitulation zone (defined by a run of consecutive (>=5) red bars, highlighted oval); the orange dotted line is the gap boundaries
Back in March there was a failed break of resistance due to momentum not being strong enough - my interpretation is lack of quality of share ownership at the time AKA weak hands. The technical signal that this was going to drop from there was RSI cross bearish and the 9 day ma falling out of the consolidation zone.
Following this failure to breakout there was a capitulation period where those weak hands were taken out aggressively. In May the price exited the cap zone under new ownership (strong hands) and the risk of selling pressure on next breakout attempt was reduced significantly. It formed a new consolidation zone right around the downtrend resistance and broke out when the 9 day moving average exited the top of the consolidation zone (RSI was also in good form).
Now BMBL can ride support up to test the next downtrend resistance just below the gap. The path I drew in is what I am expecting to see in the price action (i.e. price will be in the next consolidation zone around June 17 and attempt to repeat what happened on the recent breakout). This time it will need to have the volatility going into the consolidation zone to put buying pressure on both the overhead resistance and the gap - otherwise its out of the frying pan and into the fire... BMBL has this based on the bollinger. What I want to see is RSI (purple) and its moving average (yellow) get tangled up above 70 - that is a true sign of strength (don't mistake that for oversold, it actually needs that kind of momentum to truly breakout and fill that gap).
Based on time series model that I adjusted for the expected intermittent consolidation period, my time to initial target of 47 is by July 15.
I am personally in the July 15 35.00 calls, but this ain't financial advice. Also, I say "initial target" because I will have to re-assess based on how it trades around the gap. Long term I think this goes a lot higher.
Best,
George Sand

BTC1! gap at 35kThe recent strong downtrend as produces a small gap on the CME at 35.3k. Price has reached range support and the technicals are pulling out of oversold. The possibility of a relief rally to close the gap is there.
39.6k is a point of confluent resistances and can be a final target. The price might falter at any time and head to close the big gap at 23.8k.

Gap:Bargain buy despite gapping down!Gap
Short Term - We look to Buy at 8.08 (stop at 5.20)
This stock has recently been in the news headlines. They reported an earnings surprise miss. We are trading at oversold extremes. A move lower faces tough support and we remain cautious on downside potential. Dip buying offers good risk/reward.
Our profit targets will be 15.00 and 17.50
Resistance: 15.00 / 17.50 / 25.00
Support: 7.50 / 5.26 / 2.50
Please be advised that the information presented on TradingView is provided to Vantage (‘Vantage Global Limited’, ‘we’) by a third-party provider (‘Signal Centre’) . Please be reminded that you are solely responsible for the trading decisions on your account. There is a very high degree of risk involved in trading. Any information and/or content is intended entirely for research, educational and informational purposes only and does not constitute investment or consultation advice or investment strategy. The information is not tailored to the investment needs of any specific person and therefore does not involve a consideration of any of the investment objectives, financial situation or needs of any viewer that may receive it. Kindly also note that past performance is not a reliable indicator of future results. Actual results may differ materially from those anticipated in forward-looking or past performance statements. We assume no liability as to the accuracy or completeness of any of the information and/or content provided herein and the Company cannot be held responsible for any omission, mistake nor for any loss or damage including without limitation to any loss of profit which may arise from reliance on any information supplied by Signal Centre.

NVDA: Bullish thesis with 40% upside potential (complete MTFA)!Hello traders and investors! Let’s see how NVDA is doing today! To me, NVDA is one of the stocks with the highest potential, if everything works out, of course. Let’s do a complete Multiple Time Frame Analysis (MTFA) on it today.
First, in the 1h chart, it finally broke the $ 168 area (black line), which was a support and resistance multiple times in the past. By breaking this line, and by leaving the 21 ema behind, NVDA triggers a short-term reversal, at least to the $ 182, which is the single most important key point on NVDA to me.
Let’s see the daily chart now:
The trend didn’t reverse here yet, but given how the 1h chart looks, it could reverse soon. First, we would need to break the 21 ema, and second and most important, the $ 182 area.
By breaking the $ 182, NVDA will trigger a Double Bottom chart pattern, a bullish reversal chart pattern in the daily chart. What’s more, the $ 182 was a support level in April. And it is working as a resistance for NVDA right now in May. The fact the polarity changed at this price level indicates that it is an important key point, indeed.
If NVDA triggers this pattern, it has an immediate target at $ 204, but I see NVDA filling the last two gaps in the long-term. Meaning, it could hit the $ 258 in the next few months – roughly 40% upside. This is why NVDA is one of the most promising stocks I see around. So far, NVDA always filled the gaps that appeared above the price (when it gaps down), so historically/statistically speaking, you could build a bullish thesis on this fact alone, with a high probability of success - however, only TA can help us with our timing.
In the weekly chart, this reaction is occurring at a very interesting support level, which is April 2021 top. This could confirm a bottom for NVDA in the long-term, which reinforces our bullish thesis.
This reaction on NVDA looks great, and we see a confluence on multiple time frames indicating a possible reversal. For now, let’s just pay attention to the $ 182 area, as this is the key point for us. I’ll keep you guys updated on this, so, remember to follow me to keep in touch with my future analyses!
* This is my personal view, based on technical analysis, price action, statistical analysis and historical data. Not investment advice.

AMZN: A $ 500 REVERSAL ahead? Let's see.Hello traders and investors! Let’s see how AMZN is doing today!
Like many other stocks, AMZN is trying to reverse. After finding a bottom around the $ 2,048 (blue line), AMZN bounced and it dropped again to this line, making this a possible Double Bottom chart pattern. This is a powerful reversal pattern, and usually it works very well, when triggered.
In this case, AMZN must break the $ 2,316 (red line) in order to trigger the reversal pattern. The red line is the last resistance, and it is quite close to the 21 ema, which is another technical resistance that AMZN must break, otherwise, the bear trend will just persist.
If AMZN triggers a reversal, we have two possible targets to work with, in the mid-term. First would be the $ 2,707 area, which was a previous support level, and it could be a resistance in the future, according to the Principle of Polarity. Second, and my favorite one, is the gap at $ 2,806, which I do believe will be filled, eventually.
In the weekly chart, we see that the possible Double Bottom chart pattern in the daily chart couldn’t have a better timing. AMZN just hit a very curious technical support level, which is the February 2020 top level, before the crash.
In addition to this, AMZN is reacting nicely. So far, we see two Hammers candlestick patterns, with long shadows under the candlestick’s bodies, indicating some strength in this area.
For now, let’s wait for a clear reversal, as AMZN could fly roughly $ 500 (or 20%) if we do trigger the reversal we want. I’ll keep you guys updated on this, so remember to follow me to keep in touch with my daily analyses!

SPX: Triggered a REVERSAL! What's the TARGET?Hello traders and investors! Let’s see how the SPX is doing today! It is doing exactly what we were waiting for since my last post (link below).
Yesterday we triggered the reversal pattern we’ve been waiting for, by breaking the 3,979, now we are just seeking our next target at the 4,090 area, and the gap around 4,075 will probably help us here. Remember, gaps work as magnets.
Since it is a bull trend in the short-term, any pullback to the 21 ema or to the 3,979 again would be just an opportunity to buy. However, if it drops too much and loses the 3,900 it might ruin the bullish structure. Lets see how the daily chart is doing:
In the daily chart, we broke the purple trend line we’ve been mentioning, and as we discussed in our previous analyses, by breaking this line, the index is putting an end to the bearish bias in the daily chart. However, unlike in the 1h chart, the trend is not bullish yet!
In order to do a clear reversal, the index must break the 21 ema, and most important of all, break the 4,090 (red line). This will trigger a mid-term reversal pattern called Double Bottom chart pattern that could lead us to the 4,500 again.
As usual, there's a problem. I would just like to see a higher volume. This is not enough to ruin our bullish thesis, but it is something to keep in mind.
The index is finally bullish in the 1h chart, and this may trigger a reversal in the daily chart as well. Our next target is 4,090, for now. I do daily analyses on the SPX, so if you want to keep in touch with my thoughts, just remember to follow me to not miss any of my future analyses.

SPX: Almost REVERSING! Watch these key points for now!Hello traders and investors! Let’s see how the SPX is doing today!
Again, the 3,979 worked as a resistance, and this is not a surprise at all. We've been talking about the 3,979 since last week, and we know that as long as the index stays under this price, it can’t do a decent reversal. The link to my previous analysis is below this post, as usual.
At least, the index filled the last gap, making it an Exhaustion Gap, which is a sign of a reversal ahead, but again, in my view, we still must break the 3,979, as this will trigger a Pivot Point in the 1h chart.
Another interesting thing is that we are trying to break the purple trend line in the daily chart, and this will surely put an end to the bearish bias. This alone is not enough for a bullish reversal, but by adding the other signs we have (Exhaustion Gap and possible Pivot Point in the 1h chart), we can build a nice bullish thesis.
If the price finds a resistance at this purple line, and loses today’s low, we could drop again to the 3,858 (previous support).
By breaking the 3,979, I see the index retesting the area around the 21 ema and the 4,090 in the daily chart, in the short-term. By breaking the 4,090, it’ll trigger a Double Bottom chart pattern in the daily chart, a mid-term reversal, that could take the SPX to the 4,500 again.
I do daily analysis on the SPX, so remember to follow me to keep in touch with my insights!

NQ Power Range Report with FIB Ext - 5/25/2022 SessionCME_MINI:NQM2022
- PR High: 11856.50
- PR Low: 11809.75
- NZ Spread: 258.50
Evening Stats (As of 12:05 AM)
- Weekend Gap: = +0.23% (filled)
- Session Open ATR: 443.19
- Volume: 33k
- Open Int: 251k
- Trend Grade: Bear
- From ATH: -29.5% (Rounded)
! Hovering over -30% from ATHs. Tuesday's gap unfilled !
Key Levels (Rounded - Think of these as ranges)
- Long: 14105
- Mid: 12960
- Short: 11800
Keep in mind this is not speculation or a prediction. Only a report of the Power Range with Fib extensions for target hunting. Do your DD! You determine your risk tolerance. You are fully capable of making your own decisions.

SPX: Still BEARISH, but these patterns could REVERSE the trend!Hello traders and investors! Let’s see how the SPX is doing today!
Yesterday’s reaction was quite good, but as we thought, not enough to trigger a real reversal. We pointed to the 3,979 (black line) as the main resistance to break, and not surprisingly, this point was yesterday’s high multiple times before it melted today. The link to my previous analysis is below this post, as usual.
As long as the index remains under the 3,979, it won’t trigger a proper reversal sign, in the short-term. If it breaks the 3,979, it’ll probably fill the last two gaps and hit the 4,090, another important key point, as we’ll see next.
In the daily chart, we are still under our purple trend line, so the trend is still bearish. If we break this line, we might see something new, but only the breakout of the 4,090 would trigger a mid-term reversal in the daily chart, as this is the breakpoint of a (possible) Double Bottom chart pattern.
If the index triggers this Double Bottom, the 4,500 would be our next stop, but for now, we have many challenges to overcome: The 3,979, the purple trend line, and the 21 ema in the hourly and daily charts. Right now, I'm neutral on the index, but if it reacts properly, it could be a buy again. Only time will tell.
Since we are near a support level, we must pay attention to these key points this week. I’ll keep you guys updated every day on this, so remember to follow me to keep in touch with my future analyses!

Gaps get filled!2AM EURUSD opened with a Gap.
Often times when this happens price fills that gap quickly.
Price is falling to fill the gap.
When you're able to catch these plays it's a lot of fun!

AAPL: About to reverse? Let's see...Hello traders and investors! Let’s see how AAPL is doing today!
First, we see a very strong reaction, breaking the 21 ema along with the previous resistance at $ 140. This seems to be a V-shape recovery, just as the SPX is doing.
This is a good indicator, and this could be the beginning of a reversal on AAPL, but we must see more confirmation signs around. A pullback to the 21 ema is expected, and even desirable, but if it drops too much it could ruin the bullish reaction. Personally, I see AAPL filling the last gap (yellow square) and retesting the previous resistance at $ 149, but the situation is still delicate.
In the daily chart, the timing of this reaction was perfect, as we just hit the support level at $ 138. The $ 149 area we mentioned above is near the 21 ema as well, reinforcing that AAPL could easily bounce back up to this price in the next few days.
If this will be a dead cat bounce or not, we’ll see when we get there. However, if we break the $ 149, AAPL would trigger a double bottom chart pattern, and this could take us to higher levels, maybe to fill the gap at $ 174 (yellow area).
For now, we must wait for more signs, but this week looks promising for AAPL. I’ll keep you guys updated on this, so remember to follow me to keep in touch with my daily analyses!

GPS Bulls Vs BearsOn the chart there are distinct observable bear and bull phases (which I have labelled)
The currently displayed two bull and bear phases are roughly the same lengths in time
Currently, we are moving into another bull phase for GPS, as it climbs out of the 1.618 fib

SPX: In a neutral zone! But for how long?Hello traders and investors! Let’s see how the SPX is doing today!
First, it crashed a lot yesterday, losing the 21 ema, frustrating any possible bullish reaction. Right now, we don’t see any reversal sign, and there’s nothing indicating that the index could recover from here. However, it is not all bad.
If the SPX keeps dropping, we have a support at 3,858, but I’m not sure if it’ll get there, as it seems it is reacting already. Only if the index loses this support we would see a continuation of this bear trend.
On the other hand, it is under its 21 ema and under the 3,979 (previous support level). As long as it stays under this price level, we can’t say the index could recover. If we see a clear bullish reversal structure around, in my view, we could break the 21 ema and bounce up to the 4,100, filling at least the two last gaps. Again, there’s nothing indicating this could help.
To me, we are in a neutral zone, and there’s nothing interesting going on here.
In the daily chart, we see that the index is still in a clear bear trend, near its support level, far from the 21 ema, and the volume is very low.
This reinforces our idea that we are in a neutral zone, and nothing interesting will happen until it breaks either its support or resistance levels mentioned when we studied the 1h chart.
I’ll keep you guys updated on this, so remember to follow me to keep in touch with my future analyses!
