TME huge gapTME seems to found his support. Godd time to slowly buy in.
Watch the price action and buy step by step.
I expect we can fill the gap over the bigger time frame.
Gap

SPX: Once again, did what was expected.Hello traders and investors! Let’s see how the S&P is doing this Friday.
The signs are good, and the index is bullish for sure. Today it triggered the Piercing Line pattern we talked about yesterday, and it reinforces our bullish thesis.
It wasn’t only a Piercing Line pattern, but a pattern that appeared just above our dual-support level made by the purple trendline and the gap area at $ 4,369 (red line).
The index is looking good, and we have no pullback/reversal sign around. Let’s see the 1h chart:
We triggered the pivot point at $ 4,418, and we are once again above the 21 ema. The index has an open gap at $ 4,471 and the odds are that we’ll fill this gap in the short-term.
As long as we lack bullish structures in the 1h/D charts, nothing unusual will happen, and the trend will persist.
If you’ve read this far, remember to follow me to keep in touch with my daily updates. Have a good weekend!

GPS LONG to $40-50 (1% from my deposit)Fundamentally the company reported on making a profit!
We are in the strong support lvl
If I did correct correction wave ABC, we can't go lower the 1st wave high top.
I go 1% from my deposit on LONG

SPX: Did what we expected! Next key points.Hello traders and investors! Yes, the index hit our target at the purple trendline in the daily chart, after it lost the support levels we mentioned yesterday. My previous analysis is public, and the link to it is below.
What’s interesting is that it not only hit the purple line, but the index also filled its gap at 4,369.87 (red line, yellow square), again, with an impressive precision.
Naturally, today’s candlestick is bullish so far, as it won’t be easy for the index to lose this dual-support level. Aside from today’s bullish candlestick, we lack other bullish structures in other time-frames, but we have some key points to pay attention:
In the 1h chart, the pivot point at 4,418.61 is the main key point for the short-term, as if the index defeats it, we’ll see the bearish momentum getting weaker, and it might even reverse. The gap would be the first target for us.
However, I agree that the reaction on the SPX so far is good, or at least it is a good start for a reversal. The only thing that could ruin it is the support at 4,369.87, as if the index loses it, the bearish bias will persist for a while.
If you liked this analysis, remember to follow me to keep in touch with my daily updates.
Have a good day.

SPX: Should we be worried about it?Hello traders and investors! Let’s see how the SPX is doing today, and I’ll update the next key points we must keep an eye on from now.
As we can see, the 1h chart is pretty messed up. We did a new record high two days ago, and then the index crashed, did a Breakaway Gap and it lost the support at $ 4,437. Now we are retesting the 21 ema as a resistance, and the moment is very delicate.
If the 21 ema holds the price, and it loses the previous bottom, we’ll do a sharper pullback in the daily chart.
However, let’s remember that the trend is very bullish, and despite the volatility, yesterday we just dropped to hit the 21 ema (with astonishing precision, btw), something we had to do, since the last retest of it one month ago.
Yesterday’s movement was natural, and not an indicator of a new crash or anything like that. If you aim for the mid-term, just keep an eye on the 4,430 and the 21 ema in the daily chart, as if the SPX loses these points, the purple trendline is the new target. As long as we don't see a bearish structure around, there's nothing to be worried.
For now, let’s watch how it’ll behave in the 1h chart, as we just hit the 21 ema there. If you are still here and not a follower, I invite you to follow me to keep in touch with my daily updates.
Have a good day.

TrendyTrades: HD Bullish AnalysisIf we can hold and close above 319.80, we should be able to see a push back up with a gap fill.

TSLA: Crashing today! Next key points to watch from here.Hello traders and investors! Let’s see how TSLA is doing today!
We lost the support at the gap area around $ 687, and today we lost yesterday’s low, a sign of weakness. What’s more, TSLA triggered a bearish pivot point in the 1h chart, indicating a bearish reversal sign for the short-term.
This bearish momentum might last for a while, and as long as we don’t see any clear reversal sign, TSLA will just seek its next support level.
However, it is interesting to notice that TSLA did two gaps, as evidenced by the yellow squares. Both gaps are Breakaway Gaps , and this movement reminds me of PLTR. Just check PLTR’s chart below:
I see TSLA doing a similar movement PLTR did a few weeks ago. Since TSLA has many support levels to work with, it still has good chances of filling at least the last the last Breakaway Gap in the next few days/weeks. Nevertheless, this doesn’t mean TSLA won’t drop. As I said, we have no bullish reaction so far , and the area between $ 627 - $ 621 is the next support level for us to work with.
In the daily chart, we see why the $ 627 - $ 621 is a good support level for us, as it was previous support. What’s more, TSLA failed in reacting around the 21 ema, and this ruined the bullish bias. On the bright side, we lack bearish structure in the daily chart, meaning that this is more like a crash, rather than actually a sell-off.
Yes, TSLA has more room to drop in the short-term, but if it does a good reaction quickly, it might be a good opportunity.
If you liked this analysis, remember to follow me to keep in touch with my daily updates.
Have a good day.

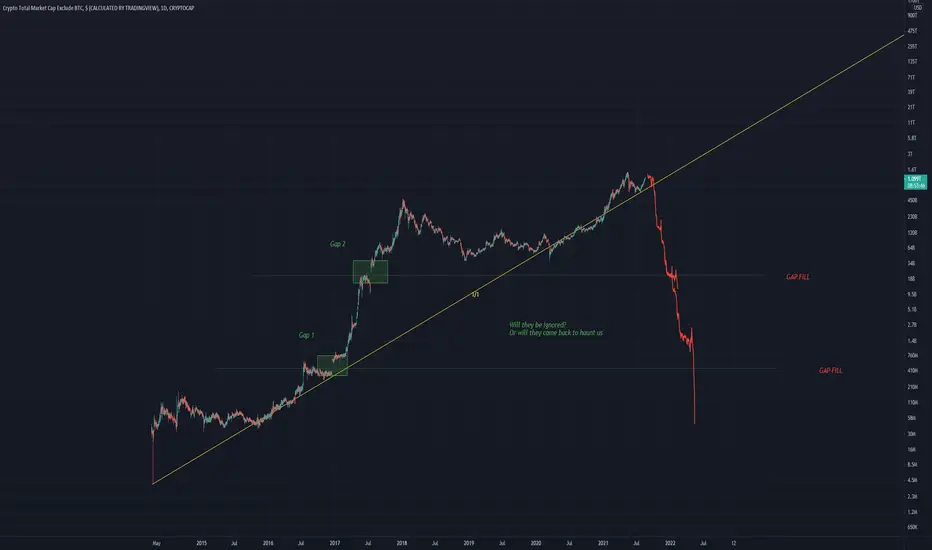
TOTALMCAP GapsWill the gaps be filled in the future with a massive bubble pop?
Or will they remain unfilled
Time will tell
Elliott Wave Analysis: BTC Futures Approaching GAP ResistanceHello Crypto traders!
Today we decided to take a look on BTC Futures chart, mainly because of its open GAP in MAY, which can now act as a strong resistance area.
Well, as you can see, BTC made five waves down from the highs, which in Elliott Wave theory indicates a change in the trend. After every five waves, a three-wave pullback follows and as you can see, BTC can be now unfolding and finishing a three-wave A-B-C correction. Wave C is a motive wave and it should be completed by a five-wave cycle that can ideally stop in the golden 50%-61,8% Fibonacci retracement, from where we should be aware of a reversal down, probably once May's GAP is filled.
What we want to say is that Crypto market is generally in the strong resistance zone, testing June highs, so be very careful in upcoming days, because a reversal down may occur anytime soon, maybe already during the weekend.
Be humble and trade smart!
If you like what we do, then please like and share our idea!
Disclosure: Please be informed that information we provide is NOT a trading recommendation or investment advice. All of our work is for educational purposes only.

PLTR Gap Fill after bear flag trapPLTR escaped a bear flag pattern, and a new short term pattern formed a bull pennant. Looking for an upward breakout to fill a gap at $26.40

SOFI gap down SOFI gapped down to what seems to be a well respected support area. Longing commons as there's no time-frame for options.

FE Daily SetupNYSE:FE daily trade setup:
Entry above Friday's high at 38.84
Profit target 42.29
Stop Loss under Friday's low at 38.15
Risk/Reward ratio of 5

PLTR: Complete Multiple Time Frame Analysis after Earnings!Hello traders and investors! Today PLTR reported its earnings, and the volatility increased, as expected. There are some key points we can use, and we’ll talk about them in this complete Multi Time Frame Analysis (MTFA) .
First, now it is too late to buy. The time to buy was during the Ignition Bar evidenced in the 1h chart, which was a classic bullish candlestick pattern, just above the support at the purple trendline.
What’s more, PLTR just filled the first Breakaway Gap , which was my first target since the analysis I did on July 20, “PLTR: A very Technical Bullish Thesis”, which is public, and the link to it is below this post. If you buy now, it feels like you’ll buy from someone who bought at the Ignition Bar down there, and will use you to book profits. Always try to buy from who’s panicking, not with the herd.
If I were out, I would wait for the Risk/Reward ratio to make sense again, probably after a correction, near a support level. This wouldn’t change the bullish bias seen on PLTR, as I still believe we’ll seek the next gap at $ 26.32. The daily chart reinforces the bullish thesis:
The daily chart suggests that we can seek the $ 27.47. We just defeated the 38.2% Fibonacci’s Retracement , which worked as a resistance at least 2 times (Jul 12 and Aug 10). We also defeated the 21 ema, and the situation is clearly bullish. It would be good if it corrects again, but we can’t count on that.
It is interesting to notice that PLTR has been doing many good and technical movements. The bottom seen last month was just a pullback to the 61.8% Fibonacci’s Retracement, and it did a perfect Piercing Line candlestick pattern on Jul 19.
However, I have one more key point for you, and this time it is in the weekly chart:
Although the $ 27.47 is the target in the daily chart, this is a bullish pivot point in the weekly chart . If triggered, PLTR has a good chance of retesting its All-Time High again.
To sum up, if you aim for the short-term, you have an opportunity to book profits now, as we just hit the first target in the 1h chart. If you aim for the mid-term, the $ 27.47 is the target for you. In a longer-term perspective, if PLTR triggers the pivot point in the weekly chart, the $ 45 is where you should aim.
In addition, if you still don’t follow me, I invite you to do so ! I write daily analysis here on Tradingview, and I’m sure you’ll find something interesting around.
Take care, my friends!

TSLA: Trading PENNANTS - Strategies and scenarios to work with.Hello traders and investors! Let’s see how TSLA is doing today!
We see that the stock is trapped inside a classic Pennant pattern , and the $ 700 is its support level. Pennant patterns are continuation patterns (most of the time), and the odds are that we’ll see an upwards breakout.
Regardless of what TSLA will do next, we can set strategies for this pennant. If we break it downwards, the gap at $ 687 is the first target to work with. This point is close to the 21 ema in the daily chart, which we’ll look at next.
In the daily chart we have the confirmation of our two support levels. The $ 700 (pennant’s bottom) is also July’s top , making it a powerful price level. In addition, the 21 ema reinforces the next support at $ 687. If Tesla loses the $ 700, probably it’ll seek the 21 ema in the future.
However, what if TSLA does an upward breakout from this pennant? Probably the gap at $ 732.61 will be filled and TSLA will head to the next resistance at $ 780 . Above this target we have the $ 821, but let’s work with the $ 780 first.
This seems to be a classic pennant pattern, and the decrease of the volume confirms the idea, and this is how we identify a Pennant pattern properly. We had a similar pattern in the weekly chart in Nov 2020.
Even BTC did a pennant when it was below $ 10k, before it exploded:
And the list goes on. All of them share the same price and volume pattern. Let’s remember that the smaller the time frame, higher are the chances of failure. Pennants are a continuation pattern, but this is not a rule.
Let’s see what Tesla will do next, and regardless of what happens, we have strategies for it.
If you liked this analysis, remember to follow me to keep in touch with my daily updates.
Have a good day.

MSFT: Trend analysis and possible scenarios (according to TA).Hello traders and investors! Let’s see how MSFT is doing today, and what our dear Technical Analysis (TA) has to say about it.
It seems it is having a hard time recently, as the bullish momentum got weaker, but the trend is not bearish at all. So far, we have a congestion that resembles an Ascending Triangle chart pattern, as evidenced by the ascending bottoms (purple line) and the resistance at $ 289 area.
Since MSFT is near all-time high levels, naturally it has many support levels to work with. As long as it keeps above the purple trendline, good, the short-term trend won’t turn bearish. But if we lose the purple line, we might fill the gap at $ 281.
In the daily chart, we have a possible Double Top pattern, which wasn’t triggered, and the 21 ema at $ 284 is another support to hold MSFT.
The volume has been low recently, indicating that we have no sell-off, and this congestion is just a harmless sideways movement.
The technical target for this Double Top is the $ 274.45 , which is the worst-case scenario for MSFT in the mid-term.
Let’s watch the purple trendline in the 1h chart first, as it’ll dictate the short-term trend, and we can work the mid-term trend from there.
If you liked this analysis, remember to follow me to keep in touch with my daily studies.
Have a good day.


PINS - oversold and close to a profit?gapped down on earnings and beaten down
due for a bounce, especially if prospects are good on fundamentals

Gong down to fill gap on the 30 min chartTarget to fill $15 to $15.30 gap for confirmation to go long or short.

Possible Ascending Triangle FormingPossible ascending triangle forming on PYPL and currently sitting right on its 100-day EMA at the moment. Keeping an eye on PYPL here for a long-term entry. RSI is in the oversold range on almost every timeframe and has a big gap to fill on the upside after selling off after earnings. Will be looking for a breakout (broader market conditions permitting) Bullish - just some support and resistance levels to keep an eye on as well as some RSI based supply and demand zones

AAPL: You must be aware of these KEY POINTS!Hello traders and investors! Let’s see how AAPL is doing today!
Since it lost the purple trendline , the bull trend in the 1h chart got weaker, and now it seems we have another congestion.
The price is dancing around the 21 ema, and it seems it is moving erratically. However, let’s remember that this is just a sideways correction , seen in the daily chart as well, and it is natural that AAPL will move like this.
This congestion is just a sideways correction to the 21 ema in the daily chart. Sometimes the price drops to the 21 ema (price correction), but sometimes the price moves sideways and the 21 ema hit catches up with the price (time correction). Usually, time corrections are good, as they indicate strength.
The volume is low, and it seems AAPL is about to find itself in a Trap Zone : Between the resistance at $ 149.78 and the ascending 21 ema, which is a support. As the time passes, the 21 ema will squeeze more the price, and at one point, it’ll explode – we just can’t tell to which direction it’ll explode.
Either way, the $ 141.44 is a support for AAPL, but if it loses its momentum for good, it can drop even more.
I see the Fibonacci’s Retracements in the weekly chart as targets if AAPL engages a bearish momentum. The first support is at $ 139, but I would be happier to see AAPL at $ 136, which is near the 50% retracement, the support at the black line (previous top), and the 21 ema in the weekly chart.
Let’s follow AAPL closely from now, and if you liked this analysis, remember to follow me to keep in touch with my daily updates.
Have a good day.

PYPL - another chasing the 200dmaanother one below 200dma, could make a move as it consolidates up to 200. My charts are noob but hey I'm trying

MA - looking for breakout of gap zonewatching for confirmation w/ short EMAs crossing long EMAs and bullish action above key levels (purple lines) to push out of the gap zone, first PT 390, 395, 401

Mind the Gap: HOODThe Robinhood NASDAQ:HOOD IPO continues to be an interesting stock to watch. After holding the 50% Retracement it failed to make a new high. Now is it breaking the retest and near the close today is testing the gap open from yesterday.
The big brain play is to short meme stocks like this... but how? Shorting shares carries unlimited risk and buying Puts burns capital as volatility and time decay. In my Livestream tomorrow 4pm Eastern (at the market close) I'll look at a few strategies traders can use to bet on the hype failing and capture the FOMO pain gains.
