PLTR: How to proceed and what's next for it?Hello traders and investors! Let’s see how PLTR is doing, and if it has been moving according to the technique and to what we discussed last week!
First, yes, as we already figured out, this is an annoying congestion , indeed, and the support level at the blue line ($ 22.84) has been holding the price quite well, at least until now.
But that’s ok, as this congestion at least broke the bearish bias seen from March 15 – 30. We talked about all these points in previous analyses, which you may find the links below in this post, if you are curious.
Now, if PLTR loses this blue line, then probably it’ll fill the gap (yellow area) and hit the $ 22.06, then we must wait to see how it’ll react there. Otherwise, if it defeats the green line at $ 24.45 again, then PLTR will probably reverse the trend to bullish in the daily chart:
The green line is a pivot point , and PLTR would also break the 21 ema as well. There are good chances that it will hit the $ 22.06 again, but if it reacts and triggers this pivot point, then PLTR will have everything to fly again.
The volume increased recently, which is something to notice. If we see a correction on the Nasdaq Index, hardly PLTR will fly right now, so, keep in mind that this stock might test our nerves in the next few days, before it can give us any interesting sign.
Remember to follow me if you liked this analysis and to support this idea with your like ! Let’s follow PLTR closely from now on!
Thank you very much. Have a great week!
Gap

🔹 $NUAN 4H Technical Analysis🔸 Ascending Triangle + Gap PT 47.88
🔸 Microsoft in Talks to Buy AI Firm Nuance Communications
🔸 Day Trade: Long Above 46 PT 46.50. Ascending Triangle Breakout Scalp Price Target on the wick.
🔸 Swing Trade: Entry @ 46. 2-3 Weeks to play the gap fill, price target 47.88.

BTC1! CME gaps are memesPrice action on the CME chart is in ascending triangle currently heading to close the gap at 55.2k which corresponds to the support of the ascending triangle.
If ascending triangle support is broke the measured move will send price to 38K which coincidently correspond to a CME gap.
Orange boxes on the chart are closed CME gaps and the blue ones are still open.

SHOP S&R Strong Bid Off Swing LowShop dropped all the way to 1006.21 when the market plunged in March. Since correcting 32% from its all time high, SHOP has been strong as the tech led rally continues. Its earnings are coming up this month and it has showed strength throughout April. It is also trading right above its January range which should serve as a strong support.

HOG Divergence + GapHOG gap from $40 to $35, waiting for this to be filled. Divergence Feb. 2nd - Feb. 5th, a possible sign of a short term bullish run that will fill the gap.
Target buy-in at previous support of $32.50.
Take profit at $40-$42.

SOS Entering The Gap Up ZoneNoticed these trendlines that I drew on the 15 Minute chart matched up to the Daily chart perfectly. There is a pattern of gapping up in this zone of price discovery. Highlighted most notable gap up days from this zone.
Would love your thoughts.

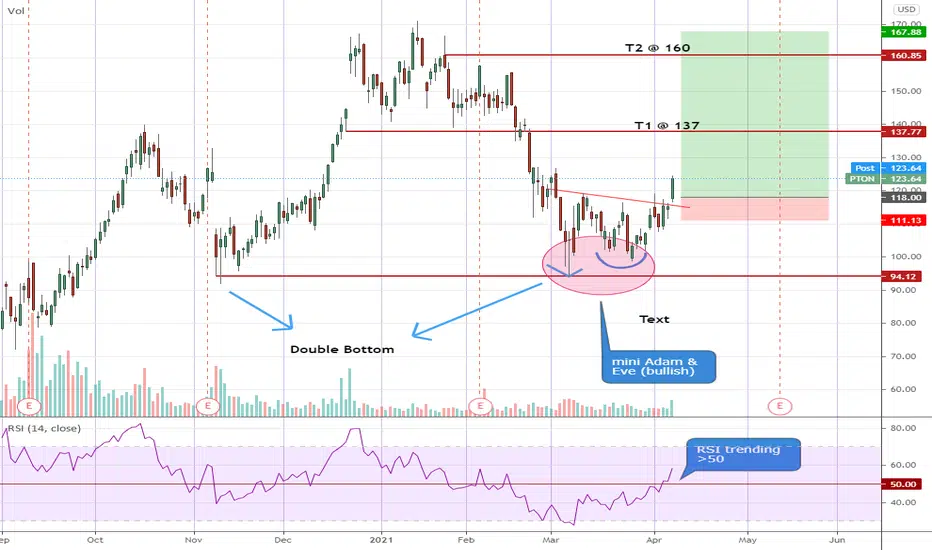
PTON - More upsidePTON established a strong support at 94 after forming a double bottom there on 5th March. It rose for only 2 days before losing momentum for the next few weeks when it slowly became apparent that a mini Adam and Eve bullish pattern was forming.
Today it gapped above the Adam & Eve neckline with RSI rising strongly >50 at the same time. For those who have yet to hop on board early today, it could be trickly to rush in now unless price could retrace a little over the next few days. I wwould put intial stop loss below neckline @ 111. Be mindful of earnings release expected on 12 May.
Disclaimer: This is just my own analysis and opinion for discussion and is not a trade advice. Kindly do your own due diligence and trade according to your own risk tolerance. Thank you. Feel free to give me your thoughts ! :)
TSLA: Will it fly again? Only if it breaks this resistance!Hello traders and investors! Let’s see how Tesla is doing today!
First, in the 1h chart, we see that Tesla is engaged in a bull trend , as it is doing higher highs/lows since the end of the last month. The recent drop could be seen just as a pullback, and to be honest, Tesla could’ve dropped to the black line at $ 659.50, filling the gap at the yellow area, and this wouldn’t ruin the bull trend.
Today, we have a good reaction, and this could be the beginning of something new for the stock, as evidenced in the daily chart below:
In the daily chart, the trend is still bearish , but Tesla is tying very hard to reverse it. Today, Tesla is doing a Harami candlestick pattern (so far, it could close differently), and we have a pivot point at the blue line ($ 708.16). I would focus more on the $ 718 area , as this point seems to be more relevant. If defeated, then the trend will be officially bullish in the daily chart as well.
In the last two days, the volume decreased while Tesla was doing its pullback, which is a good sign. But still, given how the Nasdaq is looking, I find it very hard for Tesla to break its resistance at $ 718 this week. We might see some sideways movement next, before Tesla performs anything good next week.
We have reasons to be optimistic on Tesla, yes, but hardly things will be as easy as we want. And since you made it this far, remember to follow me to keep in touch with my daily studies, and please, support this idea if it helped you!
Thank you very much!


XL Long Breakaway GAP and huge volume
MACD Divergence
OBV Breakout double bottom
Williams %R crossed -80
Entry 9.3
Stop 7
Target 23
I am not a PRO trader. I trade option to test my trading plan with small cost.
The max Risk of each plan is less than 1% of my account.
If you like this idea, please use SIM/Demo account to try it.

$BYOC TP targets for the move up #BYOCChart looking fantastic. If a pullback at open tomm comes it would be a solid entry, but the chart has allot of upside ahead

AUDUSD AUDCAD EURAUD GBPAUD : VERY IMPORTANT MOVEFX:AUDUSD
Hello traders. My eyes this week is on the Aussie's pairs, Why???
Okay, first Aussie dollar index is about to confirm a Head & Shoulders reversal pattern in the daily chart.
And what caught my attention, is the beautiful floating Island at the top what tells us to be ready for a trend reversal.
Traders, get ready for this move and stay tuned and make sure to follow us for updates. 🔥

ZOM: The strongest historical support level!Hello traders and investors! Let’s talk about ZOM today!
Well, we have a very strong support level around this black line at $ 1.48, and it is not by chance. This support level is the most important key point to keep our eyes on in the next few days, and the relevance of this support is better seen from the daily perspective.
But before we see the daily chart, it is important to notice that ZOM hit this support level several times, but we are still in a short-term bear trend, and there’s no reversal sign ahead.
Now, the daily chart:
Yes, the $ 1.48 is a key point since January, as it was a previous top level, and we have a gap there as well.
There’s no reaction in the daily chart as well, but it is hard to imagine ZOM doing anything interesting with the volume so low as it is right now. Meaning, although we don’t have any bullish sign for a reversal, I can’t be convinced by a breakout from such an important support level with low volume.
All of this tells me that now is the time to wait on ZOM, as if we see any bullish structure around, it could be a great excuse to buy ZOM at a nice price, with a good Risk/Reward ratio. The optimal target would be the $ 2.90 area, but we have minor resistances that could work as targets as well.
If you want to keep in touch with my daily analyses, remember to follow me ! And please, support this idea if you liked it!
Thank you very much!

WYNN Long In uptrend, SMA50 as support
Support line confirmation
Breakaway Gap
Entry 127
Stop 120
Target 150
I am not a PRO trader. I trade option to test my trading plan with small cost.
The max Risk of each plan is less than 1% of my account.
If you like this idea, please use SIM/Demo account to try it.

BTC - Do you think that flash crash was a test ?BTC - Do you think that flash crash was a test ?
If you did not notice there was a little flash crash today.
I have seen these little test crashes before the big crashes like someone is testing a system.
Maybe they were trying to smash it today and the good Goldman Sachs news ate up the dip or it was a test or signal of things to come.
If these big funds are buying BTC in bulk they must do it everyday which keeps a even stable pressure on the price.
BUT
If they stopped buying for a day or so, like over a holiday weekend, like this weekend the sellers of the current high price who bought bitcoin last March at bargain basement prices could sell it today for a major profit and pay the lower long term capital gains rate.
Now consider that APRIL 1st is April fools day.
It also will allow the funds to buy cheaper bitcoin when they come back from the Easter break as they are putting it on their purchasing schedules so they sell it to their clients once Goldman and others allow their customers to buy BTC.
I will post the BTC monthly chart below and you will see we have had 6 months in a row of green candles.
This has not happened for many many years, there usually is a red monthly candle in there somewhere, and we have yet to see one.
Personally I would love to buy BTC for under 50K one last time.
This is not financial advice it is more of a conspiracy theory than a sound financial plan.
Enjoy your long weekend people.
I will be adjusting my Altcoin buys to a much lower price just for the weekend because - hey, why not.
Then back to Dollar cost averaging next week.

FSLY LongSideway Consolidation in uptrend
Near bottom
Breakaway Gap,
Possible double bottom
Entry 68
Stop 58
Target 120
I am not a PRO trader. I trade option to test my trading plan with small cost.
The max Risk of each plan is less than 1% of my account.
If you like this idea, please use SIM/Demo account to try it.

AMC: What if it reverses? Some scenarios to work with!Hello traders and investors! Let’s study AMC again! Since our last analysis, AMC hit our target at $ 9.93, and it almost triggered the Harami pattern we discussed, which could’ve worked as a great reversal pattern. I do weekly public analyses about AMC, and the link to my last analysis is below this post, as always. Let’s see how it is doing now.
Ok, it didn’t give us a buy in our last analysis, but AMC did a nice buy sign when it did the Bullish Engulfing evidenced in the chart. Good candlestick pattern, with nice volume, but it still not enough to impress me. Now it seems it found a support level at the black line again.
If MC loses this black line, probably it’ll retest the Bullish Engulfing’s low again, and if it loses it, then it’ll seek lower supports, seen only in the daily chart . But before we talk about the daily chart, it is important to notice that AMC has a pivot point at the red line ($11.52), and if AMC breaks it, the $ 14.50 is the first target to work with, and probably the Breakaway Gap will help the price to hit there. Remember: Gaps work as magnets.
Now, the daily chart:
AMC did another Bullish Engulfing in the daily chart as well, closing above the 21 ema, but this pattern appeared in the middle of nowhere. If this pattern appeared near a support level, I would be much happier.
The problem is, if AMC loses the engulfing’s low (both, 1h and 1d charts are the same), the next target will be the $ 5.22 . But if it triggers the pivot in the 1h chart, the $ 14.50 is the first target, but AMC could seek the $ 20.36 as well, depending on the strength of the movement.
Although AMC didn’t trigger any buy for us (not one that I find good enough, at least), I agree that the R/R ratio is good, and AMC could fly again. But it is too soon to buy it.
And we’ll keep AMC on our radar! If you liked this idea, remember to follow me to keep in touch with my free analysis, and if it helped you, remember to support it with your like!
Thank you vey much!


NIO: Is this sell-off for real?Hello traders and investors! Let’s talk about NIO today.
First, NIO lost downwards the Descending Channel we discussed in our last study, so it just resumed the bear trend until the next support level. And as usual, the link to my previous analysis is below this post.
The $ 35 area is interesting, as NIO filled an open gap , and it found a support there too (black line). When a stock is near a support level, the Risk/Reward ratio usually is very high, and if NIO reacts around here would be an amazing sign.
Now, let’s see the daily chart:
Let me be clear: The trend is bearish, and we have no clear reversal sign ahead. But I’m very curious about the volume seen in the past days. During the entire last bear leg, after it found a top around the 21 ema at the $ 46.28 (black line), it dropped with a very low volume. And when it started to get closer to the $ 35 area the volume started to increase again. What’s more, Friday’s bullish reaction had a higher volume than usual.
Usually, this indicates that this is not a real sell-off , but since NIO is quite weak and we have no reversal sign ahead, there’s nothing interesting to do. But I agree that if we see any bullish sign this week, it could offer a brilliant buy opportunity for everybody who wants to buy NIO or increase position, as the R/R ratio is very high.
Let’s see how NIO will play out in the next few days, and remember to follow me to keep updated about our daily studies, and if you liked this idea, please, support it!
Thank you very much.

every April Intuit gains 10, 20% maybe 30% this yearEvery April Intuit gains 10, 20% maybe 30% this year.
There is a gap and it can be filled
every gap in intuits chart has been filled since 2017.
this might not be filled as it is far down thee
but
the charts say the price is ready to drop.
Short term bearish long term bullish
I will set a ladder buy from 365-325 in increments of $5 down to the gap.

SBIN AT SUPPORTThe stock has reached multi-timeframe support and chances are high that it could see some bounce from here.

AMC: Hit our target (again)! Any reversal sign ahead?Hello traders and investors! AMC is doing some very interesting and technical movements recently. Since our last analysis, it did a downwards breakout from the Trap Zone , and it hit our target today. The link to our previous public study is below this post, as usual.
Now, AMC hit our target and it is near a support area . In the 1h chart we have the $ 9.93 area, which seems to be working, but we have even more support levels in the daily chart. But before we talk about the daily chart, we have a few things to keep in mind.
First, it lost our Trap Zone by doing a Breakaway Gap , which is a quite powerful pattern. When this happens, we usually see a very strong movement next, and it was almost certain that it would hit our target.
Now, it seems AMC is trying to do a Harami , a candlestick pattern that in normal circumstances has a random chance of working as a reversal, but when it is near a support level, these odds increase. The Harami wasn't triggered yet, so we still must wait. Now to the daily chart:
In our last study, last week, we set a target at the 21 ema and the pink line area (after a downwards breakout of the Trap Zone), and right now, AMC is sitting right at our target. We have no clear reversal sign in the daily chart, but if we see one, it would be a nice opportunity to buy AMC, at a good price, with a great Risk/Reward ratio.
The reaction in the 1H chart is promising, yes, but we have yet to see a confirmation in the daily chart. If AMC triggers any interesting pattern around, the $ 20.36 is the next target to work with . But wait for confirmation!
And remember to follow me to keep in touch with my daily studies, and if you liked this idea, please, support it with your like!
Thank you very much!

CLVS Clovis Oncology has a chart that is peaking my curiosity.Everyone who has eye open is aware of the short situation in some form or another. CLVS has a short float of 41.88% and is headed into support formed by the previous Bullish Gap and Go. Curious if it will fill or support. Anyone have an option? Comment below!
