ZOM: Key Points we must keep in mind for the short/mid-term!Hello traders and investors! Let’s talk about ZOM today! It’s been a while since my last analysis, so we have some points to update. And if you missed my last public analysis, the link to it is below, as usual.
First, ZOM reversed the short-term bull trend that we discussed in our last study, shortly after a breakout of a key point at $ 2.34. Now the trend is bearish , as we have lower highs/lows, and the 21 ema is pointing down.
Today, it lost the support level around the $ 1.94 (red line) by doing a gap. If this gap is going to be filled in the next two days, it could be an Exhaustion Gap , and work as a reversal pattern for ZOM.
Now, let’s see the daily chart:
In the daily chart the situation is not as horrible as it looks like in the 1h chart, as ZOM is clearly still inside a congestion . As it is normal in congestions, the price could seek its base and the situation would still be under control. Meaning, ZOM could hit the $ 1.48 again, and this would be a buy opportunity.
Another point worth of noticing is the low volume , which indicates that this is not a real sell-off. If it were, the volume would be higher.
ZOM did a false breakout from the $ 2.25, which was the key point we discussed in our last analysis, as it closed above it, then in the next day it did a classic bearish engulfing , which pushed the prices down.
Now, ZOM needs another clear pattern to reverse the bearish bias, and make it retest the $ 2.90 again. A ny good reaction, with good volume will do. I like the fact that the bullish candlesticks have higher volume than the black candlesticks, on average, in the last few days.
This could indicate a possible rally next; we only need some confirmation. And remember to follow me to keep in touch with my daily studies and updates on stocks, and if you liked this idea, remember to support it with your like!
Thank you very much!
Gap

PLTR: What it takes for it to fly again?Hello traders and investors! Let’s see how PLTR is doing today! Since our last analysis, PLTR did a downwards breakout from the dangerous Trap Zone . Now the trend is bearish, as it should be. Let’s see in detail what’s going on.
First, in the 1h chart, PLTR lost the red line at $ 25.18 by doing a gap (yellow area), which was quite surprising. What’s more interesting is that PLTR retested the red line again as a resistance , along with the 21 ema, on March 17, but the price couldn’t sustain at this level. This is an annoying weakness sign.
Now, the trend is clearly bearish, as we have lower highs/lows and the 21 ema is descending and pointing down. But PLTR has a technical target around the light blue line ($ 22.50). Now, let’s see the daily chart:
The problem with PLTR is that we can’t take a movement like this seriously, as the volume is too low, but it seems the $ 22.50 is indeed the next target for PLTR.
But as long as we don’t see any good reaction, with good volume, the bearish bias will persist. We don’t have a good reaction yet, but now that we are near a support level, is the best time to see one.
And remember to follow me to keep in touch with my daily updates on PLTR and other stocks! If this idea gave you a new insight, please, support it !
Thank you very much!

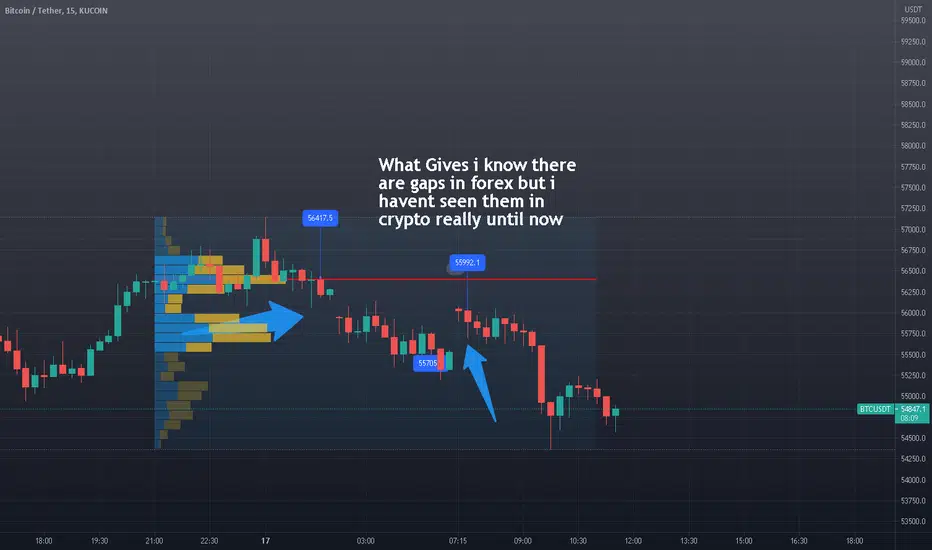
Never seen this in crypto before atleast not that i can remembernot a idea but these gaps in bitcoin this morning are on all the smaller time frames very clear gaps before a dump with no volume i dont understand it
PLTR: The decisive moment is coming! Escaping the Trap Zone!Hello traders and investors! Let’s see how PLTR is doing today! This one is one of the stocks I have on my radar, and I’ve been following it closely, and we have been doing weekly analyses about it.
In the 1h chart we see that PLTR is inside a Trap Zone , just like several other stocks. A Trap Zone is the area between the previous resistance (in this case the black line at $ 27.45) and the ascending 21 ema, which is squeezing the price within an area that gets tighter as time passes.
At one point, PLTR will be forced to do a breakout, but we just don’t know to which direction it will go. I don’t see a bright future if PLTR does a downwards breakout, as we are already quite close to its support, the red line at $ 25.18.
But if we consider an upwards breakout, the daily chart can offer us more clues:
The area between the gap (dotted line) and the previous resistance at $ 30.25 would work as a natural target if PLTR does an upward breakout from the Trap Zone. The only thing that is missing on PLTR is a nice volume .
In the worst-case scenario PLTR would hit the blue line at $ 22.50 again, while in the best-case scenario it would hit the $ 39.32. I think we can start working with the targets that are closer to us, for now.
What are your thoughts on PLTR? Remember to follow me to keep updated about my daily analyses on stocks, and if this idea gave you a new insight, please, support it with your like!
For more analyses, check the links below.
Thank you very much!

NIO: Inside a dangerous "Trap Zone"!Hello traders and investors! Let’s see how NIO is doing today!
First, in the 1h chart, we have higher highs/lows, and the price is trading above the 21 ema, a clear trait of a short-term bull trend . In order to keep going up, it must defeat its first challenge, at $ 46.28, which is the next pivot point .
We can say that NIO is inside the famous “ Trap Zone ”, between the ascending 21 ema and the previous resistance at the black line. The 21 ema is squeezing the price in a tighter area as time passes, and at one point, NIO will be forced to do a breakout. The question is, to what direction?
In the 1h chart an upwards breakout seems more plausible, as we have an open gap (yellow area), and the next target would be the $ 50.40. But we must be aware of the daily chart:
The problem is, the $ 46.28 is not only a pivot point in the 1h chart, but it is near the 21 ema in the daily chart, and the trend is still bearish in this timeframe. If we have enough bearish patterns around this resistance zone, NIO could easily drop again to the $ 38 area.
The volume decreased in the past few days, indicating that the players are waiting for more signals here, before jumping into any conclusion.
For now, we must watch NIO closely and see how it’ll behave after a breakout from this Trap Zone. And remember to follow me to keep in touch with my daily updates and studies on stocks! And if this idea helped you to see something new in this chart, please, support it with your like !
Thank you very much.

AAL: Anxious about it? Here's how to proceed!Hello traders and investors! Let’s analyze AAL again! In this analysis, I’ll share some exit strategies you can use on it.
Ok, as we have been saying since my first analysis, in the end of January, AAL finally hit its natural target at $ 22.80, and it is trading even above it today! My analyses on AAL were all public, and the link to them are below this post, if you are curious.
How to proceed now? Well, it is not a buy opportunity at all. Now it is time for those who bought it under $ 17 start to think about booking their profits. Since it defeated the target at $ 22.80, this could be your stop-gain , and if AAL loses this support, then you may sell it. Another key point is the previous gap, which we still don’t know its type. If it is an Exhaustion Gap , it’ll be filled quickly, today or tomorrow, indicating a sharper pullback ahead. Use it in your favor too.
Or, if you have the stomach for it, wait for a clear reversal sign , like a lower high/low to book your profits, and buy it back when it hits the 21 ema in the daily chart. Speaking of daily chart:
Another exit strategy is a trailing stop , and you may book your profits if AAL loses the previous day’s low. For instance, if tomorrow it loses the $ 24.21 (today’s low, so far), then just sell it.
Again, pullbacks are opportunities to buy when a stock is in a clear bull trend. Don’t buy now, near a top level, and if you want to buy, wait for it to get closer to the 21 ema or one of its supports again.
And if you liked this analysis, please, support it with your like ! And remember to follow me to keep in touch with my daily studies.
Thank you very much.

AMC: Next Key Points we all must keep in mind!Hello traders and investors! Let’s talk about AMC today! It did some very technical movements, and it is about time to update you since my last analysis (the link to it is below, as usual).
In my last analysis we discussed the two most important key points for AMC, the black line at $ 7.63 and the purple trendline . Well, AMC respected again the $ 7.63 as a support level before it defeated the purple trendline, triggering a buy sign.
What’s even more curious is that it did break the trendline by doing a Breakaway Gap (yellow area), which is a very powerful sign. A Breakaway Gap is a gap that defeats a support or resistance, in this case, it defeated the trendline and the 21 ema.
Now, AMC is doing a pullback to the 21 ema, which is normal and expected. Let’s see the daily chart for more clues:
We already talked about how the bulls were in the control of this situation, thanks to our reading of the volume , and the movement seen this week reinforces this idea. The volume is increasing, as the price goes up, all according to the 5th Tenet of the Dow Theory: The Volume Must Confirm the Trend . When we combine our typical Price Action style with a good reading of the volume, we have all the tools we need to trade well.
But what now? Pullbacks to the 21 ema are expected, and I believe we’ll see one, but since it did break the bearish sentiment, we can expect it’ll fill the gap at $ 12.91 (red line). If AMC will fly again or not, we don’t know. It feels it is too late to buy it (the good buy was around the $ 7), but if it breaks the $ 12.91, it’ll trigger a Cup & Handle chart pattern, and AMC could easily seek the $ 20 again.
This stock is harder to read now, but soon it’ll do something interesting again. And if you liked this analysis, remember to follow me to keep in touch with my daily studies, and to support this idea with your like!
Thank you very much!

PLTR: Complete Analysis (Hourly/Daily/Weekly charts).Hello traders and investors! Let’s see how PLTR is doing today, and do a complete Multi Time Frame Analysis (MTFA) by looking at the hourly, daily and weekly charts!
This stock dropped sharply in the past few weeks, but right now it is doing something interesting. For the first time, it is breaking the bearish bias seen since it started its fall around the green line ($ 37.95), as we see higher highs/higher lows. This movment is natural, and not surprising at all, as we already discussed in my previous analysis, last week ( link below).
What’s more, the 21 ema is pointing up, and the price is above it. We can assume it’ll reverse the bearish sentiment seen in the daily chart as well.
The bias is still bearish in the daily chart, but if the 1h chart persists in its bullish sentiment, then the trend will eventually reverse in the daily chart too. What are the main challenges PLTR has right now?
First, the 21 ema, which might offer resistance today or tomorrow. Second, the volume is still quite low, so, looking at the daily chart some people might not be entirely convinced by it.
Aside from that, if PLTR keeps trading at this level until the end of this Friday, the weekly chart could be very interesting:
At any moment the bears could make PLTR trade under the 21 ema and the 61.8% Fibonacci’s Retracement , and this is interesting. Clearly, this combination makes a very strong support level.
In fact, PLTR did a very powerful Hammer candlestick pattern last week, with a nice shadow under the candlestick’s body, a good thing when we talk about Hammers. And this week we have a Bullish Engulfing (so far), making the situation quite bullish.
Now, the 50% retracement may work as a support, but I believe the 38.2% level is more interesting, as it is exactly at the same price level where it would fill a gap.
If you liked this analysis, remember to follow me to keep in touch with my daily analyses, and please, support this idea with your like!
Thank you very much!

The Gap Up (1)Stock price has a gap up, how to confirm it is a true break out or a false break out? Maybe a tight consolidation is a method.
Tips:
This is forex, not a stock. But the tips should apply as well.
Before the gap 2017 May, there were several times the price tried to challenge the resistance line.
Once gap up, a false break out then followed by a tight consolidation, can say the resistance became support.
After the consolidation, price broke out using a way called red three soldier.Then the second break out can be treated as buy hint.

TLT LongBreakaway Gap
Possible Double Bottom
Demand zone Confirmation
Entry 139
Stop 135
Target 1
I am not a PRO trader. I trade option to test my trading plan with small cost.
The max Risk of each plan is less than 1% of my account.
If you like this idea, please use SIM/Demo account to try it.

ValeroLast time price got close to the gap zone, it fell away quickly.
This time, price can't be pushed away. If we chew up all the sell orders before running out of bullish momentum we should break right through the gap zone.
The energy sector has been strong and should help pull it up. See the strong correlation to oil prices at the bottom of the chart.

TSLA: Will it reverse? Key Points to keep in mind!Hello traders and investors! Let’s talk about Tesla today!
In the 1h chart, Tesla is trading above the 21 ema, which is a good sign, and seems it found a bottom there, as it can’t close under it. We have a bear trend in this chart, with clear lower highs/ lower lows, but tesla is showing some early signs of reversal.
First, it filled the last gap quickly, making it an Exhaustion Gap (just like NIO did, and you may check my last analysis on NIO in the link below, I explain better how Exhaustion Gaps are formed there). But Tesla doesn’t have higher highs yet , but it has higher lows. That’s a start, but the situation will change if Tesla defeats the $ 718 (black line), which is a Pivot Point .
Now let’s see the daily chart:
I only wish Tradingview’s chart was right, as Tesla didn’t hit the $ 872 yesterday. Anyway, Tesla hit a support level around the $ 618 and it is bouncing back up. The $ 745 is a resistance for Tesla as well, but I find the volume very good now. Since Tesla crashed last week, the volume increased, and this is a good sign.
The problem will be the 21 ema, as it’ll also work as a resistance. But if Tesla defeats these points, nothing will hold it until the $ 821. It could go even higher, but let’s proceed carefully.
If you liked this analysis, remember to follow me to keep in touch with my daily updates on Tesla and other stocks. Support this idea if it helped you!
Thank you very much!

NIO: What would take for a Reversal to occur?Hello traders and investors! It’s been a while, but let’s talk about NIO today!
The stock dropped a lot recently, which is not necessarily concerning, as we are talking about a systemic drop, but still, very annoying. The thing is, NIO is doing some reversal signs in the 1h chart.
First, it filled a gap, which was an Exhaustion Gap. We know it was an Exhaustion Gap because: 1 – It was filled quickly; 2 – It appeared just before NIO retests the $ 42.10, which is a support level; 3 – We already have several gaps in the middle of the bearish leg (yellow areas), when this happens, at one point, we’ll have signs of exhaustion, and an Exhaustion Gap usually appears.
Yes, the bear trend is getting weaker, but it didn’t reverse yet. We must see NIO doing higher high/higher low . Yes, we are near a support level, and it didn’t lose the $ 42.10, but we don’t have any higher high. So, the $ 50.40 is the Key Point here, and if NIO defeats it, we may finally see a reversal in the 1h chart.
In the daily chart, we see that NIO reacted very well last week, when it retested the $ 42.10. Until then, the volume was low (under the 21 ma I always like to put in the Volume), and now, when it retested the support level, the volume increased again.
This could indicate that there are people buying NIO, simply because the Risk/Reward ratio makes sense. Yesterday’s earnings report did bring some volatility, but this is not going to affect the mid/long term perspectives for NIO.
Let’s see if NIO will manage to reverse the bearish sentiment around it, and if you liked this analysis, remember to follow me to keep in touch with my updates on NIO and other stocks! And please, support this idea if it helped!
Thank you very much!

Multibagger Stock -Jagran Prakashan-- BREAKAWAY-GAP preceded by a valid ROUNDED-BOTTOM pattern formation by more than a year.
-- One-year Accumulation
-- Volume on the gapup day is a lifetime high.
-- Weekly gapup (very rare)
-- Bullish Engulfing pattern
-- Risk : Reward = 1:4
-- Resistance at every level (so be careful)
LTP - 60
Target - 75
Stop loss - 57

Granolabar's Gap and Crap principles TESTED (2/26 Trade Recap)Introduction
In this post, I explain how I utilized the Gap and Crap principles to trade SPY on February 26th, 2021.
Recently, I made a post titled "Granolabar's Gap Down Guide (my own style)." The post is linked below. In it, I outlined my strategy for trading gap downs. I highly recommend you read that post before this one to understand the references I am making.
In the post, I detailed a specific way to trade gap downs using a system of candles and EMAs. The most important part of the strategy is not necessarily the gap down aspect but the conditions I used to determine entries. Specifically:
--------
"To know when to enter the trade, I watch the candle sticks. First, there must be a 5 minute candle that closes below the premarket low. Then there are two possible scenarios from here.
Scenario 1, the next candle immediately pushes below the low of the first candle. In this case, you would take puts or sell short as soon as the second candle breaks the low. My reasoning for this is that if the movement is strong, the second candle would not hesitate to make a new low. It is better to enter on the break than to wait for the candle to close and miss out on potential profits, which are often pretty sizable when things are moving quickly. Notice in the below example that had you waited for that candle to close, you basically would have missed half of the entire fall, which lasted 4 5 minute candles.
Scenario 2, the next candle does not immediately push below the low of the first candle. In this case, you would wait until there is a candle that closes below the low of the first, instead of merely making a new low. My reasoning is that if the momentum is not strong enough for the second candle to immediately make a new low, the confirmation candle to enter needs
to be more definitive. The play is not invalidated because the first candle closing below the premarket lows indicates that there is downwards pressure. In this way you minimize the likelihood of shorting a bear trap while also capitalizing on the fall."
--------
I will proceed by explaining my thoughts on exactly what was going as I was watching the market.
(Note: stops at entry means that I set a stop loss at the price I originally purchased the option for, meaning that it will sell for breakeven price. This is important later on.)
Trade 1:
After getting on Tradingview in the morning and opening up the 5 minute SPY chart, I quickly noticed that SPY did not move at all overnight. Despite the lack of a gap, we could still trade with similar principles. I first drew the resistance at premarket high (yellow) and premarket low (blue) as well as a minor support (white). Identifying these support and resistance levels, as well as any applicable trendiness, are an important part to trading successfully. Keep in mind that the cleaner these lines are, the better they will act as critical levels.
The first few candles after market-open were just chopping between the minor support line and the premarket high; nothing closed above or below either, so there was nothing to be done there. Do not force a play!!! You do not always have to be doing something in the market. Oftentimes sitting on your hands is the best thing to do.
The next candle is when I went on high alert mode. It ended up not only closing under the minor support from premarket (that happened to hold for the first 20 minutes of the trading day), but it also closed below the 50 EMA. At this point, I was just waiting for the next candle which immediately pushed below the low of the first candle, giving the entry signal (Scenario 1). For this play specifically, I kept my stop loss at the premarket high (good resistance) and my target was the premarket low since there wasn’t any major support until then. Once SPY hit the premarket low, I scaled out most of the position and left stops at entry for the rest.
Trade 2
The next play came immediately after when the following candle closed right below the premarket low. This candle was followed by a slight pullback, so my conditions for entry changed to a new candle closing below the previous low (Scenario 2). To remind myself, I marked the bottom of the break candle with a white line. This image was from that moment and shows exactly what I was thinking (I don't have the replay feature for any timeframe less than the daily).
A few candles later, a candle closed under the break low. This marked the entry of a short position, with the stop loss set at the premarket low (blue line) since it previously acted as a critical level.
I decided to start scaling out after seeing a small inside bar green candle, which is typically a reversal pattern. Since I took profit on part of the position, I made sure to set stops at entry for the remaining position. This ensured that the play finished green; it is not worth it to risk the remaining position going negative and cancelling out the gains. If the market takes another turn down from there, just consider reentering a new position. I will continue reiterating this concept since it is crucial for this fast paced trading style.
Trade 3
After exiting trade 2, I did not play the break of the premarket low from the bottom up, but it would have been a good scalp also. Theoretically speaking, this was how it would have played out if the rules were followed.
The play I did take, however, was the break of the premarket high a little later. Again similar principles: closed above the line, the next candle immediately pushed higher (Scenario 1), and the stop loss was a clean break of the 34/50 cloud on the 1 minute chart. In this play, I scaled out due to a red inside bar; again, I left stops at entry after scaling out the first time to ensure the play stayed profitable.
Trade 4
This trade was a slight change of pace; I ended up playing a falling wedge breakout with the same principles. I saw that SPY was forming a clean wedge with the top and bottom trend lines both having 3 solid touches each. The plan was to wait for a break of the 50 EMA (top of the blue cloud in this case) since it typically acts as a support/resistance. The stop loss was a clean break of the 34/50 ema cloud on the 1 minute chart, and the price targets were the white and yellow lines from premarket. As soon as it hit the first price target, I scaled out half the position and set stops at entry to lock in gains. The rest were sold at the second price target since the stops were not triggered beforehand.
Right at breakout view:
Nearing PT 2, premarket highs:
To play devil's advocate on my own plan, I am asking myself why I did not sell the position at the 2:44 PM ET 1 minute bar (the 13:44 bar on my chart above). The candle was fully below the 34/50 EMA cloud and had pushed below the previous "break" candle's low for a second. While those are valid points, it did not satisfy my stop loss conditions. I wait for the second candle after the “break candle” to close below the first candle's low on the 1 minute, which this candle did not. Additionally, it ended up closing as a hammer which is typically a bullish sign.
After that fourth play, I did not take any more positions for the day. Typically, the last 30-45 minutes of the day are very volatile, especially on a Friday, and it can be very risky trading in that environment. The options that I typically play expire within an hour of close; any misplay will lead to 50%+ losses instantly. However, if I am in a position that goes into the last 30-45 minutes of the day, I will not close it just because it hit that time of the day.
Conclusion:
I hope you enjoyed this post; it may have been a little lengthy again, but I wanted to detail exactly how I used the principles that I devised to trade.
There are 3 key takeaways:
1. The candle stick rules I use to decide when to enter a trade is a good way to catch breakouts while minimizing fakeout risk. It may mean that your entry is not exactly the first bar of the breakout, but the additional safety will help the majority of the time.
2. The rules I devised in scenario 1 and 2 are not limited to Gap and Crap setups. I will use them on whatever a clear breakout opportunity presents itself, including ascending triangles, bull flags, bull pennants, symmetrical triangles, falling wedges, cup and handle, inverse head and shoulders, etc.
3. Always make sure you set stops at entry if you reach a take profit level and sell a portion of your contracts.
If you have any questions, feel free to leave a comment. I will try to read all of them :)
Have a great day and I wish you well.
-Granolabar

BTC1! CME weekly candle indicates major change in trendThe CME has formed a weekly bearish engulfing candle if price don't go above this level until Friday's close. A weekly bearish engulfing candle almost always indicates a change of trend downwards. Maybe the CME gaps will be filled as greater than 90% have been historically filled. The few that were not filled like the 3.6k and 9.6k, might have been closed internally by the CME .
Blue boxes are unfilled gaps.

Granolabar's Gap Down Guide (my own style)Introduction
Within the past week, AMEX:SPY has become increasingly volatile, with massive gap ups and downs
followed by all day runs extending more than 3% in either direction. This is apparent with a cursory glance at the following chart.
With this volatility comes uncertainty, especially for those who are swing trading on the timeframe of a few days to a few
months. However, we can use this increased volatility to our advantage. i am going to introduce my way of trading these days,
particularly the ones involving gap downs.
Identifying the Setup
Identifying the setup is relatively simple, but there are a variety of factors that can improve your chances of success.
Firstly, the stock needs to have gapped down overnight. This one is quite obvious and easy to identify; look for a literal gap in
the prices going from after hours to premarket, like those identified in the following chart of SPY.
Secondly, there are a few things that can improve the chances of this strategy playing out. For example, if the stock recently hit
a supply zone and rejected, the gap down is more likely to be followed by more downside as the stock is already in "pullback
mode."
Additionally, trendlines are another great thing to keep in mind. For example, SPY recently hit a nearly 4 month long strong
trendline and rejected. Generally speaking, the larger the timeframe that the trendline is identified on and the more "touches"
it has, the stronger it will be. I often find it useful to work my way down from the 1 month or 1 week chart down to the hourly
to identify trendiness that I need to keep in mind.
Trading the setup
To trade this setup, I like to primarily stick to the 5 minute chart. The one minute chart has too much noise, while the 15 minute
takes too long for confirmation that you would miss a sizable amount of the move.
Once you are on the 5 minute chart, draw a horizontal line at the bottom of the premarket low, as shown below. This will be the
critical value to watch. Theoretically, you want to enter when that line breaks , BUT there are often fakeouts
around these critical levels.
To know when to enter the trade, I watch the candle sticks. First, there must be a 5 minute candle that closes below the
premarket low. Then there are two possible scenarios from here.
Scenario 1, the next candle immediately pushes below the low of the first candle. In this case, you would take puts or sell
short as soon as the second candle breaks the low. My reasoning for this is that if the movement is strong, the second candle
would not hesitate to make a new low. It is better to enter on the break than to wait for the candle to close and miss out on
potential profits, which are often pretty sizable when things are moving quickly. Notice in the below example that had you
waited for that candle to close, you basically would have missed half of the entire fall, which lasted 4 5 minute candles.
Scenario 2, the next candle does not immediately push below the low of the first candle. In this case, you would wait until there
is a candle that closes below the low of the first, instead of merely making a new low. My reasoning is that if the
momentum is not strong enough for the second candle to immediately make a new low, the confirmation candle to enter needs
to be more definitive. The play is not invalidated because the first candle closing below the premarket lows indicates that there
is downwards pressure. In this way you minimize the likelihood of shorting a bear trap while also capitalizing on the fall.
Let's Talk Take Profit and Stop Losses
Now that you have successfully entered the position at an optimal place, the next thing to consider is where you want to exit,
whether that is to secure the tendies you just made or protect yourself from further losses. Note, this part is completely up to
you and your risk or reward tolerance.
Assuming that it all goes to plan the the stock starts to fall:
I typically trade weekly options for this kind of play, as it is a short term play. Because options premiums move quickly in both
directions, I will take profit at 25% with about half the position if the candles are getting smaller, indicating that the trend may
be weakening. Then I will set a stop at open, meaning that I will sell the remaining portion of the position if the contract goes
back down to my purchase price; this guarantees that ultimately the play is profitable.
However, if the candles stay rather large, I will hold the position until the candles do start to get smaller, and sell half the
position there, often around the 50%, 75%, or 100% profit mark. If the option does hit 100% profit, I will almost always sell half,
with very very few exceptions. This ensures that even if the other half of my position expires worthless(worst case scenario), I
come out of the play completely unscathed.
If the play does not go according to plan:
Let's assuming that right after you enter based on the conditions above, the stock reverse to the upside. Now the question
becomes, when do you sell to prevent yourself from taking major losses. For this I use my EMA clouds, or simply just EMAs with
the region between the lines shaded in. I typically have a 5/12 EMA cloud (green) and a 34/50 EMA cloud (blue).
As soon as one candle closes above the 5/12 green EMA cloud on the 5 minute chart , and the next candle closes
above the first candle, that Is when I take the loss and move on. Often times, when playing this strategy, the price will come
back up and retest the break line; do not panic if the position is immediately red, but also stick to the stop loss rules mentioned
above.
This cloud strategy also applies to closing the last half of the profitable position mentioned above. When you are left with half a
position at 100% profits or more, I will wait for reversal to sell. The reversal tends to happen when one candle closes above the
34/50 EMA cloud on the 1 minute, and the next candle pushes past the first high. There are also many other ways to market the
bottom, such as bullish divergence, engulfing candle, abandoned baby, etc.
TLDR
This is my way of trading gap downs that utilizes candle sticks and the EMA clouds to determine Stop loss or Take Profit places.
Simply put, buy puts when the price cleanly breaks the premarket low, ride with the clouds until they suggest a reversal or
hit a stop loss point.
if you have any questions or comments, please feel free to let me know. I would love to hear other perspectives or criticisms.
Also, the "clouds" are just EMAs filled in with crayons, but if you want the script, it's in my profile.

SPXL ShortIn Uptrend Wedge
Gap Down 2/22/2021
Gap Down 2/23/2021
Short 77
Stop 85
Target 50
I am not a PRO trader. I trade option to test my trading plan with small cost.
The max Risk of each plan is less than 1% of my account.
If you like this idea, please use SIM/Demo account to try it.


AAL: It's flying today! How to proceed now?Hello traders and investors! It has been nearly 1 month since my last analysis about it, let’s see if AAL behaved the way it should.
First, in the 1h chart, AAL respected the key point we mentioned in my last analysis, the black line at $ 16.47 with an astonishing precision, and it hit it multiple times, without losing it. This point was a previous resistance, and it worked as a support, as we thought it would, thanks to the Principle of Polarity . And if you missed my last analysis, the link to it is below, as usual.
It triggered several pivot points , the last one at $ 18.82, and we have a little gap at the yellow area. If it gets filled this week, it could be an Exhaustion Gap , and this could create another congestion on AAL.
Right now, it is a little to buy it, as the optimal buy point was near the $ 16.47, and we are quite close to the target I mentioned last month, but since it is engaged in a bull trend, pullbacks to the 21 ema could offer some nice opportunities to buy too.
Now, let’s see the daily chart:
In the daily chart, AAL is heading to the target we mentioned in my last analysis, the $ 22.80, which is one of the previous resistances, and nothing unusual is happening here.
The volume decreased during last month’s accumulation, which is a typical trait of just an accumulation before the explosion, and the 21 ema is pointing up, evidencing the bull trend and working as a support level in the future. What’s more, the volume increased in the last 2 days, and today is finally above the 21 moving average I like to put in the volume as well.
These are good signs but be prepared for pullbacks, but they could offer an opportunity for the late buyers. Any pullback to the 21 ema in the daily cart as well could be a nice opportunity if you missed the entry point on AAL. And remember to follow me to keep in touch with my daily analyses on stocks and indices. And please, support this idea if you liked it!
Thank you very much.

AMKR ready to flyAn Amazing setup in my opinion. A gap and then a descending triangle, retested a support from the 2000's and on its way back up. Definitely has up side soon! This is just an idea, Not investment advice.

TSLA: Key Points we all must keep in mind!Hello traders and investors! Let’s see how Tesla is doing today!
The area between the $ 780 and $ 762 (black and blue lines) seems to be working as a support level for Tesla, in the short-term, and this could trigger a reaction strong enough to change the trend in the next few days.
The short-term trend is clearly bearish , and the 21 ema is going down along with the price. But maybe Tesla has a Pivot Point at $ 799.80 , which could make it seek for higher resistances, like the purple trendline, or even the $ 880 again.
But Tesla would need to defeat the pivot point and the 21 ema (and make it point up again) in order to confirm this movement.
Just like the black and blue lines in the 1h chart represent a support zone, the yellow area between the $ 880 and $ 900 (light blue lines) represents a resistance zone . Given the low volume , we can assume that Tesla is trapped inside a congestion.
But Tesla must not lose the $ 780 again, as this could trigger a sharper pullback to the $ 695 (previous top). We can’t tell which direction Tesla will go from now, so, let’s keep our eyes open here. And remember to follow me to keep in touch with my daily analyses on stocks, and please, support this idea if you liked!
You'll find more analyses in the links below.
Thank you very much.

PLTR Gap Up SoonPLTR Reversal
Held and Bounced perfectly off 200EMA
Looking very oversold on all timeframes
RSI & SMI curling
Descending wedge on daily
Earnings on Tuesday - expecting a gap up!
PT1 33.6
PT2 36.8
PT3 40, ATH+!
SL Below 200EMA, or 30
