NIO: Time to panic?Hello traders and investors! Let’s talk about NIO!
Despite today's sell off, thanks to some news, NIO is doing very technical movements. It is retesting the purple line at $ 50.50, which is the most important support for NIO, as we discussed in my last analysis, and if we see a good candlestick pattern around here, it would be great. If you missed my previous analysis, just check the link below.
Also, thanks to the volatility, NIO almost filled the gap , but since it is reacting now, I don’t think it will. The volume increased in the last hours, again, thanks to news, but I see no reason to panic, especially if we look the daily chart:
Since NIO defeated a previous resistance (pink line at $ 48.65), now it is natural that it’ll work as a support in the future, according to the Principle of Polarity of Technical Analysis. Also, we have the 21 ema to hold the price.
The volume was good, but again, it is hard to tell how much of it was due to the news. But regardless of anything, the price is still doing nothing surprising or incredible. I see this just as an attempt to retest its supports (they didn’t even get hit).
I would start to worry if tomorrow NIO loses today’s low, along with the pink line. But today’s drop was extremely technical and could even bring some opportunities.
And remember to support this idea if you liked it! And follow me to keep in touch with my daily updates! Thank you very much!
Gap

TSLA: The most important supports to watch!Hello traders and investors! Let’s see how TSLA is doing today!
First, we have a Gap in the hourly chart, and possibly it is a Breakaway Gap . If Tesla closes it quickly, maybe in tomorrow or in two days, then it’ll be an Exhaustion Gap , and Tesla will seek lower levels.
Right now, we are near the ATH, and there is no clear target for Tesla, but a pullback to the $ 744 wouldn’t surprise anyone here. If Tesla drops below that level and fills the gap, then the odds are that Tesla will seek the $ 718 again, or even the purple trendline.
These are my views about the short-term. Now, let’s see the daily chart:
Tesla is in a strong bull trend, and there are no pullback or reversal signs (at least not yet). As long as Tesla keeps above the $ 744, the stock will continue trending.
But if it does a pullback in the hourly chart, to the $ 718 as we mentioned, I don’t see it recovering quickly and flying again straight to the $ 900, which is my personal long-term target (target of the Pennant pattern we have been discussing in the past 2 months, in the weekly chart, if you missed my previous analyses, check the links below).
In the worst-case scenario Tesla would hit the $ 695 area, but I would focus on the $ 744 first, then the $ 718. These are the most important supports for Tesla right now and remember to follow me to keep in touch with my daily analyses! Also, support this idea if you liked!
Thank you very much.

Bitcoin Futures Another Symmetrical TriangleBitcoin CME Futures are so gappy these days because of the high volatility during the weekends, so I decided to write my own script to follow them. This last one is looking like an exhaustion gap after having a breakout gap on lower levels. But currently, there is a symmetrical triangle, which if broken downside we might test the gap support line at 26,645$. However, if broken upside we might try making a double top or just go around 36,000$. I am being very careful with my positions on these levels, I am waiting for confirmation with a candle close or very high volume supporting the break. Let's see if we are finally going to get the retracement that everyone is waiting for.

NIO: Opportunity ahead! Bullish signs near a dual-support!Hello traders and investors! Let’s see how NIO is doing today!
Ok, NIO is dropping today, but I see no reason to panic. Right now, NIO is doing a Bullish Engulfing , above a dual-support level made by the purple line at $ 50.50 and the 21 ema. This purple line is my guide for the short-term, as we discussed in my last NIO analysis, which you can check in the link below.
Under this line, NIO could fill the gap and even do a sharper pullback. But this shouldn’t scare anyone here, as the trend is still bullish, and there are no reversal or pullback signs yet.
The daily chart is looking very bullish, and if NIO corrects, we can expect it would hit the 21 ema in the daily chart again, but so far, there is nothing indicating that this is going to happen. Remember: The $ 50.50 is the key point.
The volume increased a lot yesterday, reinforcing the idea that the trend will resume, and as far as I know, today’s drop was just an opportunity. As crazy as this sounds, the target is the $ 57.20 , as we discussed in my last analysis (again, link below).
Let’s watch NIO closely, and remember to follow me to keep updated, as I do daily analyses on NIO and other stocks. And please, support this idea if it helped you! Thank you very much for your support!
Have a nice day.

$FUBO - Nailed the bottom! First Target $32Called bottom yesterday, now we look to fill this first gap. $32 first target.

BTCUSDT wants to test the 0.618 Fibonacci 🦐$BTC.X Wants to retest the 0.618 Fibonacci level in order to fill the CME GAP. After our amazing Idea , now we need to wait to understand the strength.
The Bitcoin CME gap, also called the “CME gap” for short, is the difference between the trading price of a Bitcoin futures contracts when the market opens on Sunday, and when it closes on Friday. Unlike cryptocurrencies, traditional assets do not trade 24/7 around the clock. Most traditional exchanges follow normal working hours and close on holidays, and the CME is no exception to this!
Bitcoin CME gaps have often been known to “fill”. Filling means that the spot price moves back to the previous close
According to Plancton's strategy (check our Academy), we can set a nice order
–––––
Follow the Shrimp 🦐
Keep in mind.
🟣 Purple structure -> Monthly structure.
🔴 Red structure -> Weekly structure.
🔵 Blue structure -> Daily structure.
🟡 Yellow structure -> 4h structure.
⚫️ Black structure -> <4h structure.
Here is the Plancton0618 technical analysis, please comment below if you have any question.
The ENTRY in the market will be taken only if the condition of the Plancton0618 strategy will trigger.

NIO: Next target and Key Points!Hello traders and investors! Let’s talk about NIO today!
NIO is starting 2021 with the right foot here. I rarely give any entry point here on Tradingview, but in my last NIO analyses I made an exception, for educational purposes only . I gave you guys an entry point at $ 45.46, and for more information just check my previous analyses, the links are below, as usual.
Now, the exit point is up to you. Keep in mind that NIO is in a bull trend, and pullbacks to the 21 ema are expected. But NIO did a Breakaway Gap today, defeating the resistance at $ 50.50 (purple line).
I would use the purple line as a guide from now on , as if NIO loses it, then it may fill the gap, but I wouldn’t count too much on that, as the daily chart is looking very good:
Yes, this Piercing Line pattern was one of the reasons why I was bullish on NIO, and it defeated the pink line, as we said it would. The volume is increasing again, which is great, and this indicates that NIO is just starting its movement.
In the mid-term, the pink line is a key point, as it is the most important support for NIO, but as long as it keeps trading above it, the next target is the ATH at $ 57.20.
Will NIO hit this point? Let’s see. Follow me to keep in touch with my daily analyses and remember to support this idea if it helped you! If you missed my previous analyses, again, check the links below.
Thank you very much, and let’s have a great 2021!

BTC in January 2021 will be GAPtasticThe last few months have been euphoric, thanks to USDT Tether printing. With the upcoming Tether FUD in January, we will see Bitcoin fill those huge CME gaps.

#BTC #Bitcoin AnalysisSince the beginning of the year, we have seen Bitcoin far exceed the resistance of $ 30,000, something that was unlikely. Over the past few weeks several resistances have been broken, and following the same path, the same has happened in this one. This is due to the entry of different institutions taking advantage of the low volume and volatility of the weekends.
Analyzing the CME futures chart for Bitcoin, GAPs do not stop happening, in the image it is shown, the largest being the one that is being created now. Tomorrow's Monday opening will mark the final value for this GAP.
In addition, in all the charts analyzed with candles of 1H, 4H, 1D and 1W, Bitcoin is overbought. For the 1-week chart that we have been following in the channel for a long time, a break has been made at a major resistance point near $ 33,000. This break has yet to be confirmed, but we see likely that Bitcoin added to all factors may laterize at this point (as we see in 1H candles) showing great indeterminacy, with a rejection at the $ 30,000 support zone, pushing the price back.
The future of Bitcoin looks bullish on the price action, but the indicators mark an imminent correction. Do not rush to open your operations. Mark the probability of your addresses at the entrance and do not follow them, do not rush to drag the loss, with large movements in Bitcoin you must always stay safe, be smart and control your risk.

Giant GAP in TeslaGiant GAP in Tesla stock. Sooner or later, a GAP will always be filled. The problem is that you never know when a GAP will close - so the stock can easily rise much more. Unfortunately, a GAP cannot be used to find a peak in a given stock. But beware

Ending the day strong with strong stocks!Again we are talking about low float and high gap stocks with high relative volume (MACD above 0, and KDJ intersect going up), rest is pure garbage. Focus on those criterias I mentioned and go down the list of the scanner to find the ones that meet the criteria.

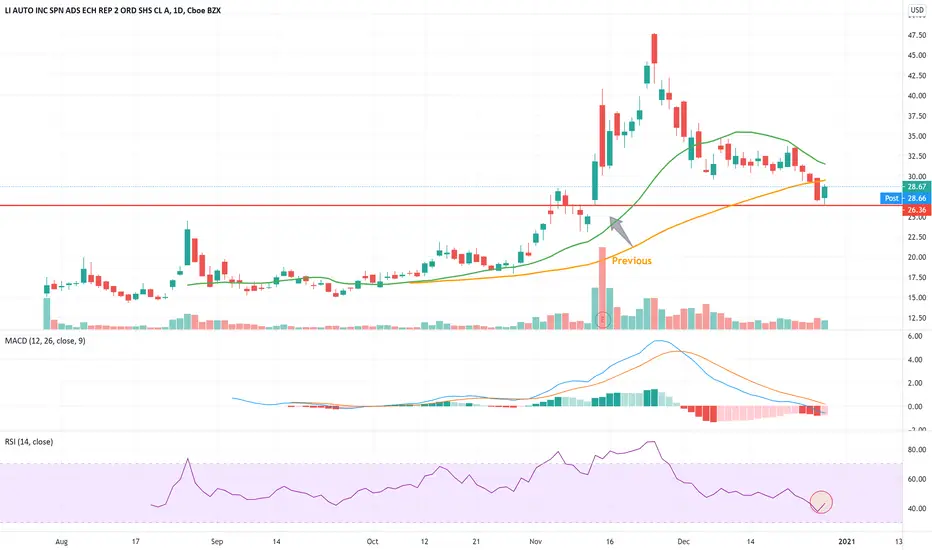
LI Retest GapNASDAQ:LI has retested the Nov 12 Gap and bounce off from that support zone. Potentially a lot of buyers bought this support throughout the day. Even end the day that is some big buying was happening (if look at 5 mins chart). Plus Relative Index side also gained some 4 points. This chart in fact to me looks similar to NYSE:NIO support zone 38.7. The only negative side I see is it's under the 50ma if the close above that moving average in a day or two then it's a positive sign.
Buy UUU when MACD is above 0. Large gap and low float stock.So the idea is to buy a stock when it has large gap and low float, and then the lines are in the right direction as well. This takes alot of experience and practice but eventually you will understand it.


DIS 12/21/2020 LongDIS gapped up on heavy volume over a significant level that it was bumping up against & has spent six days digesting these higher prices.
I bought a half-sized position on Monday (12/21/20) when the market gapped lower due to a new COVID strain mutation in the U.K. I believe that the market is over COVID & has been for some time. Unless there is a negative development on the vaccine front, Pumpin' Powell is going to be able to continue inflating the asset bubble. The DIS pullback also coincided nicely with a bounce off of the 9-day EMA.
My initial stop is below the low of the gap-up day. I'm looking to add larger size on a break of Monday's highs circa $172. I would also be willing to add on a false break & quick reclaim of Monday's lows, at which point I would move stops up to just below the false break.

GBPUSD SHORT IS PROFITShort on GBPUSD has gain more profit on GAP.
We are aiming for the exit target.

AAPL: Bullish patterns and new target.Hello traders and investors! Let’s see how Apple is doing today!
First, Apple is finally defeating the blue line we discussed in my last analysis (link below), and the 21 ema is finally pointing up again, meaning we have the beginning of a bull trend in the short-term. Also, we have a Breakaway Gap , which usually is a powerful sign that a new trend just started.
The blue line at $ 125.39 and the 21 ema are future supports if the price drops, and so far, we have no reversal or pullback sign.
All of this look good, and this may be the beginning of a new trend, but let’s look if the daily char follows the logic seen in the hourly chart:
Ok, AAPL hit our target at the 21 ema, as we were expecting in my previous analysis, and now is doing a good bullish sign over here.
The blue line is a Pivot Point , and AAPL did a breakout with a very good volume . This indicates that the bias is still bullish and so far, no pullback or reversal signs here as well.
Even if AAPL drops, the 21 ema and the purple and blue lines are there to hold the price. So, we have several supports and no meaningful resistance except the ATH. Let's see if it'll hit there!
So, what’s the next target for AAPL? If it keeps above the blue line, the ATH is the next target for us. And if you liked this analysis, please support it! And remember to follow me to keep in touch with my daily analyses!
Thank you very much!

ZS - Bull Pennant (Long) opportunityZS consolidated for 3 months below a resistence @ 163 before finally breaking up strongly on 3rd December, propelling it into all-time-all (ATH). This is significant as ATH stocks tend to trend for some time, having no prior "resistences" to suppress it's upward momentum.
It has been consolidating in a bull pennant for the past 2 weeks and is looking like it could be breaking out of this pennant in another week or so.
Long with initial stop a few ticks below 172 (the low of this bull pennant). Should it break, manage the trade with trailing stops.
Disclaimer: This is just my own analysis and opinion for discussion and is not a trade advice. Kindly do your own due diligence and trade according to your own risk tolerance. Thank you. Feel free to give me your thoughts ! :)

GBPUSD: Sell from the top to fill the gapHere as you can see the market is at a very critical area, which is a strong resistance zone.
--> Our target is to fill the gap at (220 pips).
--> Our Stop Loss both covers the previous high and gives an extra breathe for the market to reverse.
--> Risk to Reward is at 1:4.
HAVE FUN & HAPPY PROFITS ! ! !

For those who do not know which position to open ... BTC/USDT
Hello dear friends.
In the previous idea:
"W-TOP WHERE THE PRICE WILL GO"
I described with accuracy from which zones it is worth buying and in what range to work.
Now I will describe in more detail:
FLAT range
19015-19305
In order to be even more specific, you can break it down along the extreme peaks (19300 - 19000),
and you need to be extremely careful, because at 2h TF, you MAY make a false breakdown of the level 19450-19500, and from there, lower the price lower. And I will say that this will be of higher priority than entering a long position.
Since we have a CME margin target area.
and 100% of this margin at around - 18250 BTC / $
You can only open a long position if the price breaks out on the impulse and fixes there, at 4h TF LEVEL - 19550.
Only then long position, to update 19950 - 20275 - 20500
Why did I open a short position from 19200 without waiting for the breakdown of the lower boundary of the channel.
Because for me there are many obvious facts that tell me about the decline.
And several people who trade with me wrote messages that from Karl "the moon"
It is about going up, and that many do not agree with me that we will fall.
Perhaps I am not a wang, but I only trade as the market tells me to.
I expect after December 16, a strong and impulsive price decline.
In the meantime, we are flat.
because we have new targets for CME
we have a big gap in price
18100-19150
We have a triple top (maybe not at these marks), but I hope so, and we have
large imbalance in the market.
Market maker levels - strong ranges: 19275-19430.
AND
18400-18275

Huge Gap on GBP/USD - How to trade it?Gap formations work as important support or resistance levels. They hide behind a lot of unfilled pending orders waiting to be filled.
We will look for buying opportunities this week.

gbpusd open on a gapGAP made on sunday night
prefered to be closed first but it could make sometime to be filled
actual direction on short time is up
use money management in anytrade
this is same for all gbp pairs for now

Raiden Recourses looking BULLISHRaiden Resources Limited (ASX:RDN) is an ASX copper-gold exploration company focused on discovering large scale mineral deposits in the world class Tethyan region of Eastern Europe. Raiden operates in low cost and mining friendly jurisdiction’s which remain underexplored, seeking to systematically apply modern exploration techniques to discover Tier 1 projects.
Bullish Outlook:
- Falling Wedge Continuation Pattern
- Bullish Break of Downtrend Trendline
- Fractal and TB Fib Extension Targets Aligning
- Volume returning
- Fundamental News as Exploration Begins 09/12
Bearish notes:
- Unclosed GAP 0.023-0.025
"DISCLAIMER: NO ADVICE. The information presented here is general in nature and is for education purposes only. Nothing should be considered to be advice. You should consult with an appropriate professional for specific advice tailored to your situation."
