Plan for 15th March 2024Nifty future and banknifty future analysis and intraday plan in kannada.
This video is for information/education purpose only. you are 100% responsible for any actions you take by reading/viewing this post.
please consult your financial advisor before taking any action.
----Vinaykumar hiremath, CMT
Gap

Review and plan for 11th March 2024Nifty future and banknifty future analysis and intraday plan in kannada.
This video is for information/education purpose only. you are 100% responsible for any actions you take by reading/viewing this post.
please consult your financial advisor before taking any action.
----Vinaykumar hiremath, CMT

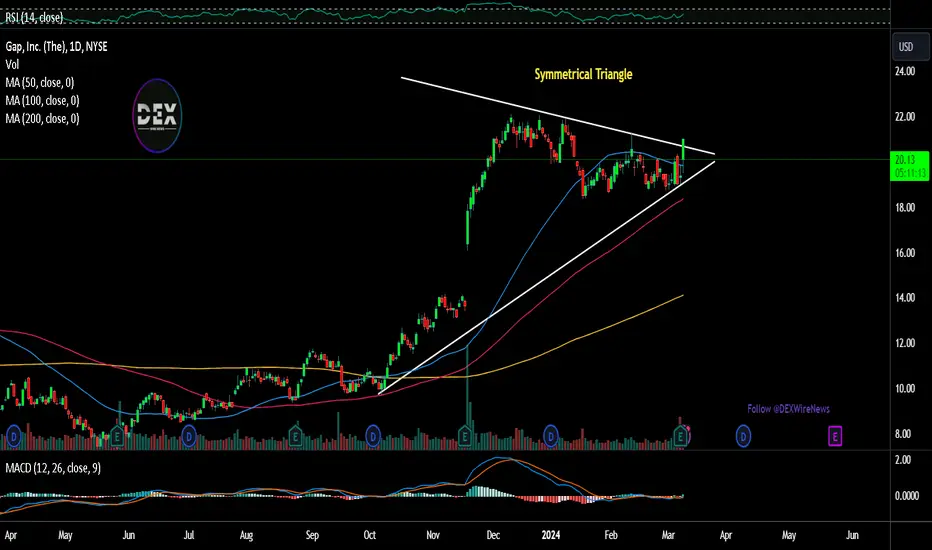
Gap Inc. Steers Towards Success: A Tale of Turnaround and TriumpIn a retail landscape fraught with challenges, Gap Inc., ( NYSE:GPS ) emerges as a beacon of hope, signaling a turnaround in progress. The apparel giant's fourth-quarter earnings report has sent ripples of optimism through the market, with shares soaring on the back of stellar performance and promising outlook.
Under the stewardship of Chief Executive Richard Dickson, Gap Inc., ( NYSE:GPS ) has embarked on a transformative journey, seeking to redefine its identity and reignite growth amidst a backdrop of industry upheaval. Dickson's strategic vision and decisive leadership have been instrumental in steering the company towards greener pastures, marking a stark departure from years of managerial instability and operational setbacks.
The latest earnings release paints a picture of resilience and resurgence, with Gap ( NYSE:GPS ) exceeding analyst expectations on multiple fronts. Earnings per share, excluding certain items, surged to 49 cents, more than doubling the consensus estimate. Moreover, the company delivered robust revenue and comparable sales figures, underscoring the efficacy of its turnaround initiatives.
Central to Gap's resurgence strategy is a concerted focus on brand revitalization and customer engagement. Investments in marketing across its portfolio of brands, including Gap, Old Navy, Banana Republic, and Athleta, have yielded promising results, breathing new life into once-flagging segments of the business.
Of particular note is the remarkable turnaround at Old Navy, Gap's largest brand, which witnessed a consecutive 2% increase in comparable sales, signaling a reversal of fortunes after six quarters of decline. Similarly, the Gap brand saw a commendable 4% rise in same-store sales, surpassing analyst expectations and marking its most significant uptick in over a year.
While progress has been palpable across key brands, challenges persist in Gap's smaller segments. Banana Republic, though showing signs of improvement with a 4% decline in same-store sales compared to an 8% drop in the prior quarter, continues to grapple with the complexities of its brand elevation efforts. Nevertheless, optimism abounds as the company remains steadfast in its commitment to driving positive change.
Athleta, Gap's ( NYSE:GPS ) foray into the activewear market, faces its own set of hurdles, with a 10% drop in comparable sales attributed to product marketing and experience missteps. Despite these challenges, Dickson remains bullish on Athleta's prospects, projecting a rebound in comparable sales by the latter half of 2024.
Technical Standpoint
With a moderate Relative Strength Index (RSI) of 54.18 NYSE:GPS is trading above its 200-day Moving Average with the stock on the verge of a bullish breakout forming a Symmetrical Triangle chart pattern.
As Gap Inc. ( NYSE:GPS ) navigates the torrents of the retail landscape, its journey toward sustainable growth serves as a testament to resilience, adaptability, and unwavering determination. With a seasoned leader at the helm and a renewed sense of purpose, Gap ( NYSE:GPS ) stands poised to write the next chapter of its storied legacy—one defined by triumph over adversity and a steadfast commitment to delivering value to shareholders and customers alike.
GBPAUD back in play for the short to fill the HTF gap.Glossary:
VA – Value Area
Liq.P – Liquidity Point
PiPo – Pivot Point
BO – Break-Out
H1 – Hourly Time-frame
M15 – 15min Time-frame
LTF – Lower Time-frame
HTF – Higher Time-frame
Magenta horizontal Ray – Area of Interest
Magenta rectangle – Gap / Area of Significance
***********
After tapping into the previous swing high and a strong impulsive move to the downside, price formed
two smaller consolidations before starting to form a larger bear-flag.
Waiting for a retest of the small Liq.P, finishing the bear-flag and a push down to the VA to fill the HTF Gap.

NZDUSD Short to fill the GapGlossary:
VA – Value Area
Liq.P – Liquidity Point
PiPo – Pivot Point
BO – Break-Out
H1 – Hourly Time-frame
M15 – 15min Time-frame
LTF – Lower Time-frame
HTF – Higher Time-frame
Magenta horizontal Ray – Area of Interest
Magenta rectangle – Gap / Area of Significance
***********
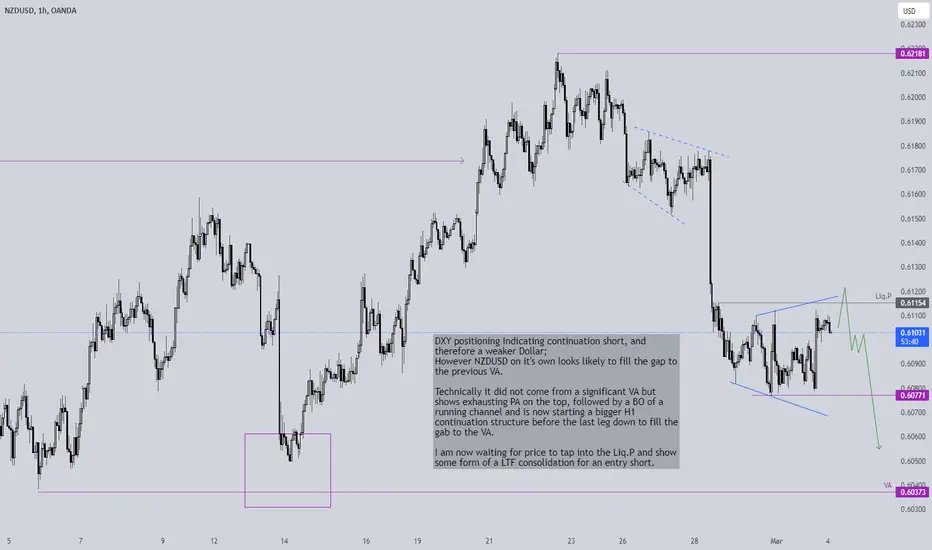
2024 – 03 – 04 NZDUSD short
DXY positioning indicating continuation short, and therefore a weaker Dollar;
However NZDUSD on it's own looks likely to fill the gap to the previous VA.
Technically it did not come from a significant VA but shows exhausting PA on the top, followed by a BO of a running channel and is now starting a bigger H1 continuation structure before the last leg down to fill the gab to the VA.
I am now waiting for price to tap into the Liq.P and show some form of a LTF consolidation for an entry short.
Review and plan for 23rd February 2024nNifty future and banknifty future analysis and intraday plan in kannada.
This video is for information/education purpose only. you are 100% responsible for any actions you take by reading/viewing this post.
please consult your financial advisor before taking any action.
----Vinaykumar hiremath, CMT

Has anyone looked at the monthly charts?After reviewing the monthly chart, I made an observation: Bitcoin has indeed filled the monthly fair value gap (FVG), which explains the recent deceleration in momentum. Now, it remains to be seen whether we will experience a breakthrough or a retracement to our monthly discount zone. Coincidentally, within the discount zone, I've identified a monthly Balanced Price Range (BPR), indicating overlapping fair value gaps. Additionally, there's a breaker block present. With these elements in play, the potential for a significant move exists, potentially catalyzed by a news event.

Review and plan for 14th February 2024Nifty future and banknifty future analysis and intraday plan in kannada.
This video is for information/education purpose only. you are 100% responsible for any actions you take by reading/viewing this post.
please consult your financial advisor before taking any action.
----Vinaykumar hiremath, CMT

Review and plan for 12th February 2024Nifty future and banknifty future analysis and intraday plan in kannada.
This video is for information/education purpose only. you are 100% responsible for any actions you take by reading/viewing this post.
please consult your financial advisor before taking any action.
----Vinaykumar hiremath, CMT

HALLIBURTON Weekly Technical AnalysisHAL Weekly - No RECOMMENDATION or ADVICE Status / EDUCATIONAL only - Support, Resistance, Confluence, Clusters, Trend Lines , Parallel Chanel, Fibonacci, Gap, Triangle - Hope it Helps, Good Luck
DISCLAIMER - This communication is not trading or investment advice, recommendation or solicitation to buy, sell or hold any investment product is provided for informational, educational and research purposes only. All illustrations, forecasts or hypothetical data are for illustrative purposes only. The author or persons involved in the conception, production and distribution of this material cannot be held responsible for transactions or any financial loss or damages resulting directly or indirectly from the use or application of any concepts or information contained in or derived from this material. Past performance is not indicative of future results. Any person who chooses to use this information as a basis for their trading assumes all the liability and risk for themselves.

Review and plan for 7th February Nifty future and banknifty future analysis and intraday plan in kannada.
This video is for information/education purpose only. you are 100% responsible for any actions you take by reading/viewing this post.
please consult your financial advisor before taking any action.
----Vinaykumar hiremath, CMT

Gap closed on Bitcoin futures.With a candle that can be seen as a hammer, the price closed the gap by taking buy orders that were in the majority compared to sells, the candle is evident. In the related analysis I had written that it would be a very useful level, given that gaps often work well as supports or resistances, in this case it has become a very useful support, a perforation of the minimum of this candle would be a sign of weakness, but let's see better the context in which we find ourselves.
At this moment the price of btc is correcting in the medium term (2/3 months), therefore faced with a movement of approximately 88 days, a correction could occur (which has drawn a new high) linked to this cycle, of course if if the scenario changes, the session count would also change. So far the price is moving higher and there is no reason to think otherwise, so my bullish hypothesis or scenario continues to be useful in understanding where we are now. Possible even very violent increases could appear before long, we are at the end of this correction which has not yet given the final blow, the classic strong decline, unless it was this weekly candle which we can call hammer, the last decline of the correction. Now we need caution and above all trust in the trend.

BTC: Long at Breakout or Sell at Breaker Block?Assessing two potential scenarios for BTC, my bias leans bullish. The recent closure of the CME gap and successful liquidity sweep above the gap contribute to this optimistic outlook.
However, a critical factor to consider is the breaker block, particularly as it aligns with a corrective wave level, creating confluence for the short side. Monitoring the market's response to this level is crucial, as a retracement might occur, possibly heading towards the 36k-32k range. Staying adaptable to evolving market dynamics is key in navigating these scenarios.

Review and plan for 2nd February 2024 Nifty future and banknifty future analysis and intraday plan in kannada.
This video is for information/education purpose only. you are 100% responsible for any actions you take by reading/viewing this post.
please consult your financial advisor before taking any action.
----Vinaykumar hiremath, CMT

BTC CME GAP- Just posting to monitor the new gap.
- Not an Analysis.
- This new gap can be taken back fast or can be taken back later at next bear market.
- The Legend of the Gap.
Happy Tr4Ding !

Imbalance Expert : Guide for mastering imabalance'sCryptocurrency trading is an intricate dance, where understanding and interpreting market imbalances can provide traders with a competitive edge. This comprehensive guide aims to demystify the art of trading imbalances, catering to both beginners and seasoned traders. Through a detailed exploration of strategies and considerations, we'll delve into the world of market dynamics, emphasizing the importance of a holistic approach to trading.
First example has cool reason to go higher ( EQUAL HIGHS ) and big liquidity pool below
Section 1: Understanding Imbalances
1.1 Defining Market Imbalances:
Explore the concept of imbalances in the cryptocurrency market.
Differentiate between bullish and bearish imbalances.
1.2 Reading the Signs:
Learn to identify imbalances on various timeframes.
Utilize technical indicators and chart patterns to confirm imbalances.
Section 2: The Anatomy of Imbalance Trading
2.1 Spotting Imbalances in Price Action:
Analyze real-world examples of imbalances using provided screenshots.
Understand how imbalances manifest in different market conditions.
2.2 Tools of the Trade:
Explore popular tools like volume analysis, order flow, and market profile to complement imbalance trading.
Highlight the role of moving averages and trendlines in confirming imbalances.
Section 3: Strategies for Imbalance Trading
3.1 Swing Trading with Imbalances:
Discover how to swing trade using imbalances as entry and exit signals.
Explore risk management techniques tailored for swing trading.
3.2 Scalping Opportunities:
Uncover strategies for intraday trading based on short-term imbalances.
Discuss the importance of quick decision-making and tight risk control.
Section 4: Advanced Considerations
4.1 Macro and Micro Analysis:
Emphasize the need to consider both macroeconomic trends and micro-level price action.
Discuss how macroeconomic events can create imbalances with lasting effects.
4.2 Market Sentiment and News Analysis:
Incorporate sentiment analysis and news events into the overall imbalance trading strategy.
Understand how sudden shifts in sentiment can create imbalances.
Section 5: Risk Management and Psychology
5.1 Risk Management Strategies:
Explore risk management techniques specific to trading imbalances.
Discuss the importance of position sizing and setting stop-loss orders.
5.2 Mastering Emotional Discipline:
Address the psychological aspects of trading and how emotions can impact decision-making.
Provide practical tips for maintaining discipline during trading.
Conclusion: The Art and Science of Imbalance Trading
In conclusion, mastering the art of trading imbalances requires a combination of technical expertise, strategic thinking, and emotional resilience. Whether you are a beginner looking to enter the world of cryptocurrency trading or a seasoned trader seeking new insights, this guide aims to equip you with the knowledge and tools necessary to navigate the dynamic landscape of imbalance trading. Remember, success in trading is an ongoing journey that requires continuous learning and adaptation to evolving market conditions.
💡 Imbalances Decoded | 📊 Tools of the Trade | 🚀 Strategies for Success | 🧠 Risk Management Mastery
💬 Share your insights: What are your experiences with trading imbalances, and what additional strategies have you found effective? 🌐✨

BTC Finally about to fill the CME GapI noticed this CME Gap since 2 months ago and with all the ETF news, I thought it would never reach it again, but it did lol

INTEL Daily Technical AnalysisINTC Daily - No RECOMMENDATION or ADVICE Status / EDUCATIONAL only - Support, Resistance, Trend Lines, Cluster, Confluence, Pitchfork, Fibonacci Retracement, Gap - Hope it Helps, Good Luck
DISCLAIMER - This communication is not trading or investment advice, recommendation or solicitation to buy, sell or hold any investment product is provided for informational, educational and research purposes only. All illustrations, forecasts or hypothetical data are for illustrative purposes only. The author or persons involved in the conception, production and distribution of this material cannot be held responsible for transactions or any financial loss or damages resulting directly or indirectly from the use or application of any concepts or information contained in or derived from this material. Past performance is not indicative of future results. Any person who chooses to use this information as a basis for their trading assumes all the liability and risk for themselves.

Fair Value Gap Trading StrategyFair Value Gap Trading Strategy
To implementing a fair value gap as a trading strategy you need to understand these three basic components of this trading strategy.
Time
Liquidity Hunt
Market Structure Shift
Fair Value Gap
Let’s begin by discussing the importance of time in trading. According to ICT Trader, time is considered to be fractal, meaning that what happens on higher time frames is reflected in lower time frames if studied in the proper context.
In this context, fractal refers to the idea that patterns and behaviors observed on longer time frames, such as daily or weekly charts, can be seen in shorter time frames, like hourly or minute charts.
By studying price action and market behavior across different time frames, traders can gain a deeper understanding of market dynamics and potentially identify profitable trading opportunities.
Time indeed holds significant importance in the fair value gap trading strategy, particularly when it comes to identifying favorable trading setups. Despite the forex market being open 24 hours a day, not all times present ideal conditions for executing fair value gap trades. That’s where the concept of ICT Kill Zones comes into play.
ICT Kill Zones
ICT Kill Zones refer to specific time periods during the day that have been observed to offer higher probability trading opportunities. These zones are associated with the entry of smart money, which are institutional or banks who have the ability to influence market direction.
In short, ICT Kill Zones correspond to specific time periods during the day that are particularly relevant for trading activities. These zones include the London Open, London Close, New York Open, and New York Close.
Traders using the fair value gap trading strategy often focus on these times as they tend to offer higher probability trading setups. The ICT Kill Zones are associated with the entry of smart money and can provide enhanced opportunities for traders to capitalize on market movements. By aligning their trading activities with these specific time periods, traders aim to improve their chances of success.
Liquidity in FVG Trading Strategy
Liquidity in the market often takes the form of buy stops and sell stops.market makers or smart money intentionally trap retail traders by manipulating prices to trigger their stop losses.
The idea is that they move the market in one direction to hunt for stop losses, causing retail traders to place orders in the false direction and set their stop losses at key levels. After the stop loss hunt, the market reverses in the opposite direction, benefiting the smart money.
Let’s analyze the above chart from a retail trader’s perspective. When we observe the chart, we notice that the price levels between 44240 and 44280 have proven to be strong resistance in the past.
Based on this observation, many retail traders might place their selling pending orders to anticipate of a price reversal at these levels. To manage their risk, they would likely set their stop loss orders just above this resistance area.
What is done by market makers or smart money,they could manipulate the market by initially pushing the price upward, deliberately triggering the stop loss orders placed by retail traders. This action would cause some retail traders to think that a breakout is occurring and prompt them to place buying orders while setting their stop losses at levels below the resistance area.
Once the stop loss orders have been hunted and triggered, the market makers or smart money may then reverse the price direction.
Enhancing Trading Success with the Fair Value Gap Entry Strategy
After a liquidity hunt on a higher time frame, you suggest switching to lower time frames such as 15 minutes, 5 minutes, 3 minutes, or even 1 minute to identify certain patterns that may emerge following the stop loss hunt. These patterns include:
1.Sudden or sharp price movements: Following the liquidity hunt, you may observe rapid and significant price fluctuations on the lower time frames.
This sharp movement causing market structure shift and provide an extra confluence.
2. Fair value gap (FVG): Look for gaps between the current price and the fair value of the asset. The fair value represents the equilibrium price based on various factors. Identify instances where the market price deviates significantly from this fair value.
3. Entry position based on the Fair Value Gap strategy: Once you spot a fair value gap pattern after the liquidity hunt, you can consider taking a position in anticipation of the market filling that gap. The expectation is that the market will eventually return to the fair value price.
It’s important to carefully train your eyes to recognize these patterns after a liquidity hunt and patiently wait for the market to come back and fill the identified gap. Once you have identified a suitable entry position, you can place your stop loss order above the first candle to manage your risk.
Please note that implementing such strategies requires careful analysis, experience, and a deep understanding of the specific market you are trading. It’s crucial to conduct thorough research, backtest your strategy, and consider other factors that may influence price movements before making any trading decisions.

Review and plan for 19th January 2024Nifty future and banknifty future analysis and intraday plan in kannada.
This video is for information/education purpose only. you are 100% responsible for any actions you take by reading/viewing this post.
please consult your financial advisor before taking any action.
----Vinaykumar hiremath, CMT

Review and plan for 15th January 2024Nifty future and banknifty future analysis and intraday plan in kannada.
This video is for information/education purpose only. you are 100% responsible for any actions you take by reading/viewing this post.
please consult your financial advisor before taking any action.
----Vinaykumar hiremath, CMT

Review & plan for 9th January 2024Nifty future and banknifty future analysis and intraday plan in kannada.
This video is for information/education purpose only. you are 100% responsible for any actions you take by reading/viewing this post.
please consult your financial advisor before taking any action.
----Vinaykumar hiremath, CMT

Boeing BANotable Gaps on NYSE:BA for reference.
After news pre market sell off can continue. great entry below 200 but we don't get there today.
