High Risk BTC Short TO Fill The CME GapHigh Risk BTC Short TO Fill The CME Gap
No bones about it this is a pretty high risk play - although it is looking like this big cme gap might get filled for the short.
It is best to be agile on this one in case there is an aggressive bounce
Gap

$ISRG buy or sell?Intuitive Surgical is in the Medical-Systems/Equip Group, develops an advanced surgical system designed to improve open surgery and minimally invasive surgery.
After the earnings gap up, price has been still going up but volume has been drecreasing along with momentum.
This bearish divergnece is signaling a needed pause for $NASDAQ:ISRG.
Even if breaks above $309 before correcting I wouldn't buy it as I don't expect it would have a good follow through.
I'll keep this stock in the watchlist and wait for a proper breakout.

NFLX Watching for another BreakoutNFLX gapped up on the morning of 5/18 with high momentum and a volume spike both of
which faded by mid-day shown on this 15- minute chart. Since then price has been in a narrow
consolidation range centered about the POC line of the multisession volume profile. Price is
in the fair value area between the mean anchored VWAP and the +1 STD band. The zero lag
MACD is confirmatory for a trend resting in consolidation
I will watch for green candles in a row with the second having more range than the first. I will
check to see if the relative volume is 2X the running mean. If so, I will enter and try to get
the early breakout. Stop loss will be $365 below the POC line. I will exit upon seeing upper
wicks and volume falling back down to the mean. My expectation is for a quick 3 to 5 percent
trade with a R:R of better than 10:!.


Infosys going back to 1200?INFY has been in a bearish structure on the daily chart since March 23. It had gapped down to 1190 levels in April after a bad surprise in results. It has pulled back to the 1280 area which is the base of the gap. If selling pressure continues, a short position could be considered keeping the following levels in mind:
SHORT BELOW: 1254.25
STOP LOSS: 1279
TARGET 1: 1229.50
TARGET 2: 1204.75
Please do wait for at least a 15 min candle close below the "SHORT BELOW" level before initiating the trade.
_______________________________________________________________________________________________________________________________

TSLA: Another Target Hit. Be careful now.• Today TSLA hit our technical target at $177.65, successfully filling the previous gap;
• Now, it seems it is starting to lose momentum, but it is too soon to tell if we’ll trigger a top signal around this resistance (like a Shooting Star pattern, or maybe a Gravestone Doji?);
• If yes, then a pullback is likely to happen, but as long as TSLA remains above its 21 ema, the main bias will remain bullish;
• On the weekly chart, it is easy to see why it is losing momentum, as we just reached the 21 ema;
• The 21 ema on the weekly chart is always a secondary key point to me, and I always prefer to work with support/resistance lines seen on the price, but sometimes this indicator reinforces our reading;
• It would be important to see TSLA closing above $177.65 today, in order to improve the chances of a bullish continuation. Again, it all depends on today’s close.
I’ll keep you updated on this. Remember to follow me to keep in touch with my daily analysis.

SPX Daily Gap, H&S formed if filledThere's a gap on the SPX daily chart. If the gap fills it will put us right near the daily 200MA and complete a bearish Head and Shoulders formation, which would have a target down near the Oct lows.

SPX: A Short-Term Congestion | What's Next?• The SPX is trading inside a range, between 4,148 and 4,099. Only a breakout will bring something new;
• The 4,099 is a Double Bottom, and if the index loses this key support, we might see it correcting to the next support line, at 4,029, filling the gap at 4,072 in the process;
• However, the SPX is still trading above the 21 ema on the daily chart, indicating that it has decent chances of resuming the bullish sentiment – it just has to break the 4,148 to confirm this thesis;
• In this scenario, mid-term speaking, the next technical resistance at 4,195 would become our next target;
• For now, let’s wait for more signals.
I’ll keep you updated on this. Remember to follow me to keep in touch with my daily analysis.

TSLA: Last Chance to React.• TSLA is once again reacting above our key support line at $165, which we already mentioned yesterday (the link to my previous analysis is below this post, as usual);
• Only if TSLA loses the $165 we would see a sharper correction ahead, probably to fill the previous gap around $161 (yellow square);
• On the daily chart, we see why the $165 is so important: This key point was a previous resistance level, and now it is acting as a support (Principle of Polarity);
• By losing this key support, TSLA would reject the previous bullish pivot point (previous higher high/low), making a new low;
• In this case, the mid-term target is at $154. I’ll keep you updated on this, as usual.
I’ll keep you updated on this. Remember to follow me to keep in touch with my daily analysis.

TSLA: Dangerous Top Signal.• TSLA hit our target area last Friday, around $177, and it is now triggering a Bearish Engulfing candlestick pattern on the daily chart. I mentioned this target on our previous TSLA analysis – link below this post;
• The problem is that TSLA triggered this Bearish Engulfing under the $177 resistance, and it is back under the 21 ema as well, indicating that TSLA is very weak at the moment;
• On the daily chart, the next support area is around $154 (black line).
• On the 1h chart, there’s a short-term support line at $165, which was a previous resistance level;
• Below this support, there’s an open gap at $161, and another support line at $158. For now, it appears the $165 line is our main support level, as TSLA is trying to react this morning.
I’ll keep you updated on this. Remember to follow me to keep in touch with my daily analysis.

DUOL - buy the dipsDUOL broke out of a base formation neckline @ 114 strongly on 2nd March this year and then did a classic retest of the neckline on 13 March, affirming that the neckline @ 114 has now become support. It then went on to hit a high of 147 before retracing all the way back down 116.82 (triggering a trailing stop loss @ 130).
A bullish morning star pattern than formed on 5th May and a re-entry was triggered on 6th May. However with earnings reporting on 9th May, one has to decide whether it was worthwhile to take the risk to long here. With the stock already dipping 20% from it's high of 147, the odds of an earnings surprise to the upside could be higher. Nevertheless, risking no more than just a small position (before earnings) seemed prudent.
Now that earnings is out of the way (upside surprise), there is a chance it could break it's last recent high of 147 in the near term. On the bigger picture, the stock is now on an uptrend and there is room to rise in the coming months. However market could continue to be volatile hence it could be less risky to buy any near term dips rather than to chase breakouts.
Learning to manage a position in such volatile conditions is paramount. I would still place trailing stops and am prepared to get stopped out but re-enter at the next bullish trigger, but only if the chart still looks bullish on the bigger picture.
Disclaimer: Just my 2 cents and not a trade advice. Kindly do your own due diligence and trade according to your own risk tolerance and don't forget that money management is important! Take care and Good Luck!

TSLA: Turning Bullish Again.• TSLA stock looks impressive, as it is doing an important reaction today, trying to reject the Hanging Man candlestick pattern from Monday;
• In theory a Hanging Man pattern is a famous top signal, however, evidence suggests that this pattern acts as a bullish continuation roughly 59% of the time (BULKOWSKI, Thomas. Encyclopedia of Candlestick Patterns, p. 365);
• Now, TSLA is trying to resume the bullish momentum. To reject any possible top signal, it is important to see it breaking Monday’s high as soon as possible - otherwise, it might lose momentum;
• What’s more, it seems it is heading to its next technical target, the open gap at $177.
• The weekly chart suggests a bounce to higher levels, maybe to the purple trend line again;
• This thesis will be valid as long as the daily chart maintains its bullish bias, and keeps above its 21 ema;
I’ll keep you updated on this. Remember to follow me to keep in touch with my daily analysis.

NIO: Trading in a Dangerous Area; Watch Out For These Key Points• NIO is trying to reverse the trend on the 1h chart, as now it is above the 21 ema, which is ascending;
• What’s more, NIO just filled one of its gaps at $8.29, but it seems this area is acting as a resistance now;
• The problem is that we don’t see a clear bullish structure, like a higher high/low yet. This gives the impression that this was just a short-term rally, not a real bullish reversal;
• To make things worse, NIO is on the verge of losing its previous support line at $8.03, and this could completely frustrate this rally;
• Therefore, NIO must close above this key point today, in order to avoid a bearish continuation;
• On the other hand, it seems that the $8.29 is our key resistance, and only by breaking it, NIO would actually turn bullish again. In this case, it could fill all the previous gaps and hit the $9.47 again.
• On the daily chart we see that the 21 ema acted as a resistance, and NIO failed in breaking it. This 21 ema is at $8.33 right now, close to the $8.29 seen in the 1h chart, making this area a dual-resistance level;
• Therefore, it is crucial for NIO to break this resistance as soon as possible, in order to trigger a meaningful bullish pattern.
I’ll keep you updated on this. Remember to follow me to keep in touch with my daily analysis.

TSLA: Complete Multiple Time Frame Analysis (H, D and W charts).• After breaking its main resistance lines in the 1h chart, TSLA is in a bull trend, doing higher highs/lows, while trading above the 21 ema;
• Since the short-term momentum is bullish, it should hit its next technical target at $177.65 – in theory;
• The previous resistance at $169.60 (red line) seems to be acting as a support level today, which corroborates the Principle of Polarity in technical analysis, which states that previous support levels will work as future resistance levels and vice-versa;
• Only if TSLA loses this red line, we might see this bullish momentum frustrated, in the short-term.
• In the daily chart we see that TSLA just broke its 21 ema, indicating that it wants to reverse the mid-term bear trend;
• What’s more, the 21 ema is very close to the red line seen in the 1h chart, making the area around $170 a dual-support level in different time-frames;
• In addition, the $177.65, the next technical resistance line seen in the 1h chart is an open gap seen in the daily chart, from the previous earnings;
• As long as TSLA keeps trading above its dual-support level, no pullback or reversal will materialize, and the bull trend will persist.
• Since TSLA is bouncing after it hit a critical support line in the weekly chart at $164 (red line), in theory this bounce should persist, even considering the possibility of a short-term pullback;
• Only if it loses the $164 we would see the recent bullish signals frustrated;
• In this case, we could easily close the gap at $146, as seen in the daily chart.
I’ll keep you updated on this. Remember to follow me to keep in touch with my daily analysis.

is trading view technical analysis reliable ?well hi again , although i usually don't trade any other markets than crypto , but ;
at this moment , if u go into stock screener tab and look at #AAPL , u will find it's technical analysis to be "^BUY " but i dont think so ,
as it apears to me i see a head and shoulder pattern forming here , and i now predict a ITH at 169.70 point were then i think we will go down to that huge GAP down there .
but as i said im not an expert over here , but technical analysis is technical analysis , and this my friend does not look like an uptrend .
but we shall see which one is right then , me or tradingview ?


QQQ: Must React As Soon As Possible.• QQQ corrected to the 21 ema again, after filling the previous open gap at 322.08 (open since Aug 22, 2022);
• It is ok to see QQQ losing strength after reaching this key resistance, however, in order to maintain the bullish bias, the 21 ema must act as a support;
• If don’t, QQQ could easily seek the next support level, which is around 310, and this would frustrate the mid-term bullish bias;
• The trend is still bullish because QQQ isn’t doing lower highs/lows yet, and now it is right at the 21 ema again. There’s no bearish reversal signal on QQQ yet;
• On the other hand, there’s no bottom signal as well. QQQ must perform a bottom as soon as possible as it just reached its 21 ema in the daily chart. Only then, we’ll see a confirmation signal that the bull trend will resume.
I’ll keep you updated on this. Remember to follow me to keep in touch with my daily analysis.

TSLA: A Bottom Signal (Finally)?• TSLA has finally made a bottom signal above the support line at 154.76, indicating that it should jump to higher levels;
• The problem is the key point around 164, a previous support level that is acting as a resistance now. This is the same key point we mentioned in our previous TSLA analysis – the link is below this post, as usual;
• Also, despite the bearish signal, there is no bullish reversal signal (two different things) - as long as TSLA remains below 21 EMA, sentiment will remain bearish (medium-term);
• If TSLA loses support at 154.76, that would frustrate this bottom signal, and TSLA would just fill the gap at 146 next.
• On the 1-hour chart, we see that TSLA is reversing the trend, as it is making higher highs and higher lows. The 21 ema is still flat, and price is dancing around it, but TSLA has given us some promising signals in this time-frame;
• The line at 157 was the trigger point of a Double Bottom chart pattern (as evidenced by the red lines), and that line appears to be acting as support now;
• To see TSLA jump to higher levels on the daily chart, it must confirm a continuation on the 1-hour chart, which means it must react as soon as possible, preferably above the 157 line - otherwise, this bullish thesis may be frustrated;
• For now, the two key points are the support at 157 and the resistance at 164. A breakout in either direction could bring something new for us. I will keep you updated on this.
I will keep you updated on this. Remember to follow me for my daily analysis.

SKX - Cup & HandleSKX has trended above it's 200 day moving average since 11 Nov 2022 and began to consolidate in a mini cup pattern ("handle" if we look at the monthly timeframe) for the last 3 months. It has just broken above this mini cup neckline @ 49 strongly after earnings beat and is now heading towards a more significant neckline (54 - 56 zone). If it is able to break and stay above this major neckline, then there is room to go higher as it begin a new up trend.
Ideally we would like to see a minor pullback shortly after the breakup to retest and affirm that the neckline has become the new support. However this may or may not happen and we should manage the trade with trailing stops (usually placed at near term pivot lows, gap fill or some fib levels).
Disclaimer: Just my 2 cents and not a trade advice. Kindly do your own due diligence and trade according to your own risk tolerance and don't forget that money management (ie postion sizing, stop loss etc) is important! Take care and Good Luck!

TSLA: This is a Defining Moment.• Despite the bullish reaction this morning, TSLA is still in a bear trend, and it already lost the previous support line at 163.91, which I mentioned in my previous public analysis (link below this post);
• Now, the 163.91 is a short-term resistance line, which reinforces the bearish sentiment. TSLA won’t bounce to higher levels, like 176, while it is below this resistance;
• In the lack of bullish reversal patterns, the gap at 146 is our next mid-term target.
• In the weekly chart, TSLA is on the verge of losing a key support line, which has been acting as a support since January;
• There’s still time for a reaction, and if we see a bullish candlestick above this support TSLA could finally bounce again, but this reaction must occur as soon as possible – preferably this week;
• On the other hand, if TSLA loses this support line, then the bearish sentiment will prevail, and TSLA could get close to the 100 again (the next support line in the weekly chart, a long-term target);
• Therefore, this is a defining moment for TSLA stock, and we’ll have our answers very soon.
I’ll keep you updated on this. Remember to follow me to keep in touch with my daily analysis.

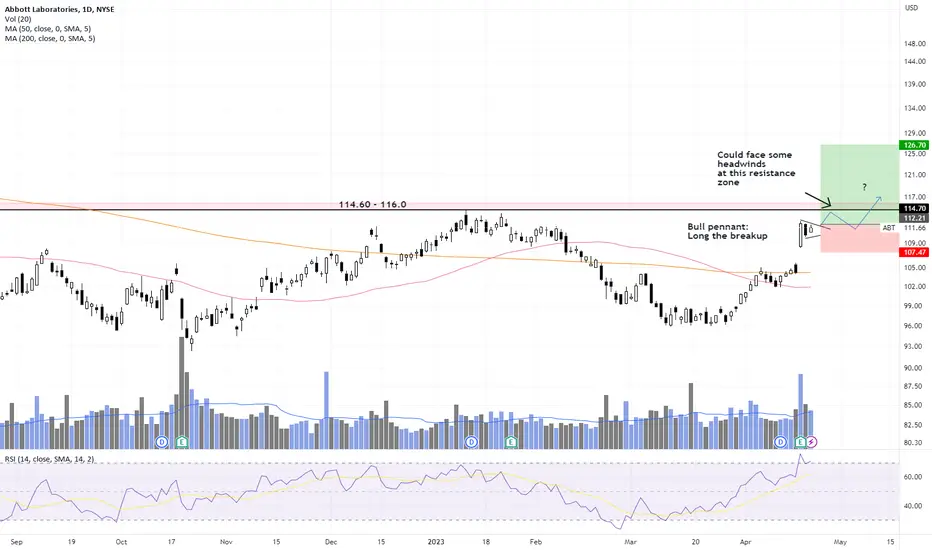
ABT = bull pennantABT had exhibited great momentum for the past few weeks with the recent earnings on 19 Apr propelling it to gap up on high volume.
It appears to be forming a bull pennant right now. It is possible to trade the breakup of this pennant (initial stop just below the gap up candle), however bear in mind that the overhead resistance at 114 - 116 might be difficult to overcome in the near term. Short term trade for time being. Let's see.
Disclaimer: Just my 2 cents and not a trade advice. Kindly do your own due diligence and trade according to your own risk tolerance and don't forget that money management is important! "Let winners run and cut losses short". Take care and Good Luck!
ONON - Still TrendingONON exhited strong price action since it's gap up after it's last earnings call on 21 Mar23 (pullbacks not withstanding). Volume continued to be good for the past 4 weeks with relative strength (relative to SPX) continuing to improve.
However one can consider to ride this stock managing with trailing stops (pivot lows, fib retracement levels, moving average etc) to see how far it can bring us.
Earnings is expected on 5 May, if it continues to run up till then, there is a possibility it could sell off after announcement (even on good news). Hence do be mindful of volality around then.

RRGB - Great price action so far (buy the next dip)RRGB has the hallmarks of a stock that could potentially be a great winner. It broke out of it's base formation on 1st March on earnings beat with a strong breakaway gap (Breakaway gaps signify the beginning of a new trend and does not get filled in the near term).
It then proceeded higher over the next few days before pulling back to the breakup level @ 10.60 on 14 Mar, and then bounced right off again from there. This classic "break up and retest" establishes the neckline as the new "resistence turned support".
If one had been watching this stock, going long shortly after this "retest" would have been ideal.
However, since it is likely the trend is still in early stage, any near term dip (eg to fib retracement levels of 38-50%, or formation of bull pennant or flag etc) would still be a good opportunity to long. Let's see if the opportunity presents soon.
Disclaimer: Just my 2 cents and not a trade advice. Kindly do your own due diligence and trade according to your own risk tolerance and don't forget that money management is important! Take care and Good Luck!
