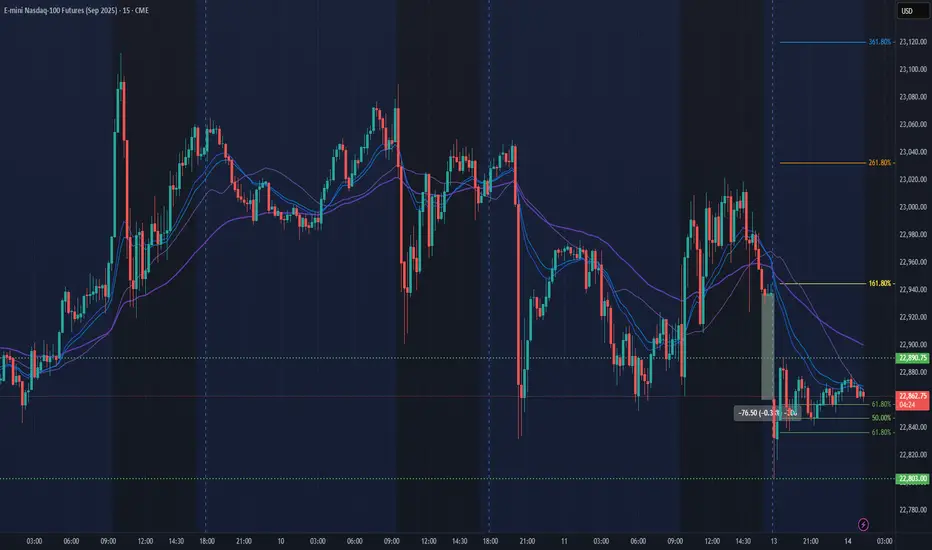
NQ Power Range Report with FIB Ext - 7/14/2025 SessionCME_MINI:NQU2025
- PR High: 22890.50
- PR Low: 22803.00
- NZ Spread: 195.0
No key scheduled economic events
0.33% weekend gap to previous week low, unfilled
Session Open Stats (As of 1:15 AM 7/14)
- Session Open ATR: 289.88
- Volume: 36K
- Open Int: 270K
- Trend Grade: Neutral
- From BA ATH: -1.0% (Rounded)
Key Levels (Rounded - Think of these as ranges)
- Long: 23239
- Mid: 21525
- Short: 20383
Keep in mind this is not speculation or a prediction. Only a report of the Power Range with Fib extensions for target hunting. Do your DD! You determine your risk tolerance. You are fully capable of making your own decisions.
BA: Back Adjusted
BuZ/BeZ: Bull Zone / Bear Zone
NZ: Neutral Zone
Gapdown
Review and plan for 24th February 2025Nifty future and banknifty future analysis and intraday plan.
This video is for information/education purpose only. you are 100% responsible for any actions you take by reading/viewing this post.
please consult your financial advisor before taking any action.
----Vinaykumar hiremath, CMT

Breaking: QUALCOMM ($QCOM) Shares Dip 5% In Premarket tradingShares in Qualcomm fell more than 5% in Thursdays premarket trading as a disappointing forecast for no growth in its patent licensing business overshadowed a higher-than-expected outlook for sales and profits.
The shares fell 4.2% in extended trading on Wednesday, having closed up 1.6% on the day in regular hours. Qualcomm stock is up 14.5% this year.
Despite the poor results It is pertinent to note that In 2024, QUALCOMM's revenue was $38.96 billion, an increase of 8.77% compared to the previous year's $35.82 billion. Earnings were $10.14 billion, an increase of 40.24%.
Analyst Forecast
According to 27 analysts, the average rating for QCOM stock is "Buy." The 12-month stock price forecast is $207.25, which is an increase of 17.85% from the latest price.
Technical Outlook
As of the time of writing, (NASDAQ: NASDAQ:QCOM ) stock is down 5.11% in Thursday's premarket trading with recent trading session closing with a moderate RSI of 66 however there will be an impediment today on the growth of NASDAQ:QCOM as a gap down is inevitable which is a bearish pattern that leads to further dip.
In the case of extreme selling pressure, immediate support lies in the 61.8% fib retracement level. A dip to this could set NASDAQ:QCOM on a bullish course as liquidity has being swept on recent dip.

Breaking: Alphabet ($GOOG) Shares Drop 7% in PremarketAlphabet Inc. (NASDAQ: NASDAQ:GOOG ) witnessed a significant 7% drop in premarket trading on Wednesday, driven by investor concerns over slowing cloud growth and the tech giant’s hefty $75 billion investment into artificial intelligence (AI) infrastructure. This figure far exceeded Wall Street’s projected $58 billion, raising doubts about the necessity and efficiency of such high spending.
AI Investment and Competitive Pressure
Alphabet has been aggressively investing in AI research and its integration across Google Search, Cloud services, and other platforms. However, the emergence of China’s low-cost DeepSeek AI model—which reportedly rivals leading U.S. AI models—has triggered discussions about whether Big Tech companies need to allocate billions toward AI advancements.
Cloud Growth Concerns
Alphabet's cloud division reported a 30% revenue increase to $11.96 billion in Q4, but this marked a slowdown compared to the 35% growth in Q3. In contrast, Microsoft Azure saw a 31% increase, while Amazon Web Services (AMZN) is projected to post only a 19% rise. Despite the slowdown, analysts believe the surging demand for AI-powered cloud computing will keep the long-term outlook positive for Alphabet’s cloud business.
Advertising Challenges
Beyond AI and cloud investments, Alphabet is grappling with fierce competition in the digital advertising space. With marketers increasingly shifting to social media-driven ad platforms like Meta’s Facebook and Instagram, and ByteDance’s TikTok, Google’s traditional ad model faces mounting pressure.
Technical Analysis
At the time of writing, NASDAQ:GOOG shares are down 6.75%, signaling a potential bearish continuation pattern. The stock appears poised to form a gap-down pattern, a bearish technical indicator that may lead to further downside pressure.
- Support Levels:* The first minor support lies at $197, aligning with the 78.6% Fibonacci retracement level. A breakdown below this level could result in gap-filling towards $185-$190.
- Major Structural Support: The BOS (Break of Structure) level is set at $155. A dip to this level could trigger further bearish sentiment and result in deeper losses.
- Moving Averages: Despite the premarket decline, NASDAQ:GOOG remains above key moving averages, suggesting that the broader trend remains bullish unless further downside momentum builds.
- RSI Positioning: Prior to this drop, the Relative Strength Index (RSI) was at 64, indicating that the stock was not overbought. This means the decline is not necessarily a reaction to overvaluation but rather a response to external market forces and investor sentiment.
Market Sentiment and Analyst Outlook
While some brokerage firms have cut their price targets on Alphabet, the median price target now stands at $220—still above its current premarket trading price of $191.20. Alphabet’s stock had gained 9% in 2024 before this drop, outperforming Amazon’s 10.3% gain and Microsoft’s -2.2% decline.
Conclusion
Despite the current dip, Alphabet’s long-term prospects in AI and cloud computing remain strong. The significant AI investment could prove to be a long-term advantage if it strengthens Alphabet’s competitive positioning. However, traders should closely monitor key support levels ($197 and $155) and whether the stock can hold above key moving averages.
For long-term investors, the recent drop could present a buying opportunity, but in the short term, further downside volatility is possible as market sentiment adjusts to Alphabet’s spending strategy. The coming days will be crucial in determining whether NASDAQ:GOOG can recover swiftly or continue its downward trajectory.

NQ Power Range Report with FIB Ext - 2/3/2025 SessionCME_MINI:NQH2025
- PR High: 21200.00
- PR Low: 20943.00
- NZ Spread: 574.5
Key scheduled economic events:
09:45 | S&P Global Manufacturing PMI
10:00 | ISM Manufacturing PMI
ISM Manufacturing Prices
Another wide weekend gap, setting stage for expected excitement for the week
- Touch of 21000 long-term inventory
- Auctioning inside nearly 500 point wick from Jan 27
Session Open Stats (As of 12:45 AM 2/3)
- Weekend Gap: -1.72% (open < 21200)
- Gap 10/30/23 +0.47%
- Session Open ATR: 436.60
- Volume: 83K
- Open Int: 255K
- Trend Grade: Bull
- From BA ATH: -6.4% (Rounded)
Key Levels (Rounded - Think of these as ranges)
- Long: 22667
- Mid: 21525
- Short: 19814
Keep in mind this is not speculation or a prediction. Only a report of the Power Range with Fib extensions for target hunting. Do your DD! You determine your risk tolerance. You are fully capable of making your own decisions.
BA: Back Adjusted
BuZ/BeZ: Bull Zone / Bear Zone
NZ: Neutral Zone

NQ Power Range Report with FIB Ext - 1/27/2025 SessionCME_MINI:NQH2025
- PR High: 21771.00
- PR Low: 21633.00
- NZ Spread: 308.0
Key scheduled economic events:
10:00 | New Home Sales
Full economic calendar for the last week of the month
- Wide weekend gap down, yet to retrace
- Continued rotation off 22090s long-term pivot
- Value decline back below daily Keltner average cloud
- Nearing Jan 21 low (wick intraday rotation)
Session Open Stats (As of 1:15 AM 1/27)
- Weekend Gap: -0.62% (open > 21904)
- Gap 10/30/23 +0.47%
- Session Open ATR: 384.07
- Volume: 93K
- Open Int: 253K
- Trend Grade: Bull
- From BA ATH: -4.4% (Rounded)
Key Levels (Rounded - Think of these as ranges)
- Long: 22667
- Mid: 21525
- Short: 19814
Keep in mind this is not speculation or a prediction. Only a report of the Power Range with Fib extensions for target hunting. Do your DD! You determine your risk tolerance. You are fully capable of making your own decisions.
BA: Back Adjusted
BuZ/BeZ: Bull Zone / Bear Zone
NZ: Neutral Zone

Plan for 13th January 2025Nifty future and banknifty future analysis and intraday plan.
This video is for information/education purpose only. you are 100% responsible for any actions you take by reading/viewing this post.
please consult your financial advisor before taking any action.
----Vinaykumar hiremath, CMT

How to Trade Gap Up and Gap Down Opening? Full Guide
What is gap up and gap down in trading?
In this article, I will teach you how to trade gap up and gap down opening . You will learn a simple and profitable gap trading strategy that works perfectly on Forex, Gold or any other financial market.
First, let's start with a theory .
A gap up after the market opening is the situation when the market opens higher than it was closed without any trading activity in between.
Above you can see the example a gap up after the market opening on EURGBP.
The price level where the market closed is called gap opening level.
The price level where the market opened is galled gap closing level.
A gap down after the market opening is the situation when the market opens lower than it was closed without trading activity in between.
Here is the example of a gap down after the market opening on WTI Crude Oil.
Why such gaps occur?
There are various reasons why opening gaps occur.
One of the most common one is the release of positive or negative news while the market was closed.
The market opening price will reflect the impact of such news, causing a formation of the gap.
What gap opening means?
Gap openings reflect the sudden change in the market sentiment.
Gap up will indicate a very bullish sentiment on the market while
a gap down will imply very bearish mood of the market participants.
However, the markets do not like the gaps.
With a very high probability, the gaps are always filled by the market very soon.
We say that the gap is filled, when the price returns to the gap opening level.
Above, you can see that after some time, EURGBP successfully closed the gap - returned to gap opening level.
Such a pattern is very reliable and consistent among different financial markets. For that reason, it can provide profitable trading opportunities for us.
You can see that a gap down on WTI Crude Oil was quickly filled and the price returned to the gap opening level.
How to trade gap opening?
Gap Up Trading Strategy
Once you spotted a gap up after the market opening, you should wait for a bearish signal before you sell.
You should look for a sign of strength of the sellers.
One of the most accurate signals is a formation of a bearish price action pattern:
Double top,
Triple top,
Inverted Cup and Handle,
Head and Shoulders,
Symmetrical or Descending Triangle,
Rising Wedge...
Bearish breakout of a trend line / neckline of the pattern will be your signal to sell.
Look at a price action on EURGBP before it filled the gap.
At some moment, the price formed a double top pattern and broke its neckline. That is our signal to sell.
Your stop loss should lie above the highs of the pattern.
Take profit - gap opening level.
Safest entry is on a retest of a broken neckline/trend line of the pattern.
Safest entry point on EURGBP is the retest of a broken neckline of a double top pattern. Stop is lying above its highs. TP - gap opening level.
Gap Down Trading Strategy
Once you spotted a gap down after the market opening, you should wait for a bullish signal before you sell.
You should look for a sign of strength of the buyers.
One of the most accurate signals is a formation of a bullish price action pattern:
Double bottom,
Triple bottom,
Cup and Handle,
Inverted Head and Shoulders,
Symmetrical or Ascending Triangle,
Rising Wedge...
Bullish breakout of a trend line / neckline of the pattern will be your signal to buy .
Let's study the price action on WTI Crude Oil before it filled the gap.
You can see that the price formed a cup and handle pattern.
Bullish breakout of its neckline is a strong bullish signal.
Safest entry is on a retest of a broken neckline/trend line of the pattern.
Your stop loss should lie above the lows of the pattern.
Take profit - gap opening level.
Following this strategy, a nice profit was made.
Always remember that probabilities that the gap will be filled are very high. However, it is not clear WHEN exactly it will happen.
For that reason, you should carefully analyze a price action and wait for a signal, before you open the trade.
That will be your best gap opening trading strategy.
❤️Please, support my work with like, thank you!❤️

PLTR signals reversal is close byPLTR gaps below upward trend line showing last few days as a false breakout with price exhaustion
horizontal support forms. Once PLTR breaks below this and holds, more selling to come
RSI pushes below SMA showing validation with the move.
Volume increasing on the gap also giving validation to the recent move down
We should start to see more weakness in the stock going forward for a little bit.

Disney H&S Developing could fill the gap NYSE:DIS Disney is developing a head and shoulder pattern it could fill the gap if support doesn't step in after earnings. Look for 105-100 as a target if volume doesn't buy in expected Gap Down and gap fill below it couldn't break upper resistance at 124 level either

Review and plan for 2nd April 2024 Nifty future and banknifty future analysis and intraday plan in kannada.
This video is for information/education purpose only. you are 100% responsible for any actions you take by reading/viewing this post.
please consult your financial advisor before taking any action.
----Vinaykumar hiremath, CMT

GAPS- HOW TO TRADE THE "GAP - OPENING"This video is for information/education purpose only. you are 100% responsible for any actions you take by reading/viewing this post.
please consult your financial advisor before taking any action.
----Vinaykumar hiremath, CMT
(Earlier video was missing the mouse pointer, it is rectified in this video)

GAP - HOW TO TRADE...This video is for information/education purpose only. you are 100% responsible for any actions you take by reading/viewing this post.
please consult your financial advisor before taking any action.
----Vinaykumar hiremath, CMT

ASO - Bad earnings can mean potential buy opportunitySee why here! Market is about to open so rushing through this one but hope this was helpful to keep an eye out for
Happy Trading :)

Boeing BANotable Gaps on NYSE:BA for reference.
After news pre market sell off can continue. great entry below 200 but we don't get there today.

Gapped But Not ForgottenFINNIFTY after a series of up sharp down moves is headed towards the zone where an earlier gap was not met. From my recent experience, gap up and gap down are always filled back either in the short term or a while after. Here we see FINNIFTY heading back to the unfilled zone which lies between 21305 to 21285.
After a heavy downfall today, the index formed a symmetrical triangle pattern which could possibly head to clear the old dues. Also, just below the unfilled zone lies the recent touch zone of 21280 to 21270 having served as previous support & resistance in December 2023. Whether that happens tomorrow or not, it is yet to be seen.

TSLA: An Intense Breakout is About to Occur!TSLA shares are trading in a Trap Zone, the area between the 21 EMA, which serves as the main support, and the resistance at $246.70, which was already mentioned in my last public analysis, the link to which is below this post.
This area between the 21 EMA and resistance is called the Trap Zone because as long as there is no real breakout from support or resistance, we could see several false signals and erratic, meaningless movement within the area.
The 21 EMA is slowly rising, squeezing the price against resistance at $246, and sooner or later, we will see a breakout in some direction. There's no way of knowing in which direction the breakout will occur - remember real trading is reactive, not predictive. In some cases it is possible to look for clues in an indicator such as the RSI, and look for a divergence or an Advanced Breakout (which is not the case here).
Since our last study, the price has retested the $246 area, reinforcing our main idea that this is indeed the main resistance for TSLA shares in the medium term. Only if the price breaks through this region will we see a real sign of recovery, which would represent a continuation of the upward trend.
Meanwhile, we see that the price is trading dangerously close to the 21 EMA. If the average is lost, then TSLA could trigger a new bearish move, perhaps looking to fill the gap opened at $225.40. Such a bearish move seen today is definitely suspicious, while the indices and almost all of the "magnificent 7" are rising. I wonder how long such a divergence between TSLA and the rest of the market will persist.
TSLA shares are falling this week, just as we approach the main long-term resistance at the top of its Descending Channel. The 21 EMA is also serving as support on this timeframe, which also reinforces our thesis that this area is a key support point, which could trigger a sharper correction if lost.
For the time being, as long as there is no clear break from its Trap Zone, TSLA's shares are bound to move erratically. To avoid a bearish scenario, now would be the best time to see a reaction. How the price behaves over the next few days will be crucial to what lies ahead in the medium and long term.
I'll keep you updated on this, so remember to like this post, and follow me for more analysis like this.
Best regards,
Nathan.

Rotation Patterns in $CVXNYSE:CVX was the Dow 30 component that had the highest loss on Friday.
The chart clearly shows that the earnings report was not going to be good. The pattern is a failed bottom as there has been rotation to lower inventories of the stock for most of this year.
Declining Accum/Distribution indicators at the lows of the range followed by a negative divergence between the price trend and Accum/Dist are indicative of rotation within the sideways trend that never developed into a bottom.
Another Relational Technical Analysis tip to watch out for in other stocks, especially ahead of earnings reports.

NQ Power Range Report with FIB Ext - 10/26/2023 SessionCME_MINI:NQZ2023
- PR High: 14430.75
- PR Low: 14352.75
- NZ Spread: 174.75
Key Economic Events
08:30 – Initial Jobless Claims
- Durable Goods Orders
- GDP
10:00 – Pending Home Sales
More after hours volatility on earnings
- Session gap down, continuing prev session inventory decline
- Break and holding below key 14600 inventory
Evening Stats (As of 1:45 AM)
- Weekend Gap: +0.21% (filled)
- Session Gap 10/26: -0.29% (open > 14465)
- Session Gap 8/2: -0.33% (open > 15807)
- Session Gap 7/20: -0.11% (open > 15939)
- Session Open ATR: 270.79
- Volume: 65K
- Open Int: 263K
- Trend Grade: Neutral
- From ATH: -14.7% (Rounded)
Key Levels (Rounded - Think of these as ranges)
- Long: 15247
- Mid: 14675
- Short: 14103
Keep in mind this is not speculation or a prediction. Only a report of the Power Range with Fib extensions for target hunting. Do your DD! You determine your risk tolerance. You are fully capable of making your own decisions.

Buyback Patterns: GSAs the #3 most heavily weighted stock for the TVC:DJI , NYSE:GS was one of the drivers behind the run down this week.
In February, a buyback program of 30 billion was approved. Buybacks probably commenced in March and have been boosting the price up within the trading range until recently. It may be that the buyback money has been depleted.
Goldman Sachs reports Oct 17. Revenues declined last quarter. Earnings are up and down. So probably not a great earnings report for Q3. However, the stock has support at the black line, so it doesn't have huge downside potential.

NQ Power Range Report with FIB Ext - 9/26/2023 SessionCME_MINI:NQZ2023
- PR High: 14952.50
- PR Low: 14941.00
- NZ Spread: 25.5
Major Calendar Events
08:30 – Building Permits
10:00 – CB Consumer Confidence
- New Home Sales
Odd, unfilled micro gap down into inventory run
- Tight NZ spread
- Holding daily inventory
- High probability to fill gap within session
Evening Stats (As of 12:05 AM)
- Weekend Gap: N/A
- Session Gap: -0.01% (open > 14949)
- Session Gap: -0.33% (open > 15807)
- Session Gap: -0.11% (open > 15939)
- Session Open ATR: 229.32
- Volume: 27K
- Open Int: 232K
- Trend Grade: Neutral
- From ATH: -11.4% (Rounded)
Key Levels (Rounded - Think of these as ranges)
- Long: 16105
- Mid: 15247
- Short: 14675
Keep in mind this is not speculation or a prediction. Only a report of the Power Range with Fib extensions for target hunting. Do your DD! You determine your risk tolerance. You are fully capable of making your own decisions.

Fortinet FTNT Overreaction - What now?Slightly after earnings Fortinet Gapped down. Which are my favorite kind of stocks to trade because 9 times out of 10 Gaps close.
Fortinet had many analyst reiterate Bullish price targets some up to $70. I'm looking for a retest at $60.
Forecasting out to nov 2nd. The next earnings should be interesting.
Williams, MACD, & RSI are all showing Oversold in this situation. This could be a solid entry for someone to start a small position.
This is not financial advice.
Trade Responsible,
#TradeTheWave 🏄🏽♂️🌊

Apple -> Massive Breakdown And Now?Hello Traders and Investors ,
my name is Philip and today I will provide a free and educational multi-timeframe technical analysis of Apple 💪
Starting on the monthly timeframe you can see that after Apple broke out of the clear triangle formation in confluence with the bullish moving averages, Apple created a strong rally of 30% towards the upside, breaking major resistance.
As I mentioned over and over again the weekly timeframe looked quite overextended so I do expect even more short term bearish pressure before a reversal will be quite likely.
With Apple's gap down of -5% on Friday my last analysis, linked below, perfectly played out but there is no reason why Apple stock should reverse immediately so be careful and don't jump into longs too early.
Keep in mind: Don't get caught up in short term moves and always look at the long term picture; building wealth is a marathon and not a quick sprint📈
Thank you for watching and I will see you tomorrow!
My previous analysis of this asset:
