MCK - Earnings Miss, Channel IntactMCK had a poor earnings report on October 30th but despite the falling price it still managed to hold the ascending channel. The stock price is right at the gap resistance level but with the stock trying to escape an oversold condition it looks to have a lot more room to rise.
I would be aiming for the resistance line of the ascending channel but $147.20 is the 61.8% Fibonacci Extension level which would be a good level to look for a pause in the rally.
Gapdown
SHAK - Just a little overdoneStock sold off due to their earnings report. Honestly, I don't think the report was so bad to deserve a +20% selloff. If you look at the other burger stocks, all dealing with the same issues, most of those stocks held up today, even being green. The selloff today held around the 61.8% Fibonacci Retracement level from the December low to the recent September highs.
I am keeping an eye on this stock to see how these levels hold. I think this should start bouncing back as the weak hands & profit-takers close their positions.
$NXTC Still Has Potential$NXTC got hammered on Monday after reporting disappointing data over the weekend. While the stock closed down 52%, it could have been a lot worse and the stock did bounce on the day. This signals that buyers were stepping in.
Here's what happened:
Thinly traded NextCure (NASDAQ:NXTC) closed down 52% on modest volume on the heels of updated results from the first part of its Phase 1/2 clinical trial evaluating NC318, a Siglec-15 (S15)-targeting monoclonal antibody, in patients with solid tumors. The data were presented at the SITC Annual Meeting in Maryland.
Seven dose cohorts (8 mg - 1,600 mg every two weeks) were assessed, predominantly in patients with non-small cell lung cancer (n=13), ovarian cancer (n=7), melanoma (n=7), breast cancer (n=4) and colorectal cancer (n=3). All NSCLC patients failed to respond to PD-1 inhibitor treatment (median of four prior lines of therapy).
Durable responses were observed, including one complete response (ongoing at week 55), one partial response (ongoing at week 28), four NSCLC patients with stable cancer (ongoing at weeks 16 - 40) and 14 participants overall with stable cancer (ongoing at weeks 16 - 42).
On the safety front, 15 patients remain on study implying a discontinuation rate as high as 44% (n=15/34). Most treatment-emergent adverse events (TEAEs) were mild/moderate. There were three serious TEAEs, one case of episcleritis/uveitis and two cases of pneumonitis.
The company has initiated the Phase 2 portion which will evaluate 400 mg administered every two weeks in ~100 patients with NSCLC, ovarian, head and neck and triple-negative breast cancers. The primary endpoints are safety and tolerability. Secondary endpoints include efficacy measures. Preliminary data should be available by late Q4 2020.
NextCure, Inc., a biopharmaceutical company, engages in discovering and developing immunomedicines to treat cancer and other immune-related diseases by restoring normal immune function. Its lead product candidate is NC318, which is in Phase I/II clinical trials for the treatment of advanced or metastatic solid tumors. The company is also developing NC410, is a novel immunomedicine designed to block immune suppression for the treatment of ovarian cancer, non-small cell lung cancer, and renal cancer. Its discovery and research programs include an antibody in preclinical evaluation of other potential novel immunomodulatory molecules that targets a novel member of the B7-family of immunomodulatory proteins; and an antibody in preclinical development targeting an immune modulator that is expressed in inflamed tissue and the tumor microenvironment in various tumor types. NextCure, Inc. has a license agreement with Yale University; and a research and development collaboration with Eli Lilly and Company. The company was founded in 2015 and is based in Beltsville, Maryland.
As always, trade with caution and use protective stops.
Good luck to all!
Market May Have Overreacted On $LPCNIt's always risky playing biotech small caps. The stock could collapse at any minute or skyrocket the next. $LPCN looks quite interesting after dropping 70% yesterday. What caught our attention is that the stock opened on the lows and rallied from there. Some bottom feeders were in the stock and that's a good sign for those that are looking for new stocks to trade. Here's what happened:
Lipocine (NASDAQ:LPCN) has received a third Complete Response Letter (CRL) from the FDA regarding its refiled marketing application for testosterone replacement therapy candidate Tlando.
This time the agency cited one issue (instead of four the first time): the efficacy trial failed to meet the three secondary endpoints for maximal testosterone concentrations (Cmax).
The company intends to request a meeting with the agency to clarify a path forward.
The company received the first CRL in June 2016 and the second in May 2018.
Lipocine Inc., a specialty pharmaceutical company, focuses on the development of pharmaceutical products in the area of men’s and women’s health. Its primary development programs are based on oral delivery solutions for poorly bioavailable drugs. The company has a portfolio of product candidates designed to produce pharmacokinetic characteristics and facilitate lower dosing requirements, bypass first-pass metabolism in certain cases, reduce side effects, and eliminate gastrointestinal interactions that limit bioavailability. Its lead product candidate is TLANDO, an oral testosterone replacement therapy. The company’s pipeline candidates also include LPCN 1111, an oral testosterone therapy product for once daily dosing that completed Phase II testing; LPCN 1107, an oral hydroxyprogesterone caproate product for the prevention of recurrent preterm birth and has completed an end-of-Phase II meeting with the Food and Drug Administration; and LPCN 1144, an oral prodrug of bioidentical testosterone that is in Phase I Clinical trial for the treatment of non-alcoholic steatohepatitis. Lipocine Inc. is headquartered in Salt Lake City, Utah.
As always, trade with caution and use protective stops.
Good luck to all!
Traders Bought The Dip On $UPLD$UPLD saw a nice bounce on Friday off the lows as traders bought the dip after $UPLD reported disappointing earnings. Here are the highlights of that report:
Upland Software (NASDAQ:UPLD): Q3 Non-GAAP EPS of $0.52 misses by $0.06; GAAP EPS of -$0.50 misses by $0.18.
Revenue of $55.1M (+48.5% Y/Y) misses by $0.32M.
$UPLD is now trading at just 13x earnings. Credit Suisse came out last week before earnings and gave $UPLD a $48 price target.
Upland Software, Inc. provides cloud-based enterprise work management software in the United States, the United Kingdom, Canada, and internationally. The company offers a family of software applications under the Upland brand in the areas of information technology, process excellence, finance, professional services, and marketing. Its software applications address enterprise work challenges in various categories comprising customer experience management, sales enablement solutions, professional services automation, project and financial management, enterprise knowledge management, secure document services, and document lifecycle automation. The company sells its products through a direct sales organization, as well as through an indirect sales organization that sells to distributors and value-added resellers. It serves customers across a range of industries, including financial services, retail, technology, manufacturing, legal, education, consumer goods, media, telecommunications, government, food and beverage, healthcare, and life sciences, as well as non-profit organizations. The company was formerly known as Silverback Enterprise Group, Inc. and changed its name to Upland Software, Inc. in November 2013. Upland Software, Inc. was founded in 2010 and is headquartered in Austin, Texas.
As always, trade with caution and use protective stops.
Good luck to all!
WBA - Testing Gap ResistanceWBA gapped down at the beginning of April due to an earnings report. The price continued to fall until the end of May, failed when it hit gap resistance in mid-July, & fell again creating a double-bottom at the end of August. Price has continued to fail when attempting to fill the gap but recent price drops have created an ascending triangle pattern. I'm looking for the gap to be filled at some point in the near future.
KSS - Gap Holding Back KohlsKSS had a gap down on earnings on May 21st. This is the third time price has gotten near or tested the gap resistance level & it has been rejected each time. Price seems to be falling from this level again as it sits in an overbought condition. It provides a short opportunity with a couple of Fibonacci Extension levels provided with the dashed green lines.
ZS - Scaling InZS had a gap up due to earnings back on March 1st. The stock saw a rise in price within a bullish price channel but was creating a bearish divergence with the RSI indicator. Even with the pullback, the price remained in the bullish channel until it broke down in mid-August.
Another earnings report in September led to a gap down that created an Island Reversal pattern & carried the stock price below the March gap, which was now acting as resistance.
The stock price continued falling as it tested that March gap resistance a few times but as the price fell the RSI has moved higher creating a Bullish Divergence.
With the price moving out of an oversold condition I am looking for the price to move up to re-test the September gap resistance. Depending on bullish momentum the stock may be able to continue rising to fill the September gap.
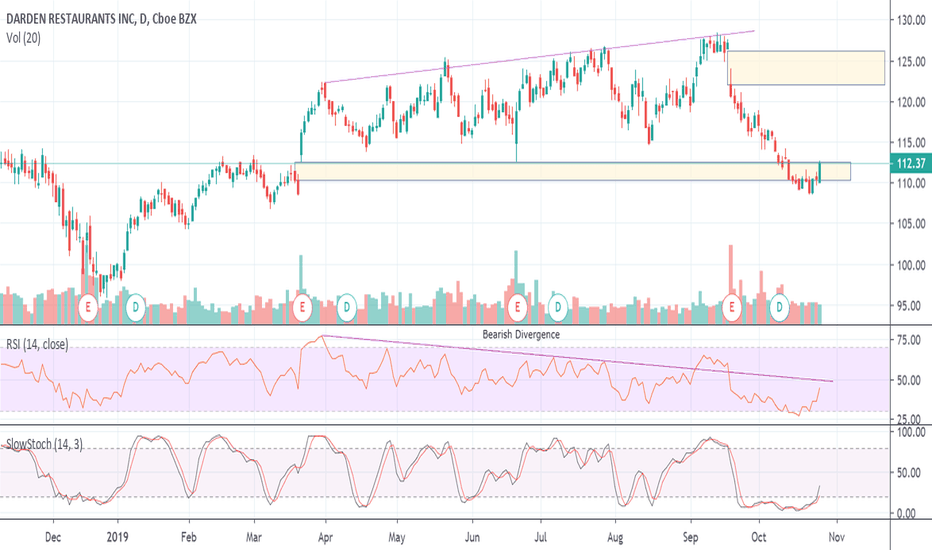
DRI - Let's Go Out For A BiteDRI had a gap up on an earnings announcement back on March 21st. The top of this gap became support while the stock price continued to rise. This rise in price created a bearish divergence with the RSI indicator.
The earnings release in September led to a gap down. The price actually consolidated just below the March gap. Friday's trading has the price testing the resistance level of the March gap zone with the stock finding strength.
DRI is finding relative strength within the Restaurant industry but still needs some more time to see if it is gaining strength on the SPX. If the price continues to rise I would expect a re-test of the bottom of the gap down zone around $122.
INTC - Earnings After CloseThere was a gap down back on April 26th following a disappointing earnings release. Since then, the price has been unable to break above the resistance line created by the gap down. The price was rejected at this level for the third time but there is also an ascending triangle pattern forming. Depending on how earnings are taken there will either be a breakout or a breakdown.
Looking for a shortWSP had a massive run up yesterday, gaining over 10%. I love seeing when a stock is overextended it just gives me more reason to short it, the mean of WSP is -0.19% so there more negative days than positive. Based on the data its a normal standard deviation of 68%, therefore im looking to trade between $2.19 and $1.78, lets see how it reacts between $2.060 and $1.92.
$HHC Buy The Dip And Play The Fibonacci Retracement$HHC dropped like a rock on announcing some restructuring changes. We think this a good dip buying opportunity on a market over-reaction. Here's the news:
The Howard Hughes Corp. (NYSE:HHC) following its announcement that it's replacing its CEO and embarking on a transformation plan.
That follows a "thorough" strategic review, the company says.
It's named Paul Layne (currently president of the company's Central Region) the new chief executive, effective immediately. David Weinreb and Grant Herlitz are stepping down from the company, and Layne will replace Weinreb on the board.
The new transformation plan has three pillars, the company says: a $45M-$50M annual reduction in overhead; selling about $2B in noncore assets; and accelerated growth in core MPC assets.
Chief Financial Officer David O'Reilly will have an enhanced role working with Layne on executing the new plan.
Remember, hedge fund manager Bill Ackman is Chairman of the Board and a major shareholder. He is well-known for being committed to his deals.
The Howard Hughes Corporation owns, manages, and develops commercial, residential, and hospitality operating properties in the United States. It operates through three segments: Operating Assets, Master Planned Communities, and Strategic Developments. The Operating Assets segment owns 15 retail, 28 office, 8 multi-family, and 4 hospitality properties, as well as 10 other operating assets and investments primarily located and around The Woodlands, Texas; Columbia, Maryland; New York, New York; Las Vegas, Nevada; and Honolulu, Hawai‘i. The Master Planned Communities segment develops and sells residential and commercial land. This segment sells residential land designated for detached and attached single family homes ranging from entry-level to luxury homes; and commercial land parcels designated for retail, office, hospitality, and high density residential projects, as well as services and other for-profit activities, and parcels designated for use by government, schools, and other not-for-profit entities. As of December 31, 2018, this segment had 10,543 remaining saleable acres of land. The Strategic Development segment comprises residential condominium and commercial property projects. This segment consist of 29 development or redevelopment projects. The company was founded in 2010 and is headquartered in Dallas, Texas.
As always, trade with caution and use protective stops.
Good luck to all!
NTAP Head & Shoulders Top Gaps DownNTAP on the Weekly View chart shows a traditional Head & Shoulders Topping Formation. This type of top is far less common these days. This is due to changes in Dark Pool transaction activity off the public exchanges, new routing, and new order types. The gap down is above the traditional Head & Shoulders completion level. However, there is some technical evidence that this could be the conclusion and completion level for this top at this time.
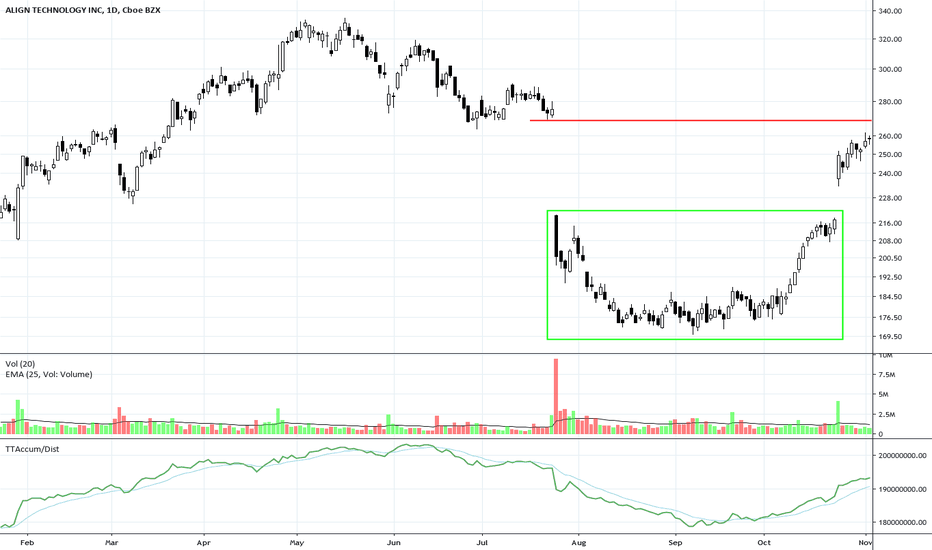
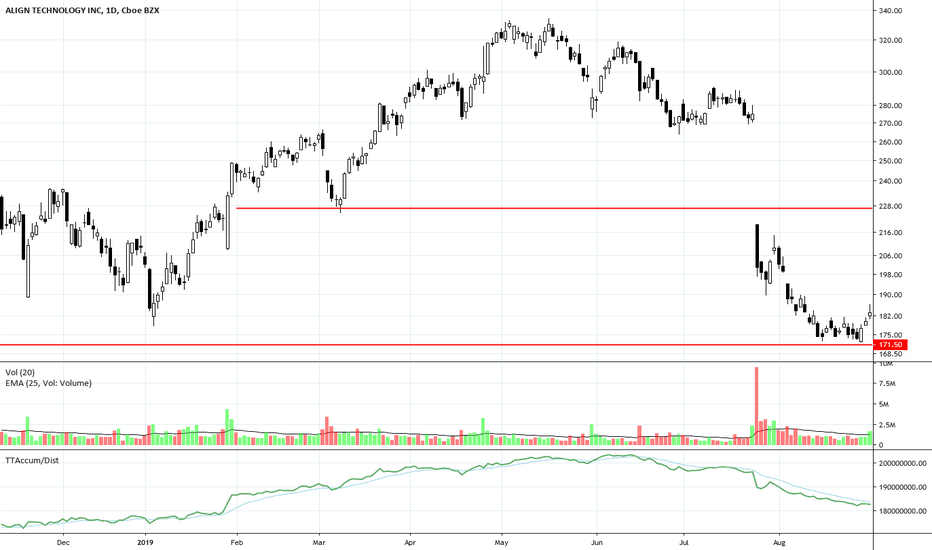
ALGN at Long-Term Support LevelALGN gapped down at the end of July on weak earnings news. It has now collapsed to a strong long-term support level. The final capitulation by Smaller Funds managers has ended. The consistency of the candlestick pattern with closely aligned lows and an early Shift of Sentiment™ pattern on the Balance of Power Indicator reveals some Dark Pool Quiet Rotation™ at this level.
My thought about current BTC market.The small gap at 9865 got filled, the next target can be the big bearish gap at 11599. The price can make a wick to top of channel. I have my own sell order at 11700 (maybe I lower it under 11600).
Then price will go down to fill in the gap at 8488 in middle of Aug.
In 2H time frame RVGI turning upward.
This is just my thought. Don’t trade based on it.
MMM Starts BottomMMM had a massive High Frequency Trader gap down in April, but has now found support at a previous low from 2016 that is a fundamental support level. Massive Smaller Funds Volume Weighted Average Price selling occurred after the gap down. The bottom has shifted the trend to the upside.


