$UPST - Gap Fill SuccessfulOver the past couple of days, $UPST has regressed heavily and filled the gap it made back in August.
With Fed meetings over, and the newly bullish momentum in the markets, this name is primed to make a hefty reversal.
We have a small handful of resistances overhead, but I'm confident we'll be able to surpass them given enough bullish volume .
If we run hot enough, we even have a huge gap to fill above 270! I'll be keeping a close eye on this one heading into the new year.
ONG swingtrading swing support Supply Zone gap gapfill reversal bottom
Gapfill

TSLA Shorting Waiting for filling the gap, once it will be filled, i am putting an short position.
NOT FINANCIAL ADVICE, ONLY FOR EDUCATIONAL PURPOSES

HD - WILL FILL THE GAPForming this wedge will fill the gap below.
Reaching 425 and 430 level is possible, before breakdown.

Bitcoin - CME Gaps - 06.12.2021Here are all current open gaps - status 06.12.2021
Lets see how fast the upper gap gets closed

TSLA - Will test the New ResistanceHello Traders, from 3 days sell off of TSLA it will test the new resistance (violet box) and will go down to fill the gap. I posted a Potential Reversal Zone (PRZ) of TSLA to fine where it is possible to go up again.
"TA is just a probabilistic analysis- not certainty. Everything is possible. The analysis just points to what is likely probable. TA is not 100% correct." - George Tan
* PRZ
* CRRECTIVE WAVE

Is this going to be filled?this remained unfilled. is it going to be filled and go straight up to 64 and 79? that's a 1K dollar question

$NZDUSD Can Finally Reverse And Rise For A CorrectionTraders, NZDUSD has been falling without any supports and has reached a level where it can finally stop, take a pause and reverse for an upward correction.
At this level:
1. It has past structure
2. 78.6 Fib
3. Gap which has now been closed after a period of more than 1 year!! :)
4. Extended M pattern completion
All these factors present us with a good opportunity for a long position. The trade idea is on daily time frame so it may be slow and can take days, possibly weeks.
Rules:
1. Never trade too much
2. Never trade without a confirmation
3. Never rely on signals, do your own analysis and research too
✅ If you found this idea useful, hit the like button, subscribe and share it in other trading forums.
✅ Follow me for future ideas, trade set ups and the updates of this analysis
✅ Don't hesitate to share your ideas, comments, opinions and questions.
Take care and trade well
-Vik
____________________________________________________
📌 DISCLAIMER
The content on this analysis is subject to change at any time without notice, and is provided for the sole purpose of education only.
Not a financial advice or signal. Please make your own independent investment decisions.
____________________________________________________

$DOCU with a big gap down after earnings...There is a weekly closing gap at 161.42 and below there is 150.60. If there is more bearish price action, these could be targeted by sellers.

$CRM - Day Trading the Overhead Volume GapWhile $CRM was in freefall we left a small volume gap overhead.
Given that we break the upper trendline around 262-263, we should make a quick trip up to 266 as we fill the gap above, allowing us to capture an easy 1.5% move.
Options will be extremely cheap tomorrow since it's Friday, making this the perfect day trade candidate.

CHWYs momentum is upBased on a simple inverse head and shoulders target complimented by Fibonacci price points CHWY may head to the upper 80s. There is also a gap to fill that coincides with that level.

ATVI: GOOD FOR A QUICK TRADEATVI:
I don't know where ATVI will be in 6 months but I like it now for a swing trade .
We're a bit oversold, the price is far from the 1st moving average and we have this gap, so I would expect some kind of bounce. If we don't get the bounce, it's fine, the support is quiet close, so we're not risking too much money.
My play would be a long trade from the current price with a profit target at 72.20.
Stop loss around 65.40.
Trade safe!

CRM Ready to Crash?CRM looks to have lost its bullish momentum. My guess is that it'll consolidate near the $312 resistance before ultimately falling to AT LEAST $287. My bold prediction is that it'll fall to $267 by Dec 10 and use the top of the gap as a support for a bounce but...Only Time Will Tell

PATH gapNice bounce off trendline support,
We could pick up calls tomorrow if stock looks bullish intraday,
There is a gap to be filled to the upside and price is squeezing inside symmetrical triangle.
Also, PATH was Motley fool's pick this month.

BTC head down to $55k and $60k to fill the gap#BITCOIN is back to fil the CME gap before weekend.
#BTC Made a new ATH on a news of High inflation.
People got greedy & start opening new longs at all time high.
🔥 Evergrande Bank default news came, Whales saw opportunity to Flush the late long position to reset the market.
🔥 ETF Rejection is temporary fud.
Quick sell off to $55k - $60k early next week before starting run towards $75K.

FDX gap opportunity FDX is entering into a gap to the upside,
Has great R:R
The problem is that UPS reports ER tomorrow morning,. and it can either drop or make the gap get filled easier.

Anatomy of a Day Trade: Entrances and ExitsO FGS! Dammit! They gapped it up overnight, what should I do?!?
Well what gap is this? Three weeks ago we had Initiation Gap: These often do not fill, don't short them! It's suicide, lol!
This has hallmarks of an Exhaustion Gap; it will fill intra-day or within a few sessions at most... a great short opportunity!
See my related post on gaps FYI.
But, when should you enter?! If you foolishly short it at the open be prepared to wait for hours and watch your position dwindle... ow!!
Should you buy calls at the open?! Maybe it will run higher?! Of course it CAN, but it can also run lower and gapfill quickly, within minutes.
A long position taken first thing is high risk... as are early shorts! So, when can you enter a position with reasonable expectation of profit?!
In fact, ANY position taken in the first 20 minutes of the trading day is very high risk, I do not like to open new positions right away!
So, you Watch and Wait! Looking for opportunity... in the first hour price ran higher and calls had been profitable, but we didn't take a position with no signal, we like good Risk/Reward positions with clear signals, not gambling on the opening price. After what seems like an eternity, price begins to consolidate and gives us several warning signals, first a pinbar appears, with a needle doji and tall wick followed by a red candle, a bearish signal; two spinning tops follow, but price clings to the opening price support line tenaciously as the bulls struggle to push higher... finally the price breaks below the support from the opening gap. This was the price support that market enjoyed from the open, as buy order imbalance filled, RSI weakens and money flow decreases until... price breaks under the opening price, signaling downtrend moving towards the gap. Notice how RSI moves from overbought, signaling weakness?
This is a short entry high R/R position. You can buy daily puts here with confidence they will increase in value rapidly and immediately.
You do not want to get stuck holding these dreadful instruments more than half an hour, you can see the value drain out as expiration nears!
Well we see the gap filled, not completely to yesterday's closing price, but it sold down to former resistance at the high prices from last session.
This often is all you get on a fill, it won't always close precisely! Sometimes price will dip below the gap and go negative for a few minutes. When the gap fills, you close position, we can't afford to gamble on whether it's gonna get lower or not...
Suddenly an impulsive bright green candle appears! Gosh I hope you sold those puts!
Notice how RSI has moved nearly to oversold? It's gonna bounce!!
NOW is the time we make the best money. This was the candle we saw on 7 October, pullback ran to 13 October; another one appeared on Fed day at 2PM, pullback was just minutes then it bulled up and up... these are the money makers! Learn to recognize this chart pattern and you WILL make money on option trades.
You can take a moderate sized position here, I like to trade lots of ten, when I see this candle I'm gonna start with 20-40 calls depending on cost, and add more as price moves in favor. I do not like to add when price moves away! USUALLY Dollar-Cost Averaging in options just leads to magnified losses!! The more you take the greater the loss you might experience, remember when you enter an option trade you assume the total risk for premium paid, a sudden price change can wipe out your position before you can even set up the closing trade. So risk what you are willing to lose, and no more.
After the first impulsive move, a retracement nearly always pulls price back to ~2/3 of the impulse height. Here you draw the fib extension to get your target price projection; Fib Extension tool has three buttons, first at bottom of green candle, second at top, and third at bottom of the retracement. Chart your fibo and target the 1.618 extension, this is where your calls will take you! They might take you farther, but that involves more hand-wringing, nail-biting and screen cursing while you wait and watch the time value run down! Do not hold these any longer than necessary!
So there were TWO good R/R day trades in Friday's session on 11/5. A short, and the subsequent long. You could have taken other positions, but R/R would be poor, most 'trades' without signals are just gambling. Be a trader not a gambler! Most of the time you want to stay OUT of the market!
Look, today's trades involved about two half-hours out of a 6.5 hour session! The rest was just noise and risk.
Notably, in 'Power Hour' at EOD, there was not enough bullish energy to lift price back to HOTD... this is Bearish, in a long bull run Fridays typically close at HOTD and short-covering rallies into close are typical, we didn't get that today and daily calls ran down to expiration worthlessly. You might consider taking a longer-term short in weekly or monthly contracts, to catch a move MOnday if the price weakness persists and a gap down follows the exhaustion gap up... if you dare.
Remember Buffet's rules of trading: 1) Never Lose Money. 2) Never break Rule 1.
Hopefully this post will be of some value of increasing clarity in trading. When you're in the market watching the numbers flicker it is so easy to get lost and miss the forest for the trees... Get ready for some amazing trades as this parabola rolls over and the cascade ensues... always exciting!!

$PYPL PayPal under heavy fire, where is the bottom??Paypal got destroyed over the last couple of months, after it made it's double top on July 26th.
It has lost 35% of its value since then.
Paypal gapped below the support at around 222ish$ today and that triggered even more selling, since that support held for almost a year now.
The next area, where i see heavy support is at around 184-190$
I feel like that support must really hold, if we for example would gap below that support too and keep selling off,
there is a gap that would be closed at 130$.
Overall, the $PYPL chart really got some technical damage done to it, and it will need some hard work of the bulls to repair that damage.
We ripped a big down gap today, so i expect somewhat of a recovery rallye, also to work off that oversold RSI, but i would not be surprised, if we see another leg down in the $PYPL chart afterwards, since there's alot of fear in this stock now, and holders might use a recovery rallye to rebalance $PYPL in their portfolios.
Definetly not the stock, that would blindly go long on now, just because it got sold off, there's potentially a lot more selling to come in $PYPL

Two unfulfilled gaps in the BTC1! futures chart ?
Hi everyone,
I've just identified these two gaps in the BTC1! Futures chart, does it necessarily means that they will be filled in the future ?
That would mean a huge drop in BTC's price.

KLSE may resume downtrend @ ≈1555..2/Nov/21KLSE future index may resume its downtrend at around 1555 where this is the zone of ..1)Volume Profile's Valley ( Some traders only trade the "Peak" or "POC" of volume Profile. But the "valley" of Market profile could be "interpreted" as "Lesser" "Buyer or Seller". Depend on the "bias" of market sentiments overall trend 2)Closing the gap at round 1555 3) A minor Supply Zone (cyan) 4) A minor down trend line (yellow)

PBBANK down to around RM 3.745 ?! 11/Nov/21P/s. To have more "consistent" Elliot Wave Counts.. Unlike Text Book written Elliot Wave Theory :- There is 5 sub-waves in any Impulsive Waves .. Traders are advised to label ONLY a-b-c 3 Sub-waves on ANY Impulsive Waves...

Long $FB Gap Fill to $338+ after Double Bottom BounceFacebook looks like it hit a double bottom and is now trying to gap fill back up to $338 - $340. Looking for volume to break $326 first as confirmation of move. Long.

$CHWY Bottom Curl Looking to Gap Fill UpwardsIf Chewy can break $76.50 with volume, it can gap fill back up to $86.50. Unusual option alert for Nov 19 $72 Call Sweeps, 156 @ $3.61.

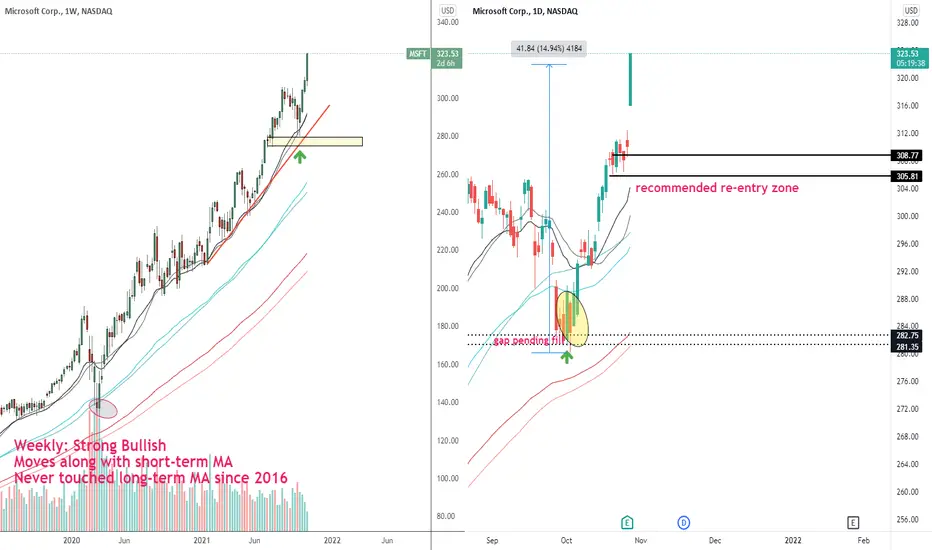
JICPT| Microsoft setup worked well amid better earning report! Hello everyone. I've published a bullish idea of Microsoft on Sept. 29th , titled ' Microsoft Daily bullish gap fill trade!' . The setup works very well with a 1 4% absolutely return within just one month . You can refer the linked idea below for more details.
Today, the stock has edged up by more than 4% due to the better-than expected earning report which revealed that year-over-year revenue growth is almost 22% . That's the fastest growth since 2018. For tech companies, growth matters a lot.
For buyers who missed the trade , Now, what to do?
My followers may know that I'm not a big fan of breakout trade. I don't wanna to chase the price. Based on the daily chart, the zone around $308 marked should be a good re-entry zone.
What do you think? Give me a like if you're with me.