Facebook - bounce off support ahead of earnings - gap fillBearish prediction for Facebook stock ahead of earnings. I think the resistance line I've marked will be tested again, followed by a bounce, and if the earnings report is good we could see the previous gap get filled. This is supported by the RSI indicator.
Hit the like button if you agree.
Gapfill

USD/CAD Fibonacci Sell From The GAPThe USD/CAD was the story of the Sunday/Monday forex session. Trade opened the week GAP down, sending forex players to their screens en masse.
For the remainder of the week, sell orders queued up from beneath the 38% retracement at 1.2894 are a good way to play resistance with the trend and rotation in the GAP. Using an initial stop at 1.2926, this trade produces 32 pips on a rotation back toward the bear.
Here it is:
1)Entry: Sell 1.2894
2)Stop Loss: 1.2926
3)Profit Target: 1.2862
4) Risk vs Reward: 1/1

GAP Dow Jones IndexAs you can see the GAPfillout and fillin is coming several times. You can trade easily downgrade to up and upgrade to down and finaly 5-10 candles fill in the gap. If you want to know more write here. Thank you. :)

Sirius Minerals gapped through 200 EMA (bearish), but...On the daily chart: SXX gapped down through its 200 EMA, a bearish sign
BUT found support at 23.5 on it's weekly 200 EMA
Stochastic on daily chart is trending down and could result in another decline
Also filling the gap at 31.72 could trigger fresh round of selling.
Let's see what happens.

One more push before Bitcoin retraces? Good morning, traders. I'm trying a darker color scheme here, so let me know what you think. It is the beginning of the work week in the U.S. after the 3-day holiday weekend. Shorts jumped up over the weekend the short/long ratio currently stands at 1.1558. There are a couple of possible reasons for this: 1) big player could be baiting retail into shorting so they can initiate a short squeeze to get through the resistance at $7300-$7500, 2) an individual/entity could be playing contrarian and hoping that price dives, or 3) they are hedging their long spot position just in case price drops. As I am writing this, there was a push up to $7400, which was the equilibrium of the ascending channel, liquidating some shorts in the process. This moved price through the immediate resistance around $7330 which marked the top of the apparent ascending triangle. The target of that pattern would be the previous R3 pivot on the 6H TF at $7680. Remember, pattern targets are often not hit, so traders should never rely solely on them.
It is possible that the ascending triangle was a pennant, in which case the target based on the flagpole of the pattern would be around $7900. This was the pattern I was watching earlier this weekend, but the resistance at $7330 may be suggesting the ascending triangle mentioned above. The $7340-$7350 level is showing good support for the moment with resistance from $7400-$7500, $7550, and $7580. On Bitmex, there was a sell wall of about $42 million recently at $7700, but it is now around $22.5 million. All of this means that my target of the $7600-$7900 range as the top of this leg up, that I've mentioned for a few weeks based off various patterns we've talked about, is still valid, so we will see how price action plays out.
If we look at what's been going on in terms of Wyckoff, then we likely just completed another re-accumulation range. Bearish divergences are starting to show up on various TFs, however, so it becomes increasingly difficult to know if the top of this leg up is in now. If not, it does appear close at least. It seems to me that we have one more push into the zone mentioned above, but I can't guarantee anything. I have been talking about the CME Bitcoin futures gaps for a while now and Friday I mentioned the likelihood of it gapping up after the weekend which would require a retrace to fill it. At this point, price is currently filling the nearest daily gap but needs to close at $7380 or higher to do so. We then have gaps that require daily closes at/above $8415, $10,775, and $15005. Below current price, there are gaps that require a daily close below $7045, $6405, and $5885.
Those lower gaps, especially the sub-$6000 one, are why I continue to mention that a shakeout is still a possibility. A sudden drop down into the $5000s would get price under that gap, and then the following daily close would fill it. There is also the possibility we could see a continued push up toward the February high around $11,800 first, and then a move down and shakeout. This latter scenario would be the most productive for a shakeout as the retail herd would be much more bullish so the sudden drop would get rid of the remaining weak hands. In this scenario, the previous low is most like a secondary test, as I've mentioned the possibility, rather than a spring, and the shakeout would be a spring. The herd is "hoping" for bullishness right now, but they aren't believing it so a shakeout right now would not be as convincing. The latter scenario has me expecting a retrace down to $6800-$7200, depending on how high price moves first, before continuing up to challenge the February high. If you've been following my live streams this year then you already know these are the scenarios I deem most likely and why. I still see little-to-no reason for any prolonged move under $5000 at this time. As always, risk management remains key. Trading without a plan will make sure you don't last long.

Gap fill Idea : $TIF (Bearish)$TIF gap fill is coming up.... It's below 100 SMA and there is a possibility of testing 200SMA (1) on daily chart. Then (2) ....

The Real Reason Bitcoin Is Rallying to $7200...Bitcoin got a major push last night to the upper limit of our rising wedge.
We were expecting a pull back, but insofar Bitcoin has continued to rally without coming back down to give us a good entry.
Unless it has a good set-up with a high R/R (risk/reward), I don't like to enter. Many of the altcoins have been presenting us with great R/R's, which we have taken a lot of them in our VIP group.
Right now, what we are seeing is a pushing contest between the bears and the bulls.
I believe a target of $7200 is a solid target on this Bitcoin price rally because there was something known as a "gap down" in the futures market (which you can see on the graph attached.)
Typically with gaps, there is a pull back before resuming the trend. (which for Bitcoin is currently bearish)
This is known as a Gap Pull Back trade.
For Bitcoin, the Stoch RSI is maxed on the daily, so we should get a nice pull back for re-entry around $6700-$6800 if Bitcoin doesn't break down from there.
If we don't get the pull back, the R/R (risk/reward) is not in our favor as a pull back is overdue based on the stoch.
Target for the second gap on the futures market is around $7200-$7300.
Thanks for all the support and feedback. I'll continue to try and provide amazing content for you guys.
Leave a comment with your ideas below and i'll try and respond to all of them.

Bullish channel and a great gap to fillAfter the overreaction because of the ER, $TWTR stock has been forming a bullish channel with a great gap to fill, great opportunity to buy cheap with a slightly close SL.

Facebook Daily Chart with Weekly 50 SMA synchronized on chart Price has never filled this Gap on the Daily chart and below we see the obvious supply zone. These are very important levels to pay close attention to.

Short EURCHF at resistanceGap needs to be filled. I'm playing this with a tight s/l right above resistance. Potential rising wedge, as well.Waiting for the best entry.

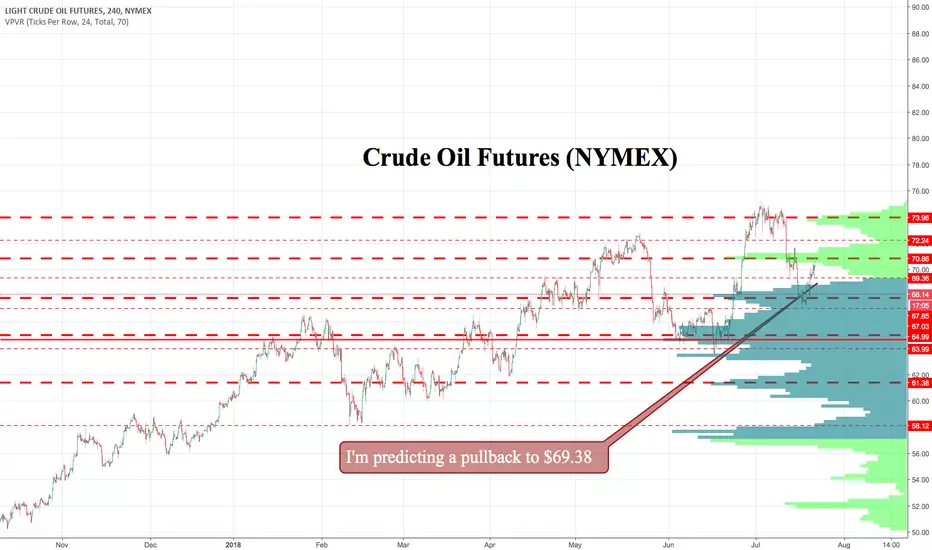
Can CL Fill the Gap?CL Futures have opened the week with a 3% gap down around the $68 mark. $68 is also the high volume area. I'm looking for a pullback from the gap, to $69.38 level, which is low volume area.
This won't quite close the gap but it will be a percentage of it. Before retracing back to $68.00.
The Challenge Begins: Oversold AQXPThe £800 to £1 million challenge kicks off with the first trade being executed on Aquinox Pharmaceuticals. As we go along in the challenge you will notice that I am a Special Situations Equities trader. I utilise Exchange Traded Options to go Short and in the case of this trade, I have chosen this stock as it was savaged by the market in the last few weeks due to a failed 3rd stage test.
Interestingly though Seeking Alpha highlighted that:
"It is possible that a strategic option could be accomplished for Aquinox, this would come either as a merger with another pharmaceutical company or being bought out by one.
Aquinox is still developing rosiptor in a phase 2 proof of concept study for patients with chronic rostatitis/chronic pelvic pain syndrome with results expected by July of 2019."
I love these sorts of plays. A stock with healthy cash reserves, a solid balance sheet, savaged by a market because of one poor news announcement. This tells me that the stock is considerably oversold and the bounce back could be swift. I am looking for the gap to be 30 - 40% closed, which equates to a price level above the $6.50 mark.
Degiro Trade Confirmation Details
03/07/2018 16:32 03/07/2018 Buy 100 AQUINOX PHARMACEUTICAL@2.64 USD (US03842B1017) Aquinox Pharmaceuticals USD -264.00

I wouldn't want to be short right now after that BTC move.That recent price movement caused Shorts to gap up pretty large. That leaves the price area clear of resistance. Should be a much easier path up for price now.

FTSE 100 GAP Fill tradeThis is a GAP Fill trade. If you manage it correctly it will give you up to 100 points , maybe today or in a day or so. If you can manage any retraces then this is a really nice and simple trade.

Sell your CMG, risk against higher high on weeklyCMG: we still in downtrend on weekly. 3 part bull div on daily is probably related to weekly trying to make a higher high (it hasnt yet). This could be a sell opportunity with stop if we break higher high. The target would be the gap fill and weekly volume profile node. Because its a short, on a daily-weekly timescale, and the r:r isnt great, this is not a perfect trade.

RENN Chart Discrepancy Large gap to fill to $6. Lots of people shorted based of this charts price action finviz.com but as I look further I find this is inaccurate. If this breaks $3.20 again it has no previous resistance till $6 and the RSI is very oversold sellers look to be exhausted.

RENN Descending Channel RNN is very oversold on the monthly and daily charts. It is trading in a decending channel and if price respects the channel it should test $6. It has a large gap to fill from $3.20 to $6. RENN is trading at 1/10 it recent $10billion valuation per Softbank. finance.yahoo.com

RENN Drops 75% After $9.19 Dividend Huge gap to play here with no previous resistance till $6 per share.

SNAP breaks out: to fill gap, return to weekly volume profileSNAP has closed above the daily downward trend. A long here on the daily timeframe could give good R:R if risked off all time lows with a target at the weekly volume profile, which coincides with filling in the recent gap.

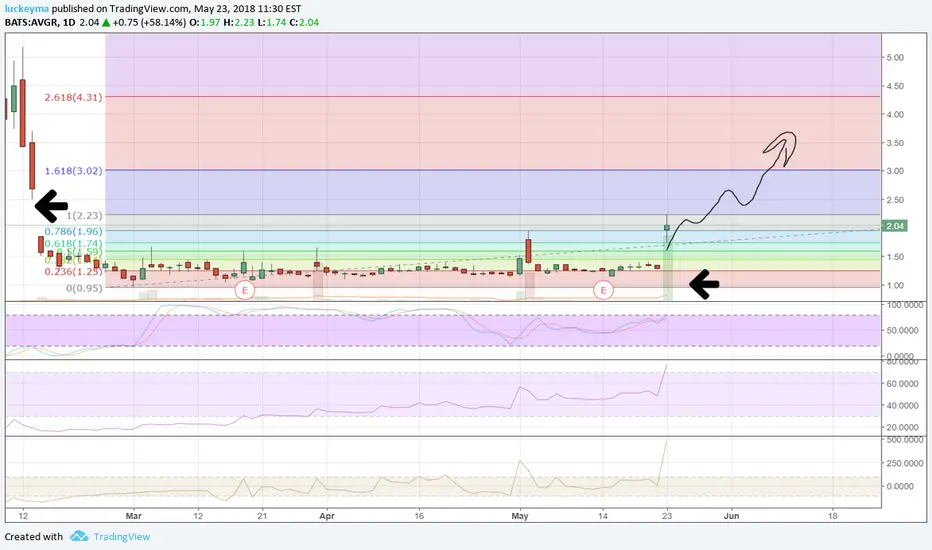
AVGR Bullish on FDA Clearance AVGR has received 501k clearance by the FDA for its Pantheris device. AVGR opened today with very strong volume over 5mln shares traded in first 5 minutes of the day. There is a large gap to fill on the daily chart from $1.88 to $2.58. Bullish on news.


PG: Open gap as price target means a move higher is coming soonLast week marked a potential low for the month of May. Therefore a move upwards could push "PG" back into the trend channel towards the open gap.
Entry: Above $71
Target: Open gap, above $76
Stop loss: Last week's low, $70
