15 min Double top!!!We can see the Confirmation of a 15 min Double top this morning when looking at Gamestop. Also the Relative Strength Index is weighing heavily on the overbought side With the moving average convergence divergence also looking to cross downward. Possible small 2 to 3 dollar dip in the next coming day or days before it starts to make another run back up leading into the last Quadruple witching for the year which will take place on Dec 17, I think we should see GME at new quarterly high about 2 weeks prior to witching and then will fade back off until next quarter in 2023.
Gapfill

SPY IS BREAKING OUT...Again as this is a 4th-wave we will see plenty of swings.. that is why I did not trade until I saw a "bottom was in" for this wave. Looking at the pre-market we are sitting above $397 and showing strength towards our first level of $411. Some may be wandering what those red lines are for... those are my support lines I draw on a bigger time frame along with fib levels to help with confirmation. I don't just rely on Elliott Waves and Fibs... I feel support and resistance are key to know also.

TSLA EXPECTATION FOR 9-11-2022 WHEN MARKET OPEN on 1h dear traders today our expectation on TSLA depend on last news yesterday and depend on our technical analysis on daily and 1h , 15m time frame we found the price has fallen down and make a gap on daily chart so we expect the shoud make a correction and moving up to close the gap then after that will falling down again to test the same support , also as you see in the chart the rsi indecator give us signa for correction beacuse it test 20 line on rsi ,, and the adx indecator give us the same signal ,, so depend on this analysis we advice you to be ready for correction until close the gap or touch the 50 line ema then the price will falling down again ,,
thank you

AUDUSDThe imbalance which was caused in the new week's opening, has a gap result.
Gaps are imbalances which have to be mitigated.
Long trader with entry at the current price without waiting for retracement.

Bounce PlayInitial target low 220s in the next week or 2, then pullback before 0.618 retracement to 255
Green trajectory is expected path, dashed is alt path


GBPUSD dip to gap fill then bounceOANDA:GBPUSD will dip back down to fill in some PA and Volume gaps.
With an anchored VWAP from September 13 NY session open with a big dump starting a long downtrend, PA is ranging between the standard deviations of the long term VWAP.
Above the current VWAP, it opened the week with a large gap up from last week's close, which it will go fill on its way back to the VWAP and on down to fill a volume gap seen in a (up/down) volume profile over the same period.
After running through the volume gap in a downtrend continuation, shorts reacted sharply twice with price returned to that zone.
After it broke up through the gap zone quickly, it returned once and longs sharply pulled it up.
I speculate a move back down to the VWAP-1stddev support and the volume gap before Sterling finally begins recovering from his bender before the morning after.
(Note: I do smell a little hopium odor from the shorters next door.)

SE ~ Lower Lows incoming? Buying Opp incoming?SE, Sea Limited has been suffering massive losses ever since its peak in the fall of 2021. This massive bull run was led with the Tech & Growth Stock boom that's bubble has recently bursted through out the current Bear Market of 2022!
Sea Limited owns multiple varieties of Business in the South-Eastern Asia Region. Businesses Like :
Shopee - Ecommerce Giant
Garena - Gaming + Esports
& Much more smaller companies
Sea Limited has grown a massive amount of revenue, but has most definitely struggled with its debt and spending to make a profit.
Nonetheless, let's get to Technicals!
SE has suffered such huge losses, many wonder where is the bottom!?
My thesis for this Stock is a short / mid term short position, followed by long term accumilation.
Short : SE has 2 major gaps to still be filled from back before COVID, and the gigantic Rally that took place on SE. I see huge potential for this company's future growth, but I think more downside is to come to give SE fair value.
Along with fair value, and these gaps SE has been unable to reclaim any weekly moving averages, and the TTM_SQUEEZE Momentum Indicator shows more bearish momentum coming.
The monthly chart will get to the point of being oversold, probably near these gap fills. At these gap fill areas, and the way down would be a proper time imo to be covering short positions.
The market also seems to have some more pain ahead, and interest rates will only hurt this company and the markets more, driving the stock down fundamentally.
Long : I do believe in this company's long term outlook and performance. I do think that this will take a while to turn around... But if these gaps get filled, the Risk/Reward on SE will be favorable if the company has only grown. I am going to be extremely patient on SE but will be ready to hunt the discount if these gaps do become filled. I Will also keep my eye on the TTM_Squeeze on the MONTHLY chart, as the Monthly chart has been getting extreme momentum to the bearish side, and will look extremely oversold in the coming months with more downside.
Thesis : Short to Gaps ; Long @ Gap Fills

Prosus gap filledJSE:PRX has closed its June gap, JSE:NPN is yet to fill its gap. PRX is trading below key MAs, if there's no bounce here, it might go test the recent low at R710.

SPY to the DOWNSIDE with momentumNo floors are present in this gap. Could be a bull-up to a super dump, dump needs momentum to dump so that a reversal is impossible, a good idea to raise the market about water and then take it's life jacket away.

SPY: Very bearish! What could make it bounce?• So far, SPY is heading to the next support at $360.69, indicating we have a few more bucks to drop, and there’s no technical evidence pointing to a reversal. In the daily chart, at least, there’s not a single bullish pattern yet;
• We see some open gaps (yellow squares), and they will become targets, in the future, if (and only if) SPY triggers a reaction;
• In the 1h chart we see a possible bullish structure, a Double Bottom chart pattern. Keep in mind, this pattern wasn’t triggered yet, and maybe SPY won’t trigger it at all, but it is important to keep in mind a scenario where it’ll break the $370.21;
• By triggering this Double Bottom, SPY would bounce back up to the $388 (its next target);
• In my view, I would prefer to see it bouncing after a retest of the $360, but this could work too;
• This wouldn’t be a true bullish reversal sign, and maybe would be just a Dead Cat Bounce, but could be the beginning of a true mid-term reversal. I’ll keep you guys posted on this.
Remember to follow me for more analysis like this! Keep in touch.

COMPARISON DAX 2008 and 2022 1W Char Description: Possible But is Not Guarantee Long-Term Sell invest on DAX
if you are long-term investor, and you like long-term positions you can see for setup to enter the market
in my previous analysis I told about mega gap fill on DAX and other index, but you can see
for reversal char pattern as you can see in 2008 H&S Bottom to exit your long-term sell position
Warning: This is not a Financial Advice nothing is guaranteed I am not a financial expert or financial adviser I only share my opinion

SPX May Rally to Backtest H&S Neckline or Fill GapsPrimary Chart
SPX may rally this week to backtest the H&S neckline (now resistance) where SPX price experienced a downward breakout in late August 2022. So far, price action has come off the lows last week with some force and velocity.
Short-term price targets are 4106 first, and if that level holds, then 4137 and 4187. Much depends on the CPI print on Tuesday.
Bollinger Bands on the 2-hour chart show increasing directional volatility with an upward bias into this week.
Bollinger Bands on the daily chart have begun to narrow, showing that the trending downward move is temporarily paused while price chops within the recent range. Chop includes the current rally to retrace a substantial portion of the recent downtrending move since August highs.
Further technical evidence supporting ongoing choppy price action arises from the SPX triangle pattern discussed last week , where SPX bounced right off the lower trendline of the triangle—which is an upward trendline from June 2022 lows.
The H&S neckline where a backtest may occur is shown on the Primary Chart above. This area is around 4130-4150 SPX.
Two gap fill areas lie above the H&S breakout area around 4219 and 4279. If CPI on Tuesday comes in better than expected, these gap-fill areas could be filled before the downtrend resumes.
Fibonacci levels of resistance and support include a cluster of support from 4054-4072, 4106 (coinciding with the H&S neckline that may be backtested soon), 4137, 4187, and 4231. See Supplementary Chart A with Fibonacci Levels chart below.
A supply / resistance zone is near 4200-4220, coinciding with the lower gap-fill area.
Supplementary Chart A: Fibonacci Levels to Watch over The Next Week
Please note that this technical-analysis viewpoint is short-term in nature . This is not a trade recommendation, and countertrend trading, e.g., trading a rally in a bear market, is tricky and challenging even for the most experienced traders. Countertrend trades are lower probability trades as well.
Author's Comment: Thank you for reviewing this post and considering its charts and analysis. The author welcomes comments, discussion and debate (respectfully presented) in the comment section. Shared charts are especially helpful to support any opposing or alternative view. This article is intended to present an unbiased, technical view of the security or tradable risk asset discussed.
DISCLAIMER: This post contains commentary published solely for educational and informational purposes. This post's content (and any content available through links in this post) and its views do not constitute financial advice or an investment recommendation, and they do not account for readers' personal financial circumstances, or their investing or trading objectives, time frame, and risk tolerance. Readers should perform their own due diligence, and consult a qualified financial adviser or other investment / financial professional before entering any trade, investment or other transaction.
SP:SPX
AMEX:SPY
CME_MINI:ES1!

GAP coveredI was expecting this, we had to cover the GAP if we want to go higher, so its good to buy here.

Veeva SystemsThis is a daily chart of Veeva Systems (VEEV), a healthcare technology company that provides cloud solutions for the global life sciences industry.
When the company reported its earnings on August 31st the stock price subsequently gapped down, as shown in the chart above. From a probability standpoint, this gap is likely to be filled for the reasons below.
1. The gap is a monthly candle gap and these usually close.
Unfilled gaps on the monthly charts are generally quite rare, especially for assets that have never left a monthly gap before. As shown in the chart below, VEEV has never left a gap on its monthly chart before.
2. The gap is below the lower regression channel line. A regression channel is used to measure how far above or below an asset is trading from its mean. Since price generally tends to mean revert, it's highly unlikely that a gap below the lower channel line, (which in this case represents two standard deviations below the mean), will never be filled. It's more likely that the gap will not only be filled, but will be filled quite rapidly. The assumption I make in using this regression channel is that it is statistically valid and data are normally distributed. If true, then there's only a small probability that VEEV's monthly candle will close the month so far below the lower line of the regression channel. Therefore, it's likely that price will be drawn back up to the mean, and thus the gap will be filled.
Here's a close up view:
3. Price gapped below an important Fibonacci level that has been holding, and likely will continue to hold, as support. See the chart below.
Here are some close up views:
At a minimum, price will very likely push back into the 180s.
The quarterly chart shows long lower wicks at this Fibonacci level, indicating that it is holding as support. With further momentum to the downside waning as shown by the Stochastic RSI, there's little reason to believe this Fibonacci level will fail this time.
The lower wicks on the quarterly candles are also bouncing off of the exponential moving average (EMA) ribbon, which usually acts as support when price descends to it from above.
Strategy
With this said, I noticed that someone is already sweeping the call options. They swept hundreds of out-of-the-money (OTM) call options expiring on 9/16 with a $180 strike. Clearly, this buyer believes that VEEV's price is poised to quickly return at least to the Fibonacci support level of $180.97.
If you don't know what an options sweep is, it simply refers to an instance in which options are purchased right at the ask price. In most cases, buyers place a limit buy at the mid point of the bid-ask spread or at a lower target price. Market participants usually only buy at the ask price if they're in a rush to buy and/or if they have a high confidence about a certain market move and want to guarantee their entry while also not tipping the market off about their anticipated market move. Sweeps can also refer to when a large buyer wants to obfuscate their entry by splitting their large order into a lot of smaller parts to sweep the entire order book without tipping off the market as they would have if they placed a single large limit order. Understanding sweeps can help you understand what smart money is doing. It's very rare that retail traders sweep the order book because it's very expensive, and for a smaller portfolio (less than a million) it can be extremely risky. Therefore, smart money is usually the market participant who sweeps the order book.
Personally, I find this call sweep to be risky (assuming that it's not part of some kind of a hedge) since although we have a high confidence that the gap may close, we don't know within what time frame it will do so. Rather than sweeping a call option with a strike price of $180 that expires on 9/16 a safer though less lucrative trade would be to sell a cash-secured put with a strike price of $180 and which expires on 9/16. Doing this gives you much higher odds of winning but is profit limited.
If the price goes to $180 or higher at expiration, you win the full premium since the put you sold will not be exercised.
If the price is below $180 but above the breakeven price at expiration, or if the price is below even your breakeven price, then you may be forced to buy shares of VEEV at $180, but you can simply hold those shares until the gap closes (or longer if you think price is going higher). Therefore in this case you still do not lose money, and still make the premium as profit.
The only plausible scenario whereby you would lose money would be if VEEV's price continued to plummet and never recovers. Although this would be incredibly unlikely, it is still possible. You can nonetheless still hedge against even this risk by using a put spread to limit loss potential to a ratio that meets your risk management strategy. Therefore you can safely take a very high probability trade while managing risks well. Successful trading is mostly determined by how well you manage risks.
Finally, since options are leveraged, one should always try to time their entry as perfectly as possible by using shorter timeframe (hourly or 4-hour) charts, especially if the option's expiration is close. For example, you can see that the 4 hour chart for VEEV is showing momentum building back to the upside. This is what you want to see if you're going to sell a put option strategy that expires on 9/16.
These are just my thoughts and they are definitely not meant to be trading advice. As always, anything can happen. September can often be a volatile month and is prone to declines. Options trading is risky and can result in complete loss. Trade at your own risk.
If you would like me to post more strategies like this on here leave a boost or a comment below so I can gauge interest. Thank you.
If you're new to trading and don't understand the options trading language that I used above, I would recommend Project Finance to learn about options. I learned a ton about options trading from this channel and the content is always high-quality: www.youtube.com
If you want to learn more about the basics of trading, you can see my post linked below for 10 rules for successful trading.

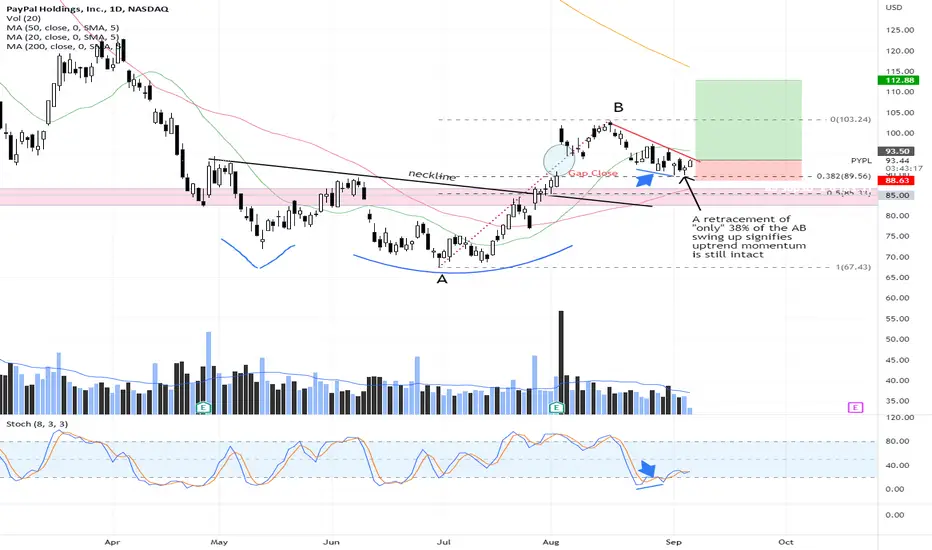
PYPL - bullish divergencePYPL broke out of an Adam & Eve formation on 27 Jul, then gapped up strongly upon Earnings on 3 Aug. Since then, it has retraced about 38% of it's AB swing up and appear to find support @ 90 where the gap is closed.
The stock could be ready to begin another up swing as we are seeing some bullish divergence between price and stochastic. Stops raised to just slightly below $89.
Disclaimer: Just my 2 cents and not a trade advice. Kindly do your own due diligence and trade according to your own risk tolerance and don't forget that money management is important! Take care and Good Luck!
Joe Gun2Head Trade - Gap fill on NZDCADTrade Idea: Selling NZDCAD
Reasoning: Filled the overnight gap at likely to head lower
Entry Level: 0.8016
Take Profit Level: 0.7962
Stop Loss: 0.8031
Risk/Reward: 3.67:1
Disclaimer – Signal Centre. Please be reminded – you alone are responsible for your trading – both gains and losses. There is a very high degree of risk involved in trading. The technical analysis , like all indicators, strategies, columns, articles and other features accessible on/though this site is for informational purposes only and should not be construed as investment advice by you. Your use of the technical analysis , as would also your use of all mentioned indicators, strategies, columns, articles and all other features, is entirely at your own risk and it is your sole responsibility to evaluate the accuracy, completeness and usefulness (including suitability) of the information. You should assess the risk of any trade with your financial adviser and make your own independent decision(s) regarding any tradable products which may be the subject matter of the technical analysis or any of the said indicators, strategies, columns, articles and all other features.

Nasdaq Gap FillToday bias is buys as well. I will be looking for opportunities to take price into equilibrium(50%) as first target and than will target 50% of the marked imbalance. Will keep you updated when New York session begins.
Good Luck!

$AMZN earnings gap fill$AMZN is filling the gap from earnings. Let's see if it fills the whole gap down to 100/50MA that were just about to cross back to normalcy. Doni candle on close might create a new pivot.

Ethereum CME Future - gap & volume profile updateEthereum CME Future - gap & volume profile update
We have a new small gap where ETH price could not break gap resistance at $1,624.5
If current volume support at $1,493.5 does not hold... a lack of volume might bring prices down to the gap support at $1,359.0 quite quick
Will keep you updated dear Crypto Nation
*not financial advice
do your own research before investing

$SPY - scenario 1 worked out well. Gap filled. What's next? Scenario B or perhaps even lower to 400-390-385?

