XAUUSD H4 Outlook – “Fed Week: Only the Real Zones”Hello, gold traders!
FOMC week is here, the dollar’s flexing, and gold is stuck under a fortress of supply. No fantasy, no overlaps, just your real, actionable H4 map—zones spaced, logic tight, and all fluff deleted.
⬜Bias:
Neutral to bearish while price is capped under 3,355 and the EMA cluster.
Only flip bullish if price closes and holds above 3,375 with strong confirmation after news.
Current Price: 3,336.81
Summary for your audience:
Neutral–bearish: All the EMAs (21/50/100/200) are overhead, and the primary supply and decision zones are blocking any upside.
No reason to flip bullish unless gold breaks out and holds above both the decision zone and the full supply ceiling after major news.
All bounces into supply are likely to get faded, unless the structure changes dramatically post-FOMC.
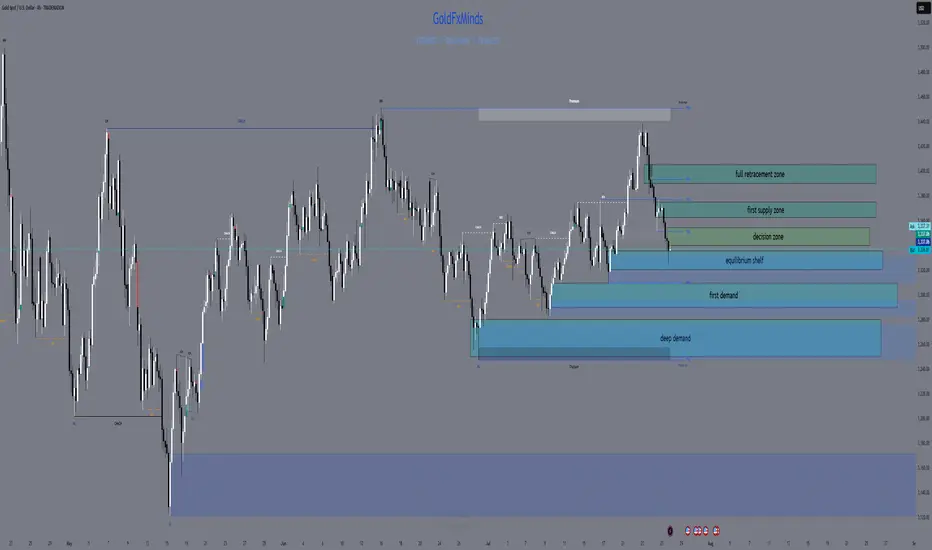
🟥 ULTRA SUPPLY ZONE: 3,390 – 3,405
127–161.8% Fib extension—liquidity grab and stop-hunt target for news-driven spikes
Only short if you see a monster upper wick and hard rejection
🟥 PRIMARY SUPPLY: 3,365 – 3,375
All EMAs (21/50/100/200) are stacked overhead; unfilled FVG at 3,370–3,375
Short on a clear rally rejection or bearish engulfing candle—this is where most breakouts get trapped
🔶 DECISION ZONE: 3,340 – 3,355
EMA100/200 straddle this level; small FVG at 3,350–3,352
Market “decides” here—fade unless price closes decisively above 3,355
🔵 EQUILIBRIUM SHELF: 3,320 – 3,335
50% Fib at 3,327; filled FVG at 3,325–3,330; SMA50 just below
Bounce/fake-break zone—wait for a clean H4 reversal, not a guess
🟢 FIRST DEMAND BASE: 3,290 – 3,310
H4 Order Block, hidden FVG (3,300–3,305), Fib 38.2% around 3,295
Longs only with strong pin-bar/engulf and quick EMA50 reclaim
🔵 DEEP PULLBACK BAY: 3,250 – 3,280
Weekly EMA21 and 61.8% Fib (~3,260), strong volume
Only consider a long on a panic flush and a powerful reversal wick
⚡️ MACRO CONTEXT
USD: On fire into ADP and FOMC; gold moves will be explosive, not logical
Events:
Tue: ADP
Wed: FOMC + Powell
Thu: Core PCE
Fri: NFP, ISM
Bias: Neutral-bearish under 3,355; only bullish if we close and hold above 3,375
EMAs: Clustered tightly overhead—bulls get no respect until this ceiling is crushed
🎯 TRADE LOGIC
Shorts:
3,390–3,405 (big wicks and clear rejection only)
3,365–3,375 (news spike or failed breakout with bearish candle)
Longs:
3,340–3,355 (only on a confirmed close above)
3,320–3,335 (strong reversal only—don’t front run)
3,290–3,310 (classic H4 pin-bar/engulf + EMA50 reclaim)
3,250–3,280 (deep panic flush and major reversal only)
NO TRADE: In the gaps—let the gamblers get chewed up, not you.
💬 Which zone will you snipe? Drop a comment and show you’re here for structure, not noise!
👍 Like & Follow for high-value, real-time sniper maps every day.
Disclosure: Chart via Trade Nation’s TradingView feed. Influencer Program participant.
GoldFxMinds 💛
Gaps
Daily XAUUSD Outlook — Riding the Fed Wave (July 28, 2025)Hey Gold Hunters! 🌟
Today feels like the calm before a storm—ADP whispers tomorrow, the Fed speaks Wednesday, and gold is inching toward its next big move. Let’s weave the macro pulse into our Smart‑Money map, highlight the five real zones, then plot our sniper‑perfect entries. No fluff—just the human beat of the market.
1️⃣ Macro Pulse & Market Mood
US Dollar: Bullish tilt as markets price in another hawkish Fed pause.
Tomorrow (Tue): ADP jobs print could spark an early swing.
Wed PM: FOMC Statement & Powell’s press conference—biggest catalyst this week.
Thu/Fri: Core PCE, Unemployment Claims, then Friday’s NFP + ISM Manufacturing.
Gold is caught in suspense: a squeeze here (into supply) or a slide there (into demand) will come fast once the Fed drops its hint.
🧭 Bias: Neutral‑bearish—looking for lower highs under the 3,345–3,375 supply zone, with a preference to short rallies into that band until price convincingly breaks and holds above 3,375. Once we see a clean weekly‑style close above that level, we’ll flip to neutral‑bullish.
2️⃣ Five Breathing Zones (Top → Bottom)
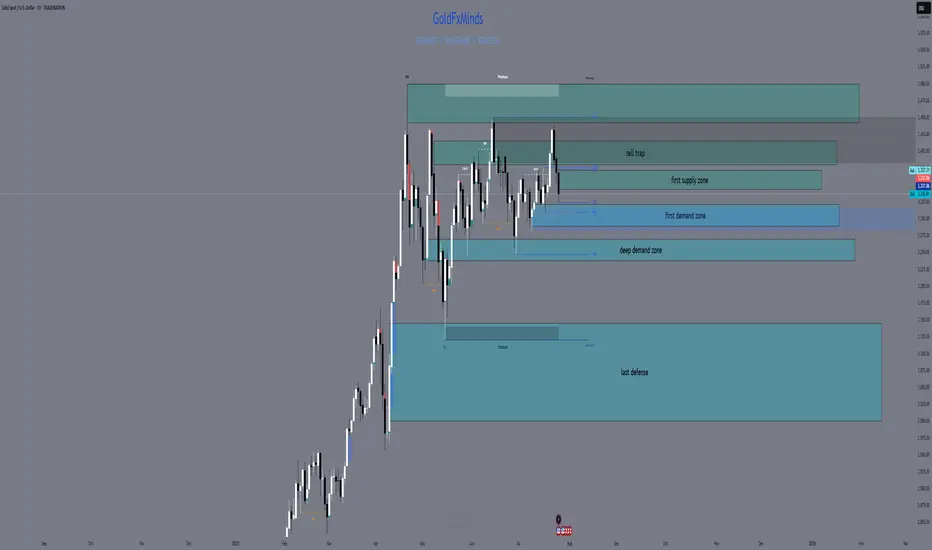
🛑 Zone 1 “Sky Trap” (3,380 – 3,415)
The final airspace above our daily EMAs (10/50) where stops are hunted. Fib ext’s 127%–161.8% and an unfilled Fair‑Value Gap live here. Any spike that ends in a long upper wick or bearish engulf = short‑trap.
(let price fall clear of this zone before the next)
⚔️ Zone 2 “Premium Supply” (3,345 – 3,375)
The two‑week high order block, hugged by EMA50 and Fib 61.8%. Friday’s rejection candle was born here. Watch for bearish PA after a retest—your core sell zone.
(space down to next)
🌊 Zone 3 “First Demand Cove” (3,290 – 3,320)
Where mid‑June’s buyers piled in: June consolidation OB, filled FVG, and Fib 38.2–50% confluence. SMA100 sits below for extra gravity. A clean drop and bullish reaction here = sniper‑long trigger.
(gap to deep zone)
🚀 Zone 4 “Deep Pullback Bay” (3,240 – 3,270)
Hidden Fair‑Value Gap, BOS origin, and weekly EMA21 converge. If Zone 3 breaks, this is your deep‑dip reload—hunt that D1 reversal wick.
(last space)
🛡️ Zone 5 “Macro Reset Block” (3,000 – 3,140)
The root of 2024’s CHoCH, EMA200/SMA200 cluster, and 78.6–88.6% Fib retrace. Only if gold truly panics on a USD blitz—ultimate accumulation.
3️⃣ Sniper‑Perfect Scenarios
🔴 Short Setup
Where: A thrust into Zone 1 or 2 (3,345+).
Cue: Long upper wick → bearish engulf on D1/M30.
Edge: FVG fill + Fib confluence + RSI rollover.
🟢 Long Setup
Where: A dip into Zone 3 or, if swept, Zone 4.
Cue: Bullish pin‑bar or engulf + reclaim of EMA10/50.
Edge: June OB base + RSI bounce from ~50.
4️⃣ Your To‑Do List
Morning Watch: Does gold flirt with 3,375? Prep your shorts.
Mid‑Day Pull: A drop to 3,300? Hunt your longs.
Avoid: The gaps between zones—those are “no‑man’s land.”
News Trades: Let the daily candle close post‑Fed before committing.
💬 What’s your plan today? Comment below—let’s refine our edge!
👍 Enjoyed this map? Smash that Like & Follow for more pulse‑driven, zero‑fluff outlooks.
Disclosure: Chart powered by Trade Nation’s TradingView feed. I participate in their Influencer Program.
GoldFxMinds 💛
Volume Gaps and Liquidity Zones: Finding Where Price Wants to GoDifficulty: 🐳🐳🐳🐋🐋 (Intermediate+)
This article is best suited for traders familiar with volume profile, liquidity concepts, and price structure. It blends practical trading setups with deeper insights into how price seeks inefficiency and liquidity.
🔵 INTRODUCTION
Ever wonder why price suddenly accelerates toward a level — like it's being magnetized? It’s not magic. It’s liquidity . Markets move toward areas where orders are easiest to fill, and they often avoid areas with little interest.
In this article, you’ll learn how to identify volume gaps and liquidity zones using volume profiles and price action. These tools help you anticipate where price wants to go next — before it gets there.
🔵 WHAT ARE VOLUME GAPS?
A volume gap is a price region with unusually low traded volume . When price enters these areas, it often moves quickly — there’s less resistance.
Think of a volume gap as a thin patch of ice on a frozen lake. Once the market steps on it, it slides across rapidly.
Volume gaps usually show up on:
Volume Profile
Fixed Range Volume tools
Session or custom volume zones
They’re often created during impulsive moves or news events — when price skips levels without building interest.
🔵 WHAT ARE LIQUIDITY ZONES?
Liquidity zones are price areas where a large number of orders are likely to be sitting — stop losses, limit entries, or liquidation levels.
These zones often form around:
Swing highs and lows
Order blocks or fair value gaps
Consolidation breakouts
Psychological round numbers
When price approaches these areas, volume often spikes as those orders get filled — causing sharp rejections or breakouts.
🔵 WHY THIS MATTERS TO TRADERS
Markets are driven by liquidity.
Price doesn’t just move randomly — it hunts liquidity, clears inefficiencies, and fills orders.
Your edge: By combining volume gaps (low resistance) with liquidity zones (target areas), you can forecast where price wants to go .
Volume gap = acceleration path
Liquidity zone = destination / reversal point
🔵 HOW TO TRADE THIS CONCEPT
1️⃣ Identify Volume Gaps
Use a visible range volume profile or session volume. Look for tall bars (high interest) and valleys (low interest).
2️⃣ Mark Liquidity Zones
Use swing highs/lows, OBs, or EQH/EQL (equal highs/lows). These are magnet areas for price.
3️⃣ Watch for Reactions
When price enters a gap, expect speed.
When it nears a liquidity zone, watch for:
Volume spike
Wick rejections
S/R flip or OB retest
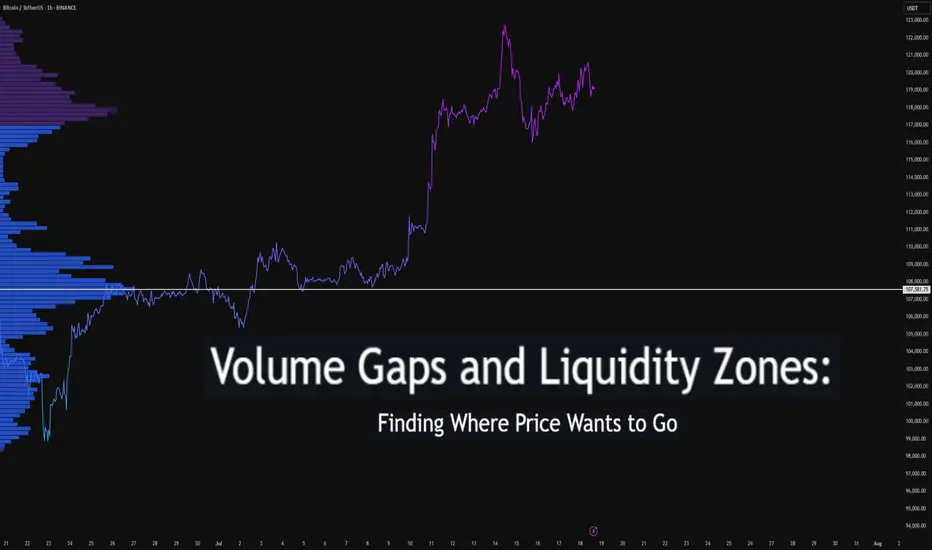
🔵 EXAMPLE SCENARIO
A strong bearish move creates a volume gap between 103 000 – 96 000
Below 96 000 sits bullish order blocks — clear liquidity
Price enters the gap and slides fast toward 96 000
A wick forms as buyers step in, volume spikes — the reversal begins
That’s price filling inefficiency and tapping liquidity .
🔵 TIPS FOR ADVANCED TRADERS
Use higher timeframes (4H/1D) to define major gaps
Look for overlapping gaps across sessions (Asia → London → NY)
Align your trades with trend: gap-fills against trend are riskier
Add OB or VWAP as confirmation near liquidity zones
🔵 CONCLUSION
Understanding volume gaps and liquidity zones is like reading the market’s intention map . Instead of reacting, you start predicting. Instead of chasing, you’re waiting for price to come to your zone — with a plan.
Price always seeks balance and liquidity . Your job is to spot where those forces are hiding.
Have you ever traded a volume gap into liquidity? Share your setup below
XAUUSD Daily Sniper Plan – July 17-18, 2025Hello traders!
After yesterday’s high-volatility trap and NY session recovery, we now stand at a major structural junction. Buyers reclaimed 3310–3314 with precision, but price is pressing into multi-timeframe supply. Let’s break it down clearly
🔸 HTF Bias
Daily Bias: Bullish correction inside a larger range. Demand at 3310–3305 was swept and respected, but supply at 3347–3360 caps upside.
H4 Bias: Bullish flow into supply. Structure printed clean HLs from 3295–3310. However, current zone is full of short-term profit-taking risk.
H1 Bias: Bullish short-term trend. Price built higher lows from 3310, but now sits at 3340–3347 — reactive zone where momentum could fade if no breakout.
🔸 Key Structural Zones (with role)
🔺 Supply Zones (Above Price):
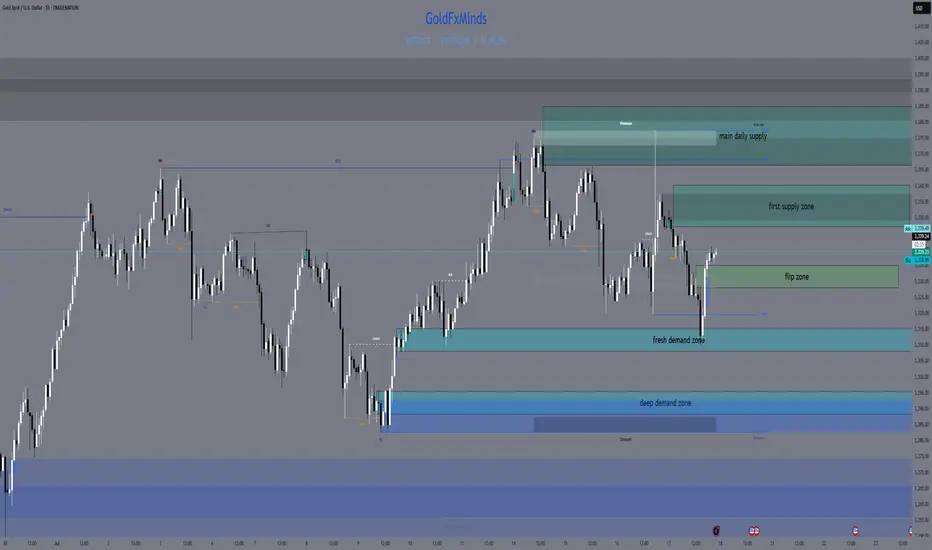
3347–3360 (D1/H4/H1 Supply)
🔹 Multi-timeframe confluence
🔹 Previous reaction + NY trap zone
🔹 Expect heavy rejection or false breakout wicks
3366–3385 (D1 Supply)
🔹 Final liquidity shelf for buyers
🔹 Only valid if 3347 breaks clean
🔹 Longs must wait for confirmation after breakout
⚔️ Decision Zones (Middle):
3335–3328 (Intraday Flip Zone)
🔹 M15-M30 structure control
🔹 Buyers can reload here on clean bounce
🔹 If price closes below, opens door for bearish momentum
🔻 Demand Zones (Below Price):
3314–3310 (H1/H4 Demand – Key Buy Area)
🔹 Institutional demand origin
🔹 Price tapped, swept, and reclaimed
🔹 Ideal sniper buys only on retest with bullish M15 BOS
3305–3295 (Deep Reversal Demand)
🔹 Extreme discount
🔹 Valid only if 3310 fails
🔹 High RR buys if liquidity sweep appears
🔸 Sniper Battle Plan 🎯
Scenario 1 – Fade from 3347–3360:
🔹 If rejection signs (M15 FVG + RSI divergence), short toward 3335, 3314
🔹 Only enter if NY open confirms exhaustion
Scenario 2 – Pullback to 3335–3328:
🔹 Ideal quick buys on bounce with confirmation
🔹 Watch for BOS on LTF for sniper entry
Today’s zones require real discipline: no rush, no panic — just clear steps, sharp entries, and clean rejections or retests. You already saw what 3310–3305 reacted. The next move? You plan it. You take it. You own it.
✨ Which zone are you watching for your next move?
Drop a comment, leave a 🚀🚀🚀and follow for more sniper-level clarity — every single day.
Let’s keep mastering this market. Together.
Disclosure: All plans are built on Trade Nation live feed. Educational only.
Earnings HFT gapsThe gaps that form during earnings season on or the next day after the CEO reports the revenues and income for that past quarter are always HFT driven. The concern over the past 2 previous quarters was the fact that the High Frequency Trading Firms were incorporating Artificial Intelligence into their Algos to make automated trading decisions on the millisecond scale. These small lot orders fill the ques milliseconds ahead of the market open in the US and any huge quantity of ORDERS (not lot size) causes the computers of the public exchanges and market to gap up or gap down, often a huge gap.
This can be problematic for those of you who use Pre Earnings Runs to enter a stock in anticipation of a positive to excellent earnings report for this upcoming quarter.
The HFT algos had several major flaws in the programming that did the opposite: The AI triggered sell orders rather than buy order causing the stock price to gap down hugely on good earnings news.
Be mindful that normal gaps due to a corporate event are far more reliable and consistent.
When you trade during earnings season, be aware that there is still added risk of an AI making a mistake and causing the stock to gap and run down on good news.
It is important to calculate the risk factors until it is evident by the end of this earnings season that the errors within the AI programming have been corrected and that the AI will gap appropriately to the actual facts rather than misinterpreted information.

XAUUSD NY SESSION FLOW – JULY 8→ 9 , 2025"Structure doesn’t lie. Price answered exactly where we expected it to."
Hey traders 👋
Let’s set the record straight after today’s precision bounce. We saw textbook price action across all sessions — Asia triggered the short from our 3344–3351 HTF supply, and both London and New York followed through with no hesitation, driving price down to 3287.
But here’s the key point:
🧨 3287 was just 10 pips above our clean 3286–3280 buy zone.
No mitigation. Just a front-run.
That’s what real liquidity does — grabs what it needs before the crowd gets in. Our zone is still valid… just untouched.
🔍 HTF BIAS & STRUCTURE UPDATE
📆 Daily Bias:
Structure is still bearish — lower highs, CHoCH, and soft RSI.
EMAs 5/21 are flat. No power for bulls unless 3351 breaks.
⏰ H4 Bias:
New lower high confirmed after rejection from our 3344–3351 zone.
Trend is still bearish unless we reclaim 3330+ with conviction.
Liquidity is driving movement, not news.
🕐 H1 Flow:
Bounce from 3287 = engineered reaction before real demand
Price now hovering above 3306, forming mid-structure
No trade in the middle. Let’s work the edges.
🎯 TODAY’S SNIPER ZONES
🔻 SELL ZONES
1. 3325–3330
Nearest short trap. OB + inefficiency + H1 rejection base.
If price returns, watch M15/M30 for CHoCH or BOS → entry.
2. 3344–3351
Our major HTF supply. Asia already reacted from top half.
If revisited, this zone remains the high-probability rejection zone.
3. 3380–3394
Premium OB + imbalance pocket.
Untouched zone far above — if tapped late in the week, watch for liquidity sweep → clean reversal potential.
🟢 BUY ZONES
1. 3297–3300
NY session bounce zone. Price tapped 3297 → pushed to 3306.
Still live for intraday reentry if price retests and confirms with BOS.
2. 3286–3280
Our true demand base. Price front-ran it by 10 pips — didn’t mitigate.
Still valid, still reactive. Don’t delete this zone.
3. 3263–3255
Last line of support. Deep zone — only comes into play if 3280 fails with conviction.
✅ EXECUTION REMINDERS
Price is hovering mid-range → don’t force entries
Only act if structure reacts at the edges (3325 or 3286)
3380–3394 may be a late-week trap if bulls get overconfident
📌 If this breakdown helped, hit 🚀 and drop a comment:
👉 Are you stalking 3325… or waiting for 3286 to finally wake up?
Let structure talk. You just execute.
GoldFxMinds 💭🔥
📢 Disclosure:
This analysis is based on the Trade Nation TradingView feed. I’m part of their Influencer Program and receive a monthly fee.
⚠️ Educational content only — not financial advice.

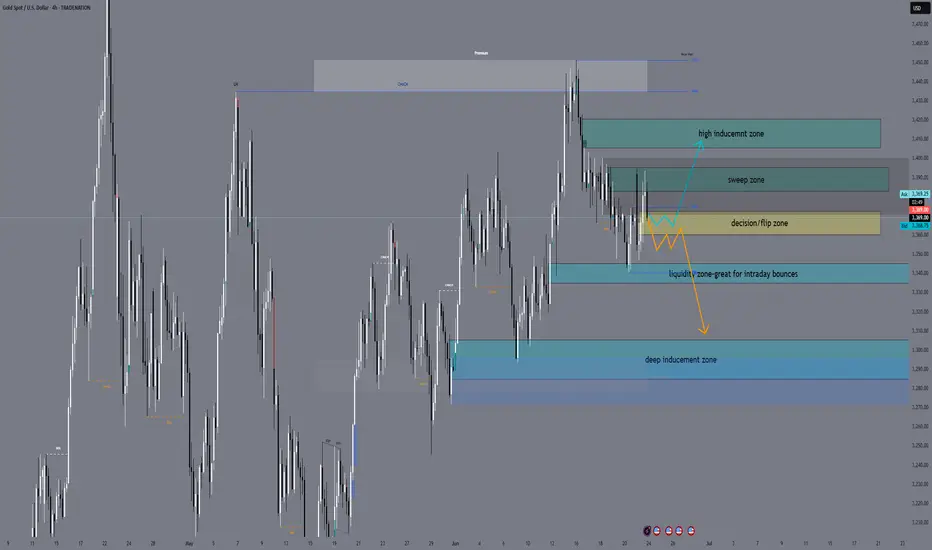
XAUUSD Daily Sniper Plan – June 24, 2025“Snipers wait. Structure tells the story.”
Hello traders! The market is stuck between the FOMC high at 3452 and the confirmed low at 3340. Price is compressing under H1 supply and above a key liquidity pocket. Here's your full plan with all sniper zones — now including a decision zone for intraday confirmation.
📰 Macro + Fundamental Context
Powell Testimony + multiple FOMC speeches today → high potential for dollar-driven volatility.
Inflation concerns and hawkish tone expected → short-term gold bearish pressure unless structure reclaims 3415+.
Smart money likely hunting liquidity both below 3340 and above 3400.
🔸 HTF Structure Summary (D1 → H4 → H1)
D1: Consolidation between 3452 and 3340. No new BOS.
H4: LL formed at 3340. LH not confirmed. Market is compressing under resistance.
H1: CHoCH + BOS confirmed. Current price sits in mid-range.
🔍 Sniper Entry Zones
🟥 Sell Zone 1: 3382–3395
H1 supply zone with previous rejection.
Includes order block + FVG.
Valid for new short entries if price returns and rejects.
🟥 Sell Zone 2: 3406–3420
High-risk spike zone from FOMC.
Only valid during fast, news-driven price movement.
Not a default entry unless confirmed rejection.
🟨 Decision Zone (Flip Area): 3360–3372
This is the key intraday flip level.
If price stays below, sell zones remain valid.
If price closes above, short bias is invalid and market may aim higher.
Use this zone to confirm bias before entering from either side.
🟩 Buy Zone 1: 3335–3345
Strong demand under equal lows.
OB + small imbalance on M15.
Valid for intraday long setups if confirmed with bullish price action.
🟦 Buy Zone 2: 3305–3285
H4 demand zone with major liquidity below.
Deep reversal area — only valid if price breaks 3340.
Smart money may be waiting here.
📌 Key Levels Summary
Zone Type Price Range Explanation
🔺 Premium OB 3450–3480 Daily supply zone
🟥 Sell Zone 1 3382–3395 Active H1 supply
🟥 Sell Zone 2 3406–3420 FOMC wick inducement
🟨 Flip Zone 3360–3372 Decision area — confirm bias
🟩 Buy Zone 1 3335–3345 Demand under equal lows
🟦 Buy Zone 2 3305–3285 H4 demand + deep liquidity
📣 Final Notes
📌 The market is at a critical moment. The flip zone (3360–3372) will decide tomorrow’s control: bear continuation or deeper retracement.
Watch price at the zone. Let the structure speak. Trade only where the logic is clean.
👁 Good luck in the market tomorrow, traders!
— GoldFxMinds
🟨 Disclosure: I am part of TradeNation’s Influencer Program and receive a monthly fee for using their TradingView charts in educational work.
XAUUSD Daily Sniper Plan – Monday, June 23, 2025Current Price: 3368.76
Trend: Bearish on H4 | Corrective on H1 | Weak Bullish Attempt on M15
Market Context: Gold is consolidating under EMA pressure after FOMC. Price is pinned inside a key flip zone, awaiting Monday’s fundamental triggers.
🔸 HTF Overview (D1, H4, H1)
📰 Macro + Economic Context – Week of June 23–28:
This is a high-impact week for USD with Fed speeches, inflation, and growth data. Monday opens with caution:
Monday, June 23
🟠 FOMC Member Waller Speaks
🔴 Flash Manufacturing & Services PMI
🟠 Existing Home Sales
Tuesday, June 24
🔴 Fed Chair Powell Testifies
🟠 CB Consumer Confidence
🟠 Richmond Manufacturing Index
Wednesday, June 25
🔴 Powell Testimony (Day 2)
🟠 New Home Sales
Thursday, June 26
🔴 Final GDP q/q
🔴 Unemployment Claims
🟠 Durable Goods Orders
🟠 Pending Home Sales
Friday, June 27
🔴 Core PCE Price Index
🟠 Revised UoM Consumer Sentiment
📌 Monday is lighter in impact, but PMI data and Waller’s speech may spark the week’s directional bias. Avoid trading blindly into PMI spikes.
H4 Structure & Bias:
Bearish trend intact: Lower High = 3418, Lower Low = 3311
EMAs (21/50/100) aligned downward — price capped below 3380
RSI still under 60 = no bullish momentum
Rejection zone remains valid at 3406–3420 (H4 OB)
Strong demand expected at 3340–3352 and extreme at 3310–3288
🔸 LTF Precision (M30, M15)
Price compressing around 3365–3372
RSI around 56 → indecision
No bullish HH above 3380 = still within bearish control
EMA flattening → prepare for trap setups around NY open
🧭 Trade Scenarios
🔻 Sell Zone – 3406–3420
H4 OB, FVG top, liquidity above 3405
Entry: 3412
SL: 3426
TP1: 3312
TP2: 3288
TP3: 3265
🧠 Wait for sweep or strong bearish reaction — no early entries.
⚠️ Flip Zone – 3360–3380
No-trade zone: EMA cluster + mid-FVG
Only use for confirmations, not entries
🟢 Buy Zone – 3340–3352
OB + demand + Fib retracement
Entry: 3348
SL: 3334
TP1: 3448
TP2: 3472
TP3: 3490
🟢 Buy Zone – 3310–3288
Below LL sweep (3311)
Deep liquidity + OB demand
Entry: 3298
SL: 3280
TP1: 3365
TP2: 3405
TP3: 3440
📍 Key Structural Levels – June 23
Level Type Role
3460 Bull Trap Limit Irrational spike area
3445 FOMC Unfilled wick – trap zone
3426 Sell Zone Risk protection above OB
3418 H4 LH Confirmed bearish structure
3410 OB Midpoint Micro-rejection inside OB
3395 Previous HH Inducement target
3384 FVG Top Minor LTF rejection
3360–3380 ⚠️ Flip Zone MA/FVG compression – avoid entries
3352 OB entry edge Buy Zone 1 upper limit
3340 OB base Buy Zone 1 key level
3311 H4 LL Confirms bear structure
3300 Round Level Psychological + liquidity
3288 OB base Final demand structure zone
3265 Final TP Bearish extension only
✅ Final Action Plan
📉 Stay bearish below 3380 unless a clean HH + OB support forms
⚠️ Avoid trading inside 3360–3380 flip zone during NY PMI data
🛒 Longs valid only from 3340 or 3310 with confirmation (RSI, PA, OB)
🧠 Focus on structure integrity and clean OB rejections only
💬 Will you fade the 3412 OB or wait for the sniper bounce at 3348?
🔔 Follow and 🚀@GoldFxMinds for premium breakdowns, macro updates, and real-time sniper execution guidance.
🔹 Disclosure: As part of Trade Nation’s Influencer Program, we receive monthly compensation for using their charts.
GoldFxMinds

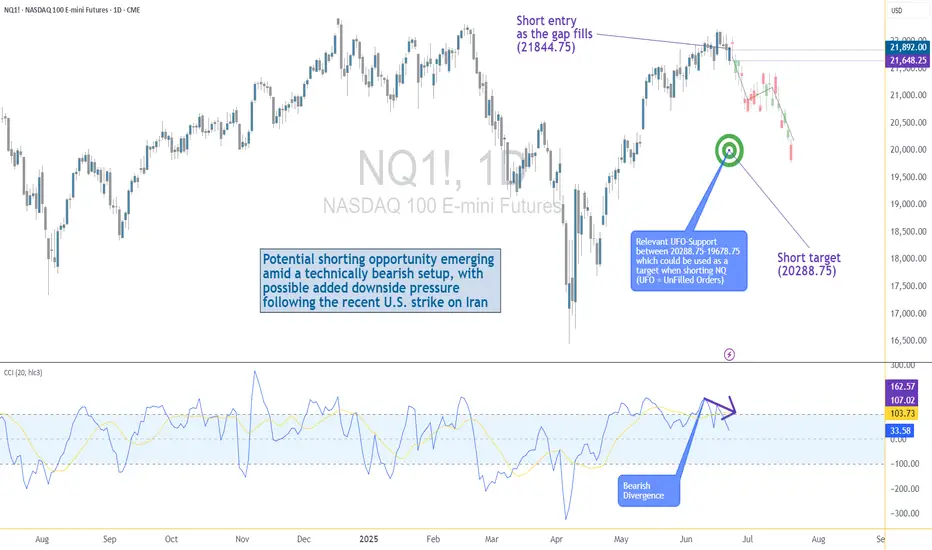
US–Iran Conflict Triggers a Potential Nasdaq Bearish Setup🟣 Geopolitical Flashpoint Meets Technical Confluence
The U.S. weekend airstrike on Iranian nuclear facilities has reignited geopolitical instability across the Middle East. While broader markets often absorb news cycles quickly, high-beta assets like Nasdaq futures (NQ) tend to react more dramatically—especially when uncertainty meets existing technical vulnerability.
Monday’s session opened with a notable gap to the downside, reflecting immediate risk-off sentiment among futures traders. While the initial drop is being retraced intraday, historical patterns suggest that such gap-fills can often serve as ideal shorting zones—particularly when other bearish signals confirm the narrative. The backdrop is clear: this is no ordinary Monday open.
🟣 Bearish Divergence on CCI Builds the Case
From a technical standpoint, the setup gains weight through a clear bearish divergence on the Commodity Channel Index (CCI) using a 20-period setting. While prices recently pushed higher, momentum failed to follow—an early indication that buyers may be running out of steam. This divergence appears just as price approaches the origin of Friday’s gap, a level that frequently acts as a resistance magnet in such contexts. This confluence of weakening momentum and overhead supply aligns perfectly with the geopolitical catalyst, offering traders a compelling argument for a potential reversal in the short term.
🟣 Gap Origin: The Line in the Sand
The origin of the gap sits at 21844.75, a price level now acting as potential resistance. As the market attempts to climb back toward this zone, the likelihood of encountering institutional selling pressure increases. Gap origins often represent unfinished business—zones where prior bullish control was suddenly interrupted. In this case, the added layer of global tension only strengthens the conviction that sellers may look to reassert dominance here. If price action stalls or rejects at this zone, it could become the pivot point for a swift move lower, especially with bearish momentum already flashing caution signals.
🟣 Trade Plan and Reward-to-Risk Breakdown
A potential short trade could be structured using 21844.75 as the entry point—precisely at the gap origin. A conservative stop placement would rest just above the most recent swing high at 22222.00, offering protection against a temporary squeeze. The downside target aligns with a prior UFO support area near 20288.75, where demand previously showed presence. This sets up a risk of 377.25 points versus a potential reward of 1556.00 points, resulting in a reward-to-risk ratio of 4.12:1. For traders seeking asymmetrical opportunity, this ratio stands out as a strong incentive to engage with discipline.
🟣 Futures Specs: Know What You’re Trading
Traders should be aware of contract specifics before engaging. The E-mini Nasdaq-100 Futures (NQ) represent $20 per point, with a minimum tick of 0.25 worth $5.00. Typical margin requirements hover around $31,000, depending on the broker.
For smaller accounts, the Micro Nasdaq-100 Futures (MNQ) offer 1/10th the exposure. Each point is worth $2, with a $0.50 tick value and much lower margins near $3,100.
🟣 Discipline First: Why Risk Management Matters
Volatility driven by geopolitical events can deliver fast gains—but just as easily, fast losses. That’s why stop-loss orders are non-negotiable. Without one, traders expose themselves to unlimited downside, especially in leveraged instruments like futures. Equally critical is the precision of entry and exit levels. Acting too early or too late—even by a few points—can compromise an otherwise solid trade. Always size positions according to your account, and never let emotion override logic. Risk management isn’t a side-note—it’s the foundation that separates professionals from those who simply speculate.
When charting futures, the data provided could be delayed. Traders working with the ticker symbols discussed in this idea may prefer to use CME Group real-time data plan on TradingView: www.tradingview.com - This consideration is particularly important for shorter-term traders, whereas it may be less critical for those focused on longer-term trading strategies.
General Disclaimer:
The trade ideas presented herein are solely for illustrative purposes forming a part of a case study intended to demonstrate key principles in risk management within the context of the specific market scenarios discussed. These ideas are not to be interpreted as investment recommendations or financial advice. They do not endorse or promote any specific trading strategies, financial products, or services. The information provided is based on data believed to be reliable; however, its accuracy or completeness cannot be guaranteed. Trading in financial markets involves risks, including the potential loss of principal. Each individual should conduct their own research and consult with professional financial advisors before making any investment decisions. The author or publisher of this content bears no responsibility for any actions taken based on the information provided or for any resultant financial or other losses.
USDJPY = Win. Finally? I have shit winrate, but at least this trade is "logical", and has followed the trading plan lol.
TRADING SPECS:
BIAS = DOWNTREND
NARRATIVE = 4HR BEARISH PD ARRAY(S/R FLIP+FVG)
CONTEXT = RESPECTED PREMIUM ARRAY + A Wave
ENTRY = SELL STOP ORDER @ A WAVE LOW (RUN ON LIQUIDITY). Nearly got SL'd. OPTIMAL ENTRY WOULD HAVE BEEN THE BEARISH FVG AFTER THE "4HR PREMIUM ARRAY REBALANCE" INSIDE CONTEXT AREA. THERE WAS A SHARP TURN IN THERE SOMEWHERE BUT I DIDN'T WAIT FOR THAT.
RISK MANAGEMENT = N/A(?) JUST LET TRADE PLAY OUT. BUT SL WAS INSIDE THE ORDERFLOW LEG(?)
Here's how it went:
1. Assessed Day Bias - price was downtrending. checked orderflow and candle science for this shit
2. Assessed Current Price "Intention" - price only does two things: seek liquidity, and rebalance fair value.
When I plotted my Key Levels, price was at a point where it was just done seeking liquidity(support + poc was swept) and it was reversing.
I see an S/R Flip + FVG area. If price goes here, that means price has rebalanced fair value.. so, logic dictates that it will reverse again to SEEK LIQUIDITY.
When I came back to this chart again, price has already rebalanced fair value, has respected the S/R Flip + FVG, and has started reversing down.
3. Picked Out a Target - I picked out something realistic. Here is where indicators/tools come in.
Instead of using my confluence mix(POC+FVG+OTE pd array) as entry points,
"I just used it as a target since... price has already rebalanced fair value at the higher TF, and it's already going down, so it's probably going to seek liquidity on the other side. It's most probable target before price may or may not do something else is the FVG+POC+OTE AREA."
My choice of liquidity category was the Previous Day Session nPOC. Along with the FVG and OTE, it was a strong "magnet", especially considering that price has finished seeking buy side liquidity and therefore the price's next target are the liquidities below.
Wow, this makes so much sense to me now.
Price always intend to bounce from opposite liquidities, from higher timeframe to lower timeframe... so...
4. Waited for PA that will Deliver Towards Target - I think my entry here was sloppy, the weakest part of this trade. But it made sense, and it still worked anyway.
I just found a sting candle down(the A wave) after tapping the (S/R Flip+FVG).. I set a sell stop limit on the exact low of that candle.
LOGIC was, if price pushed down below that sting, especially with a strong fvg, it would validate the RESPECT of the (SR FLIP+FVG), and it would continue going down(an invalidation of a long continuation idea)... probably to, again, seek liquidity below.
Reason why I think my entry was sloppy, is because I did not validate the trade idea first. I didn't wait for that sting candle to get "run on(liquidity)" first. I think in order to validate it, I would have waited for the sting to become a run on liquidity area first, and then a second bearish fvg candle close to confirm downtrend. It would have been too late and the profit would have been too small at that point.
5. Put SL at the Orderflow Leg Swing High - If price was really not intending to continue going up, it wouldn't have gone here, which it didn't. I nearly got stopped out, like the other trades I had on sunday and monday.
-------------
Here's the pattern that I keep seeing though, when price makes a valid HIGH(like in this case, the SRFLIP+FVG rebalance), price will attempt to go here atleast twice with a WICK, but will still make lower highs. Usually, those second and third wicks will form as if it's going to take the liquidities at those wicks, but it will just take out the CANDLE BODY HIGHS... So take note of these next time.
When price sweeps a higher timeframe FVG/LIQUIDITY, mark out the candle body closes as TARGET LIQUIDITIES, not the wicks. If a downtrend is valid, it will only take out the body close liquidities. I will make a diagram to help make this make sense lmfao.
-------------
I feel like a mad scientist at this point... endlessly trying to see the actual logic in the market. Not the probabilities of patterns playing out, but the CAUSES and EFFECTS.
I think I'm close to finding the pattern within the pattern... or the message hidden in the patterns(Arcane reference, anyone?).
But I think the two things I have found thanks to Arjo is...
"Price only does two things: 1. Seeking Liquidity 2. Rebalancing Fair Value
and Higher TF = Rebalancing Fair Value <-> Lower TF = Seeking Liquidity"
and
"The Higher the Timeframe, The Stronger the Timeframe"
Like... the market isn't random. I think these two things are the core principles of trading.
Because with these two ideas, you don't need a strategy. You need to UNDERSTAND this. And the strategy can be adapted to whatever you see on the chart.
You open EURUSD, and you see that price is on a downtrend, and it has recently rebalanced the bearish fair value gap on the 4HR? You know what price will do next. It will continue going down to seek liquidity below. So, with that information, what will you look for? How will you enter? Where will you set your entry point, your stoploss, and where is your target?
You open USDCAD, and you see that price is on an uptrend, it has already rebalanced fair value below, has made a bullish choch+FVG, and has respected that choch+FVG on a lower timeframe. You know it will seek buy side liquidity next. So how will you enter? Where will you place your stoploss? Where's your exit?
-------
Now, if only I can translate this knowledge into actual consistency in trading, I can finally make money.
But I guess doing the journal is great. I'm consistently at the 25-30% winrate. So with this understanding.. Maybe I can slowly push that winrate up over time.
I think mechanically, the trade entries i had a year ago and now was the same(choch+POC+FVG+OTE), but now I have the understanding of why it may work or why it won't work, and when do I apply it so I increase the odds of winning. So that's something.
Before, I didn't know why it did or did not work. But now, I know.
I can use this info moving forward to increase my odds.
-------
OH WAIT YEAH, IF I KNOW WHAT THE MARKET DOES AND WHY IT DOES WHAT IT DOES, THEN I WILL BE ABLE TO REFINE MY ENTRIES, BECAUSE NOW I KNOW WHY AND HOW I'M MAKING MY MISTAKES. HELL YEAH.
-------
I'm just not sure about whether I can stick to one entry strategy now, or if I should, or I won't trade something that looks doable under my principles... because I've studied everything, and it makes sense now. lmfao.
-------
if people are reading this(up to this point lol that was a long ash read), then thank you. Reply with your thoughts if ever.
Alright thanks bye

Two Daily Gaps attract market for pullbackAlthough S&P500 is within uptrend, recent days has left two clearly visible gaps behind. That means that it is highly possible that SPX will come back to cover those gaps in the near future, before it continue uptrend (if it will). Same picture at NDX chart with two 4H gaps.
I take this idea to apply to all markets including crypto. While chances to resume higher timeframe uptrend are valid for Bitcoin, Stock Indices will most probably influence it's short term price action.

SPY - A GAPTacular 2024And leaves a tiny one on today's open up top...Oops.
Couple of those lower ones were on a different time, but lots of these on the daily chart forgotten behind.
Someday...my SPY crash will come...

Price Gap Examples - Bitcoin FuturesSharing for educational purposes only.
█ Three Types of Gaps
There are three general types of gaps:
Breakaway Gap
Runaway (or Measuring) Gap
Exhaustion Gap
█ 1 — The Breakaway Gap
The breakaway gap usually occurs:
At the completion of an important price pattern.
At the beginning of a significant market move
Examples:
After a market completes a major basing pattern, the breaking of resistance often involves a breakaway gap.
Breaking major trendlines signaling a reversal of trend may also involve this type of gap
Key Characteristics:
Heavy volume often accompanies breakaway gaps.
They are typically not filled (or only partially filled).
In an uptrend, upside gaps act as support areas on subsequent corrections.
A close below the gap is a sign of weakness.
█ 2 — The Runaway or Measuring Gap
The runaway gap forms:
Midway through a trend (uptrend or downtrend).
Indicates the market is moving effortlessly, usually on moderate volume.
Key Characteristics:
In an uptrend, it signals strength.
In a downtrend, it signals weakness.
Acts as support or resistance during subsequent corrections.
Why "Measuring" Gap?
It often occurs at the halfway point of a trend.
By measuring the distance the trend has already traveled, the probable extent of the remaining move can be estimated by doubling the amount already achieved.
█ 3 — The Exhaustion Gap
The exhaustion gap appears:
Near the end of a market move.
Key Characteristics:
Occurs after objectives have been achieved and other gap types (breakaway and runaway) have been identified.
In an uptrend, prices leap forward in a final push but quickly fade.
Within a couple of days or a week, prices turn lower.
█ Conclusion
By understanding the types of gaps and their characteristics, traders can better interpret market signals and anticipate potential trends or reversals.
█ Source:
Murphy, John J. Technical Analysis of the Financial Markets: A Comprehensive Guide to Trading Methods and Applications. New York Institute of Finance, 1999. Chapter 4, "Price Gaps," pp. 94-98.

Bitcoin Week 48When looking at BINANCE:BTCUSDT.P and BINANCE:ETHUSDT.P you can clearly see that BINANCE:ETHUSDT.P closed above the previous week high while BINANCE:BTCUSDT.P didn't what indicate us as a bearish SMT.
BINANCE:ETHUSDT.P reached to a 1D gap from previous Q1 week which will be a resistance area.
This is why I would be bearish to BINANCE:BTCUSDT.P this week.
I would like to target the previous gaps marked in the chart above

ES1 Week 48Seems like this week CME_MINI:ES1! closed above the high of the previous Tertiary Quarter while CME_MINI:NQ1! didn't which indicate as bear SMT.
What supports this idea is the fact that CME_MINI:NQ1! is between two daily gaps of previous weeks in the same month Q1.
This make me believe that we are looking to retrace to previous gaps and I'm bearish this week.

Do You Trade Gaps? Here's What You Need to Know!📈 Trading gaps can provide some of the most reliable opportunities in the market—if you know how to handle them.
🔍 What is a gap?
A gap occurs when the price "jumps" between two levels, leaving an empty space on the chart. Gaps usually reflect strong market sentiment, news, or low liquidity during off-hours.
💡 Key points to consider:
1️⃣ Types of Gaps:
Breakaway Gap: Signals a new trend.
Continuation Gap: Often occurs mid-trend.
Exhaustion Gap: Marks the end of a trend.
2️⃣ How to Trade Them:
Identify if the gap is likely to fill or expand.
Use support and resistance around the gap.
Always keep an eye on volume—low volume could mean a false move.
3️⃣ Risk Management:
Gaps can be volatile! Use tight stop-losses and wait for confirmation before entering.
What’s your favorite strategy for trading gaps? Let’s discuss below! 👇

Crypto Week 47 AnalysisIt seems like that all Major 3 Crypto Coins are in Premium.
All of them are above True Week Open, True Month Open and True Year Open except for BINANCE:ETHUSDT.P Which is below True Year Open.
We are using a gap from previous Year Q4 that merge with a weekly gap. and we have a PSP in a weekly graph right about it.
Near True Year Open BINANCE:ETHUSDT.P there is a Gap from previous Monday in 3h graph.
I think I would like to see BINANCE:ETHUSDT.P getting into the 3h gap and targeting the True Year Open.
Current target in BINANCE:ETHUSDT.P is True year Open
After touching it I'll be bearish since the price is in a major Premium.

Futures Week 47 Monday AnalysisAs I see it the close target of both ES and NQ is the True Month Open.
On both of the True Month Open there is a gap from previous Monday in 6h chart.
The bullish movement that we had this week is supported by SMT between CME_MINI:ES1! , CME_MINI:NQ1! and CBOT_MINI:YM1! and 6h gap from previous Tuesday (Q2).
I don't see any relevant higher time frame gaps that the price can encounter until the True Month Open so my current target is that.
In my opinion CME_MINI:ES1! will get to the True Month Open first and will liquidate it, at the same time CME_MINI:NQ1! will get to a 90 minutes gap at AM session (Q3) and won't liquidate the True Month Open and we'll get a bearish SMT

Update on Tesla This is my update on Tesla stock.
A huge gap that was created today and looking to not go inside the gap.
Not seeing anything to show why this will continue going up without going back to the first GAP mentioned in the last post. Which was in October.
The GAP is showing a whopping 4% rise.

Update on teslaHi, quick update.
i do want to update some bearish technical scenerios that align with liquidity concepts. (neither bullish or bearish idea is 100% to occur and its important to prepare to all scenerios)
The latest test on demand was not what i was hoping to see. with prices making bad lows (confirm on TPO) and creating a liquidity pool, showing a lack of strength (market moves on the path of least resistance) from buyers(volume is low market shows uncertainty around current price).
We have a gap down (green rectangle) and bad lows, the last imbalances on the chart at 199.48 (if we dont consider the aug 5 bad lows duo to the japanese sell off)
These will hit stop losses and reset highly leveraged positions and most importantly will provide wallstreet a premium price on tsla shares.
That price aligns with targets from both bearish and bullish sides. as of now we are holding the daily 100 ema
the 200 EMA is 201 and the yearly VWAP is also confluencing with that EMA. SHOCKING!
If we are at the parliamentary supply a selling climax will follow.. and the target for it would close the imbalance and the gap would provide us a good low to buy from and grab upside liquidity if not break resistance finally.
in terms of RSI a sell off to that area will give us an oversold RSI on the daily and hit the orderblocks down there!
I am still bullish on tesla but acknowledging these bearish scenerios will help up understand what is happening if they happening. I closed my CFD position in tiny profit but i am still keeping my value investment on and havent sold a bit.
I will happily go further down and give myself a nice CFD trade on tesla from these price targets.!
This is not a financial advice but simply me sharing my ideas and journaling my investments and trading. I hope you all have a great day
I AM STILL BULLISH
THERES A REASON WHY THEY ARE CALLED SHORTS (SHORT TERM) AND LONGS (LONG TERM)

$AMZN: Fast Rebounds Reveal Fundamental Support LevelThe new technologies that Amazon is embracing, including robots/robotics, and a brilliant CEO keep this huge company moving forward.
The HFT-driven gap down in August was massive but the rebound was fast. This isn't the first time the stock has moved right back up to its prior quarter's fundamental support range, aka Dark Pool Buy Zone.
Now, NASDAQ:AMZN is slightly above that range to challenge the July high. A stock to watch ahead of its earnings report October 24th.

Dark Pool Buy Zone Stages More Gap Up PotentialNYSE:NKE gapped again with a breakaway gap jumping over resistance. These rarely fill and if the gap fills, it will be minimal. Volume was above average. This kind of gap up sequence can happen easily when a classic Shift of Sentiment pattern forms in Accumulation/Distribution indicators as a stock bottoms. But price remains well below the previous gap down. It may gap again as the stock challenges that resistance.

NAS Ideas This is just levels that I will be looking at for potential reversals or continuations ONLY.
