At Most, I See A Gap Fill to 4000.Markets could still fill the second gap around 4000, That would coincide with the 50EMA. Many stocks have already filled "the double gaps".
Gaps

$META Short Gap TradeIf $META doesn't open below my take profit or above my stop loss at 9:30am EST tomorrow morning, I will give it another five minutes to do so. If at 9:35am EST it still hasn't hit my take profit or stop loss, I will manually close the position.

$AAPL Long Gap Trade If $AAPL doesn't open above my take profit or below my stop loss at 9:30am EST tomorrow morning I will give it another five minutes to do so. If at 9:35am EST it still hasn't hit my take profit or stop loss, I will manually close the position.

$MSFT Long Gap TradeIf $MSFT doesn't open above my take profit or below my stop loss at 9:30am EST tomorrow morning I will give it another five minutes to do so. If at 9:35am EST it still hasn't hit my take profit or stop loss, I will manually close the position.

$TSLA Long Gap TradeIf $TSLA doesn't open above my take profit or below my stop loss at 9:30am EST tomorrow morning I will give it another five minutes to do so. If at 9:35am EST it still hasn't hit my take profit or stop loss, I will manually close the position.

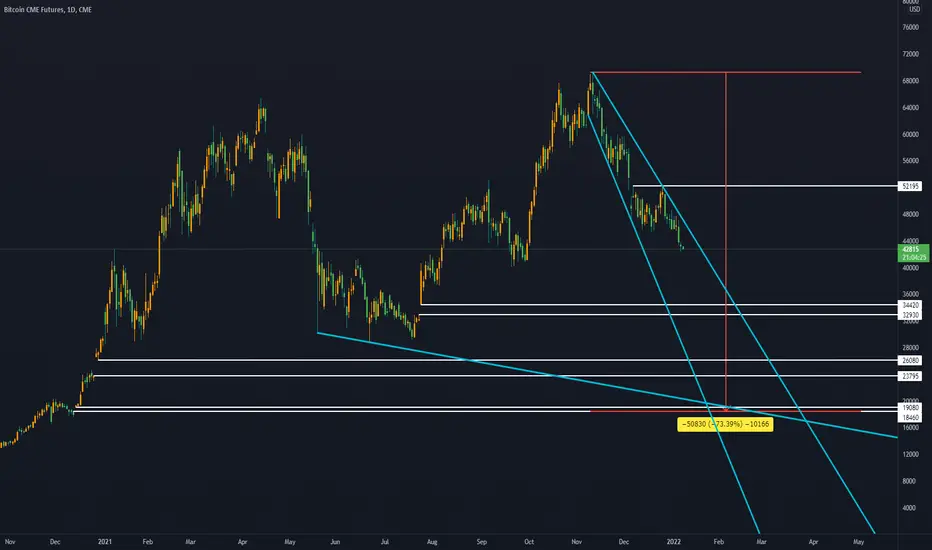
BTC TO $6900? The Gaps Say YesLet me start off by saying I am not short. I am not a BTC hater. I do not wish for this market to fail. But I must be a realist who must do a stoic analysis to become the most profitable investor I can be. If you haven't looked yet, please take a look at my linked idea "The bear is back with a vengeance". I am long term bull for BTC and because I believe BTC reaches way into the 6 figures I cannot ignore these unresolved gaps. 99% of gaps fill and these CME gaps have been long overdo. The gap levels are marked by pink lines. BTC price exploded from the lows and double topped with bearish divergence on the 3D RSI (see linked idea). We are not looking very bullish right now and given the LUNA mess I do not imagine a bunch of new money flooding into crypto right now. I think Citadel or Blackrock or whoever "the powers that be" are have it out for the stable coin market and I think a black swan event might be coming that causes this drop. Maybe Tether is the next UST? Maybe it is not and the price simply has a massive pullback due to the macros. These gaps can fill with BTC keeping its macro upwards trajectory. I think all the marked gaps get filled with a panic like dump similar to the March Covid crash and we bounce off the green downwards trend line and finally stabilizing on the green upward trendline. Also, contrary to what people say, BTC see's LARGER drawdowns after each bull run (read linked post) and that brings us to the high $6000. This is not what I want to see but it is a reality and dare I say inevitable. If BTC is really a long term asset class that is here to stay, these gaps need to be filled now. Would love to hear what you think. Please follow for more.

Looking for GAP 1 to fill around $160. BABA has been consolidating for awhile now. I'm looking for it to change direction and fill the gap around $161.

Oil Futures (45) Long Gap ReversalPrice runs up out of a relative low, Buyers step up and try to make a new high and confirm the major reaction Leg. Sellers holding at the high and pullback into a major reaction, buyers step up to the consolidation at the centre of the impulse leg up and make a new high. Buyers try to step up, break outs get washed and pulls back to re-test the minor confirmed low. Price finds orders and begins to consolidate, sellers press price into the buyers, they try to hold and expand up into the press before getting rejected with a WRB gap down. Minor confirmed low gets washed, price expands into the relative major pullback and zooms back through the sellers to land on the backside of the WRB gap down.
Trading the major impulse leg back to balance. Push of the press up

bitcoin price action scenariobitcoin break out from 45000 area and follow through bar Confirmation break out. but in pullback market close the gaps between break out and pb.
Because Previous move are tight chnanell i think The best thing seller will have is trading range. Because the first pb in tight chanell is minor.
Bitcoin behavior should be investigated in last high . if break out going 52000. if not we have trading range

Microsoft has gaps to fill. Fundamentally, Microsoft is a strong. This is a simple analysis of the gaps below after it broke through a long term support line. using daily candle notice how price bounced around the 1st gap. There are still plenty of gaps below so trade with caution for the rest of the year. Measured by market cap Microsoft is one of the largest companies on the NASDAQ.

Mind The $GNRC GapHistory doesn't repeat but it sure does rhyme.
Genrac has almost an exact same Gap up dating back to 11/2/2021 on earnings.
2022 for sure won't be 2021 but I wanted to point out the stock market was a weird place.
I've never published or even read a published piece.
Yay. First

Sorry Chico . . You don't mind if I call you Chico?You'll find more gaps on this thing than in the waiting room of a free dental clinic in Appalachia, sorry Bitcoiners . . is it alright if I call you guys Bitcoiners?
Okay okay, I'm running on zero sleep and a bit punchy, no hard feelings, just letting you guys know what's on deck with this modified Cup & Spatula slash Atomic Bungee Wedgie Pattern.
Not investment advice, DYOR, blah blah, ya ya si si . .

BTC1! BTC CME dramatic moves at handAt the cusp of violent volatility. Price Action broke out of an ascending triangle previously discussed. The measured move of this ascending triangle is 77.4k.
However a rising wedge has been painted. If price action break up from this rising wedge this will result in a blow off top reaching 110k.
Otherwise, if price respects the rising wedge then it will be a start of a sustained trend down to close the cme gaps like in March 2020.

BTC CME gapsNow whole youtube fraternity is shouting CME gap is filled we are bullish but wait..!!!
Who will tell that there are 3 other gaps ranging from 26,500 to 18,500
Please tell the truth not the lies.....

$TMLast week we saw pretty nice spike in $TM with the announcement of the shares buyback. I bet against it even though i had it targeted to reach $206, but with all the uncertainty in the market I thought it wouldn't make it. As it hit the peak of $213 we can see it formed a head and shoulders pattern which brought us back down into the 2nd gap of the original breakout. Now we have a mini inverse head and shoulders that should only push the stock around $210 being as though it is on a smaller time frame and a short downtrend it won't have any real effect. My target for this week is $209-$206 maybe $205 for the lowest. I do see this continuing to go down into next week through into the 1st gap and back to retest the original breakout around $199/$200 area.
NYSE:TM

The gapsI forget this one the last !
The majority of the holes are filled.
So why not these ?
Gogo !
Bearish signal for MSFTA H&S pattern combined with a possible Island reversal may make it very possible for a even greater fall farther.

AMC CME Gap's + Price Target of 51.55-51.69When it comes to CME's, common talk is price will re-trace to the gap at one point in time ( Can be sooner or later ). On this chart you'll see the various CME's in AMC but the most significant ones relative to recent price action are 2 CME's
51.55 - 51.69 (#2) 14 Cent Gap
&
38.88 - 38.14 (#1) 74 Cent Gap (Empty box near MA's)
Market open Monday should retrace us to the previous gap mentioned as #1
These CME's are based on Daily t.f. Charts and a couple including the ones mentioned above were fine tuned on 1 hour for accuracy more importantly the 2 above are significant due tp their resistance at these points. This chart is only showing CME's and will continue to track them on a weekly basis here.
Food for thought on options traders,
The squeeze is more likely to happen if you buy the stock and hold rather than trading the option. Put or Call. Doesn't matter
We need a SOLID floor.
Happy Trading everyone and remember,
Scared money don't make no money!

BTC1 - CME - Bitcoin - GapsThere is currently a small gap from weekend.
Normally close in next hours

Trading plan: T-MobileThis thing gapped up one year ago, finally comes back down 190 bars (1D) later for a pullback.
Chart Setup:
- Timeframe: Daily
- Backtested using this strategy to scan for reversals (could be false, but decent win-rates to convince that it could be sometimes be true)
- Using price gaps to identify trends, then using volume profile - fixed range (VPFR). to map out areas of support/resistance
Observations:
-137-150 range was fake, not enough volume to support it, POC (red line) remained at 130 throughout the VPFR period
- couldn't break out of 130 on Sept 22
- drew another VPFR, this time from Q1 of FY2020 extending up to today, noticed that 103-115 is an area of value, good supports here.
- 12 month targets average out 170, a whopping 30% difference below target (much lower than Verizon's current price relative to its own average target)
Bias: Long.
Disclaimer: not an investment advice

Exide Industries-Gap Filled This stock gave a gap up opening few weeks back and it has been filled and this area acts as a support .Expecting 200+ target.
P.s: This is just for educational purpose

NiftyGap Theory
Breakaway - Start of a trend
Runaway - Confirmation and strengthening of a trend
Exhaustion - A gap which gets covered it, in that case the pending gaps become support levels

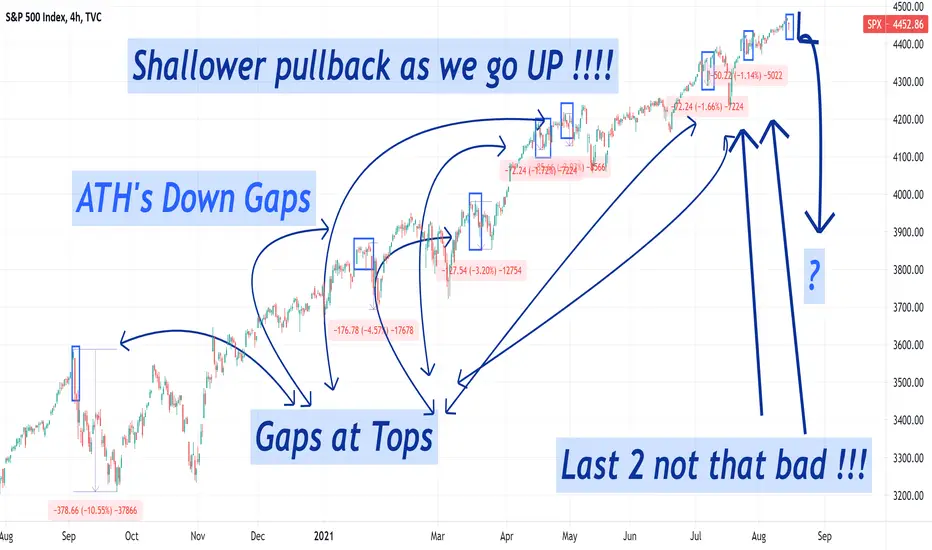
SPX's ATH gaps, recently not that bad !!!Shallower pullback as we go UP !!!!
101 Tech analysis, Gap analysis, trend analysis...!!!!