$OLLI Set To Keep Climbing$OLLI had a big day yesterday, rising 15% on the back of strong Q3 numbers. $OLLI still has room to run as it is still down 32% off its 52-week highs. Here are the highlights from Q3:
Ollie's Bargain Outlet Holdings (NASDAQ:OLLI) is higher after comparable sales fall by 1.4% in Q3 to miss the consensus estimate for a 1.1% drop, but the company's top line and bottom line both came in ahead of expectations.
The company says margins improved slightly in the quarter as an increase in merchandise margin, partially offset by higher supply chain costs as a percentage of net sales
The retailer expects FY20 revenue of $1.419B to $1.43B vs. $1.43B and FY20 $1.95 to $2.00 vs. $1.99 consensus.
Ollie's also disclosed the hiring of John Swygert as CEO following the death of Mark Butler.
The day's high of $70.99 is the key number to watch. We must get above there for the all-clear to be in.
As always, use protective stops and trade with caution.
Good luck to all!
Gapup
COTY - Exiting Oversold ConditionThe stock gapped up on October 21st & created a bull flag pattern. It broke out of this flag pattern on November 6th on an earnings announcement. The former resistance line of the flag pattern looks to have become support as the stock price is trying to move back up from this level.
Price target levels are noted on the chart.
ZS - Scaling InZS had a gap up due to earnings back on March 1st. The stock saw a rise in price within a bullish price channel but was creating a bearish divergence with the RSI indicator. Even with the pullback, the price remained in the bullish channel until it broke down in mid-August.
Another earnings report in September led to a gap down that created an Island Reversal pattern & carried the stock price below the March gap, which was now acting as resistance.
The stock price continued falling as it tested that March gap resistance a few times but as the price fell the RSI has moved higher creating a Bullish Divergence.
With the price moving out of an oversold condition I am looking for the price to move up to re-test the September gap resistance. Depending on bullish momentum the stock may be able to continue rising to fill the September gap.
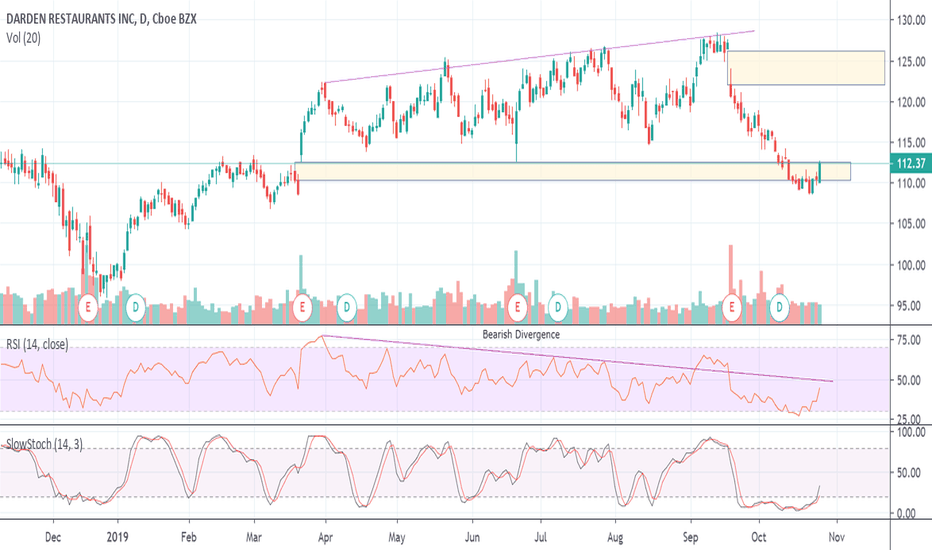
DRI - Let's Go Out For A BiteDRI had a gap up on an earnings announcement back on March 21st. The top of this gap became support while the stock price continued to rise. This rise in price created a bearish divergence with the RSI indicator.
The earnings release in September led to a gap down. The price actually consolidated just below the March gap. Friday's trading has the price testing the resistance level of the March gap zone with the stock finding strength.
DRI is finding relative strength within the Restaurant industry but still needs some more time to see if it is gaining strength on the SPX. If the price continues to rise I would expect a re-test of the bottom of the gap down zone around $122.
Looking for a shortWSP had a massive run up yesterday, gaining over 10%. I love seeing when a stock is overextended it just gives me more reason to short it, the mean of WSP is -0.19% so there more negative days than positive. Based on the data its a normal standard deviation of 68%, therefore im looking to trade between $2.19 and $1.78, lets see how it reacts between $2.060 and $1.92.
VERY GOOD DAY! Positive trade talk news. DOW rally higher??Always remember that I am NOT making recommendations to buy or sell ANYTHING investment related. You must do your own research.
YouTube: Dumb Money Trader
twitter.com/dumbmoneytrader
facebook.com/dumbmoneytrader (I do not restrict posts like most Facebook groups do)
www.dumbmoneytrader.com
WELL t.a. & set up 9.17.19WELL WELL WELL Showing signs of a a continuous uptrend pattern overall and currently trading above the 200sma on the daily chart. Price history shows SMA50 is known to act as a major support when there is a pull back during an uptrend. Potential long position available. Price gapped up today showing signs of strong momentum and intraday price has now broken above multiple key moving averages the EMA21 and EMA10. Might be a good idea to monitor until close to avoid getting stopped out because of intraday noise. Potential entry would be if price closes today above the ema21 and ema10 moving averages.
Target entry: 88.70 area
Target exit: 92 area @ +4%
Stop: 87.89 -1% (if price closes below ema21 & ema10)
Risk/Reward ratio optimal @ 4:1
Interesting divergence SPY/XLYI was messing around with my charts and noticed that SPY and XLY (Consumer Discretionary) are diverging. Looking back in time - with the exception of one littler divergence a couple years ago - I can't find anywhere else this has happened. Is this maybe a sign that the consumer is getting overly confident? When fear is turned off, things eventually get out of control.
The other thing I noticed is that XLP (Consumer Staples) is gapping away from SPY and XLY to the upside. Guess when the last time XLP gapped away from SPY and XLY?? Yep, you guessed it! It was last year right before the market tanked. This would also (maybe) be a sign that consumers are getting overly confident.
HKEX:596 Potential profit 24%HKEX:596 the latest trade day it gap up and opens at 3.88, which is a resistance of previous top. It also break the fractal with high volume, which is a good signal that the break is valid. This fractal is also the neck line of the double bottom. As a result, we first see the reaction of the market when it reach the target, which is the resistance area. If it can be broken, it is very likely that it will reach the previous top again!
Cut loss @3.57
Target @5
Buy in @current price 4.01
My thought about current BTC market.The small gap at 9865 got filled, the next target can be the big bearish gap at 11599. The price can make a wick to top of channel. I have my own sell order at 11700 (maybe I lower it under 11600).
Then price will go down to fill in the gap at 8488 in middle of Aug.
In 2H time frame RVGI turning upward.
This is just my thought. Don’t trade based on it.
TEVA - Gap Up / Inverse Head and Shoulders and OversoldThis stock has been beat down with opioid lawsuits. It got a bump from Oppenheimer giving it a $12 target. I am going for $10.50 target.
I have opened a Bull Spread on this stock.
Trades to open position No. Price Total
buy 20th Sep $8.00 Call 15x100 $1.80 $-2700.00
sell 20th Sep $13.00 Call 15x100 $0.21 $315.00
Total $-2385.00


