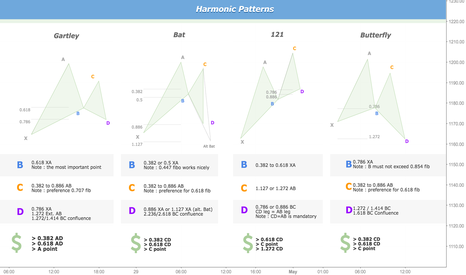
Gartely
Bullish Gartley and a monthly MA line in focus Last week Oil price broke below a daily uptrend line and crashed all the way down to hit the monthly 18 SMA line (Monthly Fast MA line).
In addition to the monthly support line Oil also completed a bullish Gartley.
The Gartley and the monthly line will be in focus in the coming weeks as Oil will become more volatile as we approach OPEC's meeting.
Potential upside - Oil can climb and test 48-50$ as resistance
Thoughts?
#WeeklyMarketsAnalysis on Twitter
USD/CAD Trend Continuation Trade + Potential Gartely CompletionPrice finally broke through the flat top triangle on the Daily time frame, right now we are having what looks like a pullback to test previous resistance level. upon zooming into the 1 hr time frame, there is a potential gartely advanced Patten that can be used as an entry technique. There is also fib ratio confluence, AB=CD Harmonics, major market structure and a demand zone on my trading time frame.
Eurusd Potential Harmonic Pattern LONG + SHORT Bearish Gartley 1H
also we can take the advantages at other points for long entry:
as FIBO + RSI Momentum +fundamental analysis
Pattern confirms / suggests a short entry upon completion of the pattern
when the point D is confirmed 4 short order..!!!!!
Let's see and good luck
Harmonic Patterns ratio and examplesHi,
Above, some harmonic patterns that i often look for (bullish ones)
These patterns, when identified, have a good risk/reward ratio. They allow traders to enter into the market with minimal risk. Obviously, you need some other confirmations before taking the trade on the pattern completion.
If the point D occurs with some divergence on classic oscillators (RSI / Macd, Sto), on a bottom (or top, if pattern is bearish) of a trendline / channel, previous support/resistance levels, supply/demand zone...then there are good probabilities to see price react on the completion of the pattern.
There are plenty of patterns, but this selection, from my side, is a good start for those who want to learn harmonic pattern.
Below some examples that have worked nicely (this don't work each time, this would be too easy ;)
HKDEUR descending triangleA nice descending triangle with 7 touch points. My backtesting has shown me that often the oscillations get closer as the triangle gets closer to its apex, and we see here that this behaviour is very strong.
The key here will be the open of next weeks trading, where we will see whether it will break above the descending line and ruin the triangle or if the market will start in a downtrend and move towards the support line.
If there is another move towards the support line I expect a break and will go short. (I am currently testing profit-taking at previous structural forms.)
TRYGBP bearish Gartely supported by long term resistanceCD leg with a 1:1 ratio with the XA leg falls into the blue region shown on the graph (which is also a confluence of the 0.786 retracement and 1.272 extension, so will look for this as an entry point .
Stop loss is based on previous structure support as shown by the horizontal red line.
Not only is this a nice Gartely, but we also have the entrance point on the line of long term resistance , as shown by the black line (zoom out to see more). For this reason, we may see a much larger drop than the initial price targets.
RSI is nearing an overbought state.
Buy MXNGBP Gartely - great Risk/Reward and good fundamentalsTechnicals
We have a Gartely pattern set up here. I am looking to go long at 0.03697, which falls between the 0.786 retracement and 1.272 extension along with 1:1 ratio between the AB and CD legs.
There is also a divergence on the Relative Strength Index from a heavily oversold condition, supporting a spike from around the current price.
Fundamentals
Slumping oil prices damage the prospect for investment in Mexico’s energy industry, while slowing growth in the US is hurting Mexico more, since the US is Mexico's main export market. However, Mexico has the best economic fundamentals in the emerging market, and is heavily undervalued right now, suggesting either a continued consolidation around the current low, or a rebound from this low. Fundamentally, this is a risky trade and could overshoot into the stop loss, but it could also be potentially very rewarding.
Profit target
I have set an initial profit target based on Fibonacci levels. I expect the second target to be met, and based on the fundamentals above and how they evolve in the coming weeks I will either move the stop loss up to the first profit target if the second is met, or I will close the trade there.
Possible start to oils rise? (Triangle break into bullish Gart.)There are a number of ways this trade could play out:
1. Triangle and long-term resistance breaks at touch point 7 of the symmetrical triangle. Would place an initial profit target at $34.80 and then at $38, and if this target was reached I would consider holding this position for a prolonged period of time.
2. Triangle breaks at touch point 6 to move into a Gartely formation. Short at the break, buy at $28.50. Profit target for the Gartely would be at the long-term resistance line. For any signicant move above this long-term resistance, see trade 1.
3. Triangle breaks at point 6, Gartely gets stopped out (this won't matter because the stop loss for the Gartely would be equal to the profit taken from the triangle breaking at point 6, so there will be no net loss of money).
4. Something completely different!
I am looking forward to seeing how this plays out, could potentially be a lot of profit to take from these trades.


