#OFHCreated Gartley Bullish pattern ,
Entry level at 0.492
Stop loss 0.488
First target at 0.500
Second target 0.508
Third target 0.514
note : chart on timeframe 30 minutes
Its not an advice for investing only my vision according to the data on chart
Please consult your account manager before investing
Thanks and good luck
Gartley

Dollar Strength Might Still Have A Ways To GoLong opportunities are getting close but in terms or harmonic reactions, we might have to wait for either of these bulls to fill (Gartley and Cypher)...

#OTIS #OTIS timeframe 1 day
Created a bullish Gartley pattern
Entry level around 93.50
Stop loss 90.00 ( estimated loss -2.56% )
First target at 97.43 ( estimated profit around 4.36% )
Second target 101.00 ( estimated profit around 8.25% )
NOTE : this data according to time frame I day
Its not an advice for investing only my vision according to the data on chart
Please consult your account manager before investing
Thanks and good luck

Init bullish gartley still in tactSpotted this bullish gartley on init. Had good reaction at the D leg. Still intact. As you can see it’s not totally perfect but is very close so should be a powerful harmonic structure.

It was fun while it lastedIf this bearish gartley plays out brace yourself for a crash of epic proportions.

#GIS - Time to make money - 51 is the key ?!waiting price around 51
way ?
activate 2 bullish patterns for targets on the chart
but don't forget (( stop loss )) will be 49.60
Its not an advice for investing only my vision according to the data on chart
Please consult your account manager before investing
Thanks and good luck

#COPR Egyptian stock#COPR time frame 1 DAY
created a bullish Gartley pattern
Entry level at 0.358 to 0.33
Stop loss 0.31 ( loss may go to up 11% )
First target at 0.455 to 0.485 ( with profit around 32% )
Second target 0.544 to 0.656 ( with profit around 55% )
Third target 0.617 ( with profit 70% )
Hight expectation with stop loss more than 11%
the positive thing here is MACD created a positive diversion with low volume at last 3 weeks .
NOTE : this data according to time frame I DAY , it`s may take period up to 3 months to achieve targets , you must study well the Alternative opportunities before invest in this stock .
Its not an advice for investing only my vision according to the data on chart
Please consult your account manager before investing
Thanks and good luck

#ATQA - Egyptian stock#ATQA timeframe 1 hour
Created a bearish Gartley pattern
Sell point around 10.00
Stop loss / reentry 10.20 (estimated loss -1.65%)
First target at 9.60 (estimated profit 4.20%)
Second target 9.25 (estimated profit up to 7.70%)
NOTE: this data according to timeframe 1 hour.
NOTE: stock remains positive for long term.
It's not an advice for investing, only my vision according to the data on chart.
Please consult your account manager before investing.
Thanks and good luck.

Two reasons to sell FTSE Right NOWWe are seeing some reasons to sell FTSE right now.
1) The daily trend is down.
2) H4 is pointing down, but the price is above the MA
3) There are two patterns to sell at the current level
4) 8165 is the last weeks high that will be a good resistance
Hoping for a test of last week's lows.

#LUTS Egyptian stock#LUTS time frame 1 DAY
Created a bearish Gartley pattern
Sell point around 0.74
Stop loss / reentry 0.77 ( estimated loss -4% )
First target at 0.683 ( estimated profit 8% )
Second target 0.628 ( estimated profit up to 15% )
Although all indicators is positive but the prices at sell point according to bearish Gartley pattern ( prices at 0.886 FIP ) , also there is negative diversion on RSI time frame 15m , may tha support or idea
any way if prices closed daily uber 0.77 with volume at least 40 M shares , re bay .
the profit in this case is saving your invest from losses up to 13% .
in case the prices still rises then re entry for targets 2.75 , 2.83 , 2.93 up to 3.11.
NOTE : this data according to time frame 1 DAY
Its not an advice for investing only my vision according to the data on chart
Please consult your account manager before investing
Thanks and good luck

BTCUSD – Bullish Gartley Pattern FormedBTCUSD – Bullish Gartley Pattern Forming
✅ Market Context:
Pattern: Bullish Gartley
Current Trend: Mid-term bearish
Key Bullish Level: $62,000 (Potential PRZ – bullish reversal zone)
Resistance: Long-standing bearish trendline, tested multiple times
Support: Bullish trendline aligning near the Gartley PRZ at $62,000
🧩 Gartley Breakdown:
XA: Strong bullish move
AB: Retraces 61.8% of XA
BC: Retraces 38.2–88.6% of AB
CD: Extends to 78.6% of XA
→ Completion zone at $62,000
📈 Trade Idea – Prepare for LONG Setup
Scenario 1: Price Drops to $62,000
Look for bullish confirmation (candle pattern, divergence)
Ideal entry zone to long from PRZ
Stop-loss: Below Gartley X-point or local low (~$60,500–$61,000)
Scenario 2: Price Consolidates Under Trendline
If it breaks the bearish trendline, prepare for early momentum breakout
Wait for a retest of the breakout and enter
Targets:
TP1: $65,500 (structure)
TP2: $68,000 (Fibonacci 0.618)
TP3: $70,000+
Risk-Reward: Aim for 1:2 or higher
⚠️ What to Watch:
Daily RSI/MACD for divergence confirmation
BTC volume confirmation near $62,000
Macro news: BTC ETF flows, Fed stance on rates, CPI
#EFIH Egyptian stock#EFIH time frame 1 DAY
Created Gartley Bullish pattern ,
Entry level at 18.65 to 18.45
Stop loss 17.45 ( estimated loss - 7.20% )
First target at 20.66 ( estimated profit 10% )
Second target 22.50 ( estimated profit 21% )
Third target 24 ( with profit 28% )
MACD show positive diversion that is may support our idea
NOTE : this data according to time frame I DAY , it`s may take period up to 3 months to achieve targets , you must study well the Alternative opportunities before invest in this stock .
In addition EGX30 is negative.
Its not an advice for investing only my vision according to the data on chart
Please consult your account manager before investing
Thanks and good luck

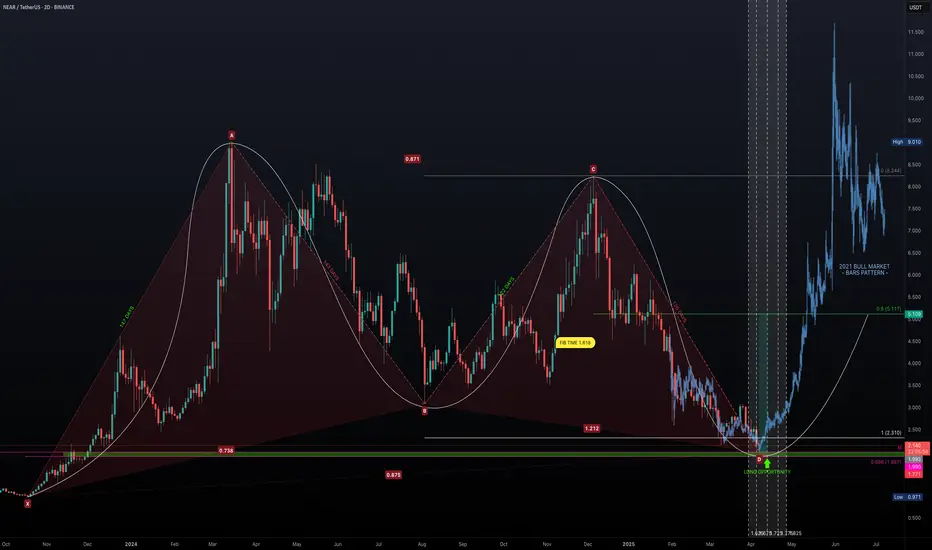
NEAR the Bottom? - The Crash Ends HereBack in October 2023, NEAR embarked on an incredible bull run lasting 147 days, surging from a low of $0.971 to a high of $9.01—an astounding +828% gain. Following this euphoric phase, the market sentiment shifted dramatically. Over the subsequent 392 days, NEAR retraced to around $2, marking a -78% decline. Now, with the market at a critical juncture, the question remains: when does the madness of the crash end, and can we finally see a reversal?
Harmonic Patterns & Fibonacci Confluence
Chart Pattern Analysis: The XABCD Framework
Using the XABCD pattern tool, we identify the following key points:
Point X: $0.971
Point A: $9.01
Point B: $3.076
Point C: $8.244
Point D: $1.978
Durations:
X-A: 147 Days
A-B: 143 Days
B-C: 122 Days
C-D: 126 Days
These durations show remarkable symmetry—with the up-move phases (X-A and A-B) nearly matching in time, and similarly for the correction phases (B-C and C-D). This time symmetry supports the presence of a harmonic structure, and the retracement levels help validate the potential for a reversal.
Fibonacci Implications
Fib Retracement of XA: Point B is at 0.738
Fib Retracement of AB: Point C sits at 0.871
Fib Retracement of BC: Point D lands at 0.875
Fib Extension of BC: Point D is at 1.212
While Point D’s retracement at 0.875 is slightly deeper than the classic 0.786 level expected for a Gartley Harmonic, it remains close enough to validate a harmonic correction, especially considering market noise. Additionally, the expansion of BC at 1.212 is close to the 1.27 range, lending further credence to this being a Gartley-type pattern.
Time Factor: Fibonacci Time Extensions & Exhaustion
147-day Bull Run: NEAR rose from $0.971 to $9.01 in 147 days.
392-day Bearish Correction: Since hitting $9.01, the price has retraced for 392 days.
Fibonacci Time Extensions:
1.618 multiplier: 147 × 1.618 ≈ 238 days. A Classic "golden ratio" reversal target. This period coincided with a +135% surge in November.
2.618 multiplier: 147 × 2.618 ≈ 385 days. High-probability exhaustion point. This is nearly equal to the current 392 days, suggesting that time-based exhaustion may be imminent.
The alignment of these time-based measures with the price retracement (approximately 87.5% retracement of the original move) signals a critical juncture where the bearish phase could soon be over.
Identifying the Support Zone & Long Opportunity
Based on harmonic and Fibonacci analyses, the confluence of key support levels points to a potential bottom:
Harmonic Point D: Trading near $2.
Monthly Level: $1.99 acts as a strong support benchmark.
Fibonacci Retracement (0.886): at $1.887.
These levels create a long opportunity window between $1.99 and $1.887. This confluence offers a solid entry region for long positions.
Additionally, other confluence factors include:
Fibonacci time extension at the 2.618 level (around 385 days) aligning with the current duration of the bearish phase.
The symmetry of the XABCD pattern adds to the reliability of the support structure.
High-Probability Trade Setup
Long Entry:
Entry Zone: Accumulate positions in the $1.99 to $1.887 range.
Target: Aim for the 0.5 Fibonacci retracement level of the bull run, approximately $5.00, which represents a potential +150% gain from current levels.
Risk-to-Reward (R:R): With the setup targeting a substantial rebound, the risk-reward ratio is very attractive, particularly if entry is taken in the defined confluence zone.
Market Outlook:
Current Sentiment: NEAR is in a significant downtrend, evidenced by a dramatic -78% retracement after an explosive bull run.
Reversal Indicators: The harmonic pattern, Fibonacci retracements, and time exhaustion (392 days approaching the 2.618 extension) all point towards a possible bottom formation in the coming month, particularly during April.
Potential Reversal: If NEAR holds within the $1.99 to $1.887 window, a reversal back towards $5.00 appears plausible, echoing the conditions seen at previous market cycle reversals.
Key Takeaways
Historic Run & Severe Correction: NEAR surged over +828% in 147 days only to retrace -78% over the following 392 days.
Harmonic Confluence: The XABCD pattern and Fibonacci levels create a compelling argument for a turnaround.
Time & Price Alignment: Fibonacci time extension around 385 days combined with an 87.5% price retracement suggests market exhaustion.
Solid Long Entry Zone: The support between $1.99 and $1.887 offers an attractive risk entry point with the potential to target a move back up to $5.00.
After decades in the trading arena, one thing is clear—the market often cycles through periods of euphoria and despair before turning a corner. NEAR's confluence of harmonic symmetry, Fibonacci retracement, and time-based exhaustion is almost too aligned to ignore. With a defined long entry window between $1.99 and $1.887, this might be the moment to consider a high-probability long trade. As always, manage your risk diligently and wait for clear confirmation.
Wrapping it up here, happy trading =)
If you found this helpful, leave a like and comment below! Got requests for the next technical analysis? Let me know.
Confluence at 65KBTC seems to be developing a bullish Gartley pattern, currently evolving within a potential bear flag.
The pattern would complete at point D, around $64,600–65,000, where multiple confluences meet:
- 78.6% retracement of XA
- 141.4% extension of BC
- Lower boundary of the flag
- Retest of former resistance trendline
- Saylor’s average entry price 😏
A key condition: we need to break below the current wedge to increase probabilities of reaching point C.
Until then, the pattern remains a setup in progress.
Letting it unfold, one leg at a time.

Is TIA About to Break Down Hard? Traders Beware Before It’s lateYello, Paradisers! Did you catch the recent bullish rally on #TIAUSDT? It’s been delivering solid gains over the past couple of days, giving traders reason to celebrate. But what if we told you that this rally might just be setting up a classic trap—one that smart money is already preparing to take advantage of? The technical structure forming right now suggests a high probability of a reversal, and if you’re not paying attention, you might end up on the wrong side of the move.
💎#TIAUSDT, at the core of setup is a developing a probable Bearish Gartley pattern. These harmonic structures are rare but extremely powerful when they align with multiple technical confirmations and that’s exactly what we’re seeing here. With the recent move upward, TIAUSDT appears to have completed its C leg, a critical part of the Gartley structure. This sets the stage for the D leg, which typically completes much lower. The price reacted strongly from the C leg area, which also happens to line up perfectly with a previous local high adding even more probability to the resistance at that zone.
💎This resistance isn't just horizontal there's a dynamic element at play as well. The 21-period EMA on multiple timeframes is currently acting as a ceiling for price action. When a key moving average starts rejecting price repeatedly, it often signals that the current trend is losing steam and this dynamic resistance only strengthens the case for a downside move from here.
💎Looking deeper, the bearish signs are confirmed by momentum indicators. The RSI on lower timeframes is not only overbought but also showing clear signs of bearish divergence. This divergence occurs when the price continues to make higher highs while RSI starts forming lower highs a classic sign that momentum is weakening. It’s one of the more reliable early warnings that a reversal may be near. In this case, RSI is flashing that warning now, suggesting that buyers may soon run out of fuel.
💎If this bearish probable scenario plays out as expected, the first key level to watch on the downside sits around the 3.278 zone. This minor support may offer a temporary bounce, but if the D leg of the Gartley is to be completed, we could see even deeper price action. This makes the current area extremely sensitive—any weakness from bulls could trigger a fast move downward.
💎However, no pattern is complete without an invalidation level, and for the Bearish Gartley, that comes in around the 3.805 resistance zone. A strong, sustained close above this level would invalidate the bearish setup and signal renewed bullish momentum. Until then, all technical signals are pointing toward caution, especially for those still riding long positions without a tight risk plan.
Stay alert, Paradisers. The market is about to decide. This is a textbook moment where emotions can take over, and late buyers get punished for chasing green candles. That’s why, we are playing it safe right now. If you want to be consistently profitable, you need to be extremely patient and always wait only for the best, highest probability trading opportunities.
MyCryptoParadise
iFeel the success🌴

#EKHOA Egyptian stock - great opportunity - great fundamental.#EKHOA time frame 1 DAY
created 3 Bullish Gartley patterns ( patterns by time frame 1 day and anther one by time frame 1 hour ) , so we can see action price in this point but in anther hand we are in a downtrend targeted 27.00 .
Entry level at 30.10 to 30.30
Stop loss 29.00 ( loss may go to up -3.70% )
First target at 31.95 ( with profit around 6% ) , resistance at 31.20
Second target 33.50 ( with profit around 11% )
Third target 34.50 ( with profit 15% )
NOTE : this data according to time frame I DAY , it`s may take period up to 3 months to achieve targets , you must study well the Alternative opportunities before invest in this stock .
Its not an advice for investing only my vision according to the data on chart
Please consult your account manager before investing
Thanks and good luck

BTC Bearish GarleySummary of Confluences
Trade Setup Long Trade (Buy at C)
Key Confluences
✅ Fibonacci 0.618 - 0.633 Retracement (XA Leg)
✅ Weekly FVG Support
✅ Market Structure Pivot & Liquidity Grab
Short Trade (Sell at D)
✅ Bearish Gartley Completion (1.27 - 1.3 Fib Extension of BC)
✅ Anchored VWAP from ATH (Resistance)
✅ Bearish Order Block & Supply Zone
1. Long Trade Setup (From C to D – Bullish Move within the Gartley)
🔹 Trade Type: Counter-trend long (buy from C to D).
📌 Entry Criteria:
Buy at Point C (~0.633 Fib retracement of XA leg).
Stop Loss: Below A (~1 ATR buffer).
Take Profit Levels:
TP1: B (~0.642 Fib level of XA retracement).
TP2: D (~1.3 Fib extension of BC leg).
🔹 3 Confluences for the Long Trade:
✔ Fibonacci & Harmonic Confluence:
Point C aligns with the 0.618 - 0.633 Fibonacci retracement of XA.
This is a well-known harmonic reversal zone, increasing the probability of a bounce.
✔ Weekly Fair Value Gap (FVG) Support:
Price is filling a weekly FVG, a strong liquidity zone where buyers tend to step in.
Institutions may use this level for long entries.
✔ Market Structure Pivot & Previous Low Rejection:
The chart shows a first weekly lower low in a Market Structure Break (MSB).
Previous liquidity grab suggests a potential bullish reversal from this level.
2. Short Trade Setup (From D – Bearish Reversal at Gartley Completion)
🔹 Trade Type: Trend-following short (sell from D after pattern completion).
📌 Entry Criteria:
Sell at Point D (~1.27 - 1.3 Fib extension of BC leg).
Stop Loss: Above D (~1 ATR buffer).
Take Profit Levels:
TP1: B (~0.642 Fib level of XA retracement).
TP2: C (full pattern retracement).
🔹 3 Confluences for the Short Trade:
✔ Bearish Gartley Completion & Fibonacci Reversal Zone:
The Bearish Gartley pattern completes at D, a major reversal point.
The 1.27 - 1.3 Fib extension of BC historically acts as strong resistance in harmonic patterns.
✔ Anchored VWAP from All-Time High (ATH) as Resistance:
VWAP from ATH is acting as dynamic resistance, confirming institutional selling.
If price rejects off VWAP, this increases the probability of a downtrend continuation.
✔ Bearish Order Block & Supply Zone:
Point D aligns with a key Bearish Order Block (OB) where previous heavy selling occurred.
Historical supply zone suggests potential aggressive selling pressure upon reaching D.

XRP - Bearish Gartley Pattern (Long & Short Positions)Confirmation:
Market Structure: The chart highlights a first weekly lower high and first weekly lower low, reinforcing a bearish trend.
Daily Fair Value Gap (FVG): Could serve as an additional target for the price.
Risk-to-Reward Ratio (RRR): The trade appears to have a favourable RRR, with an optimal entry around D.
1. Long Position (Counter-Trend Trade from C to D)
Trade Setup:
Entry: At point C, around the 0.882 Fibonacci retracement level.
Stop Loss: Below point A, ensuring protection against further downside.
Take Profit:
TP1: 38.2% retracement of the C-D leg.
TP2: 61.8% retracement of the C-D leg.
TP3: Full extension to point D (0.786 - 0.886 Fibonacci level).
Confluences for the Long Position:
✔ Bullish reaction at 0.882 retracement (potential demand zone).
✔ Daily Fair Value Gap (FVG) below adds liquidity, possibly supporting the price.
✔ Favorable risk-to-reward ratio (RRR).
2. Short Position (Bearish Reversal from D)
Trade Setup:
Entry: Around point D (between 0.786 - 0.886 Fibonacci retracement level).
Stop Loss: Above point X (invalidates the bearish Gartley setup).
Take Profit:
TP1: 61.8% retracement of the D-C leg.
TP2: B-point level.
TP3: Full retracement back to A (major structure level).
Confluences for the Short Position:
✔ Bearish Gartley completion at D.
✔ Key Fibonacci confluence at 0.786 - 0.886 retracement.
✔ Market structure suggests a lower high in a downtrend (weekly bearish trend continuation).
Pattern Type: Bearish Gartley
Key Levels:
X to A: Initial impulse move
A to B: Retracement to 61.8% Fibonacci level
B to C: Retraces deeper, around 88.2% Fibonacci level
C to D: Final leg completing at the 78.6% to 88.6% Fibonacci level


Chainlink LongAfter a few months of waiting on the sidelines we are back with a chainlink long after a deep retrace.
Link is showing bullish divergence on the lower timeframes after double bottoming at this crucial support and completing an 886 retracement of an informal Gartley. The support level can be seen across time below.
The only question would be to either wait until the end of the day for this support candle to print or to go in now before confirmation. We will go in with 50% of our ideal position size now and then allocate at the end of the day or tomorrow.

XRP/USDT 4HXRP/USDT 4H Analysis
In this chart, we can see a Bullish Gartley Pattern forming on the 4-hour timeframe. The price is currently testing the D point near the key support zone, which aligns with the potential reversal area. If the price holds this level, we can expect a bullish move towards the 2.30 - 2.50 range.
🔹 Key Levels:
• Support Zone: Around 2.10 - 2.15
• Resistance Targets: 2.30 and 2.50
A potential rejection from the D point could confirm a buying opportunity, with a strong breakout above 2.30 leading to further upside momentum. However, if this support fails, XRP may experience further downside.
What are your thoughts on this setup? Let me know in the comments! #XRP #CryptoAnalysis #TradingView

$BABA HARMONICS Suggest move is over with a possible $95 TargetNot sure if I'm doing this correctly but please do chime in and help out if you can. What this is, is an addition to my previous post about BABA coming back down to EARTH. I'm just adding another chart to reinforce the idea.

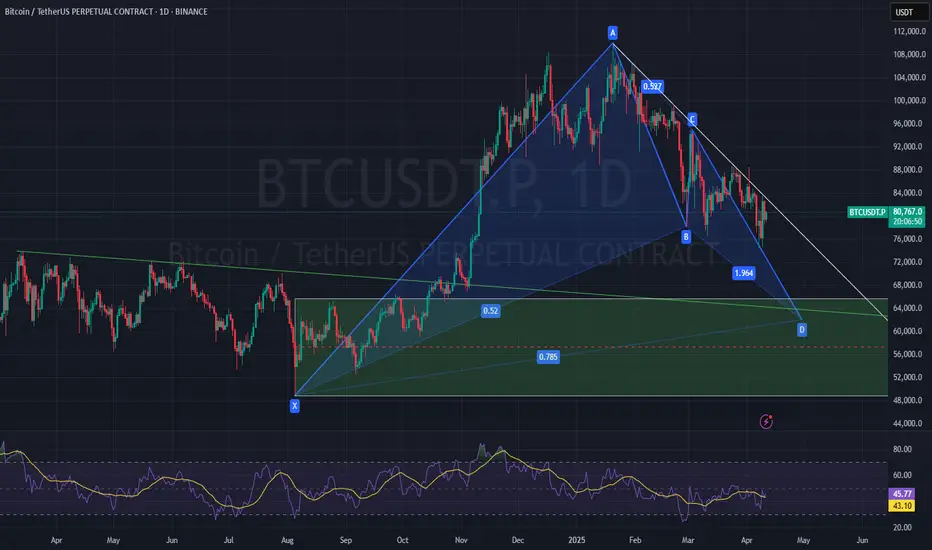
Bitcoin at the D-Point of a Bullish Gartley – What’s Next?Bitcoin ( BINANCE:BTCUSDT ) is currently trading near the Support zone($80,600_$79,000) and Potential Reversal Zone(PRZ) and Support line .
Bitcoin appears to be completing the Bullish Gartley Harmonic Pattern .
Educational Note : The Bullish Gartley is a harmonic pattern that signals a potential reversal in an uptrend after a corrective move. It consists of five points (X-A-B-C-D) and follows specific Fibonacci retracements, with the D-point acting as a key buying zone.
Regarding Elliott wave theory , Bitcoin is completing the microwave B of the main wave Y .
Also, we can see the Regular Divergence(RD+) between Consecutive Valleys .
I expect Bitcoin to rise at least to Cumulative Short Liquidation Leverage . If the Resistance zone($84,130_$81,500) is broken, we can expect further increases in Bitcoin .
Note: If Bitcoin breaks below the Support zone($80,600_$79,000), we can expect further declines.
Please respect each other's ideas and express them politely if you agree or disagree.
Bitcoin Analyze (BTCUSDT), 1-hour time frame.
Be sure to follow the updated ideas.
Do not forget to put a Stop loss for your positions (For every position you want to open).
Please follow your strategy and updates; this is just my Idea, and I will gladly see your ideas in this post.
Please do not forget the ✅' like '✅ button 🙏😊 & Share it with your friends; thanks, and Trade safe.
