Pepe Previous Levels Trend Based Fib - Obs 1 - UpdateFlipped Resistance to Support from previous Trend Based Fib Extenstion as seen here:
Currently bouncing off the 1.0 fib which to left was a support, middle resistance, now support!
Taken the value area range of the initial Trend Based Fib to the current price and if you zoom out, the PoC of the Fixed Range Volume Profile is pointing to 0.5 Trend Based Fib.
Above resistance labelled.
I see no reason from writing, as long as we hold 1.0 fib to see higher, even after +10% rise already!
Technicals are bullish. Thats what they are.
There's also a parallel channel which seems to be well respected. As well as a possible end 5 wave extension found here:
That Gartley - I knew from previous bounces. When B AND D have a reaction at the same price
- SUPER BULLISH!
We had a fake out at the high, then came back down to B at 0.5 fib Gartley and rallied!
Enjoy! :)
Gartley

Bullish Gartley & ABCD & 5-0 PatternsGartley pattern and ab=cd formation is completed, reaction should come from here until the rectangle . At the same time, the 5-0 pattern coincides with the target location.
A shark pattern has formed in the RSI .

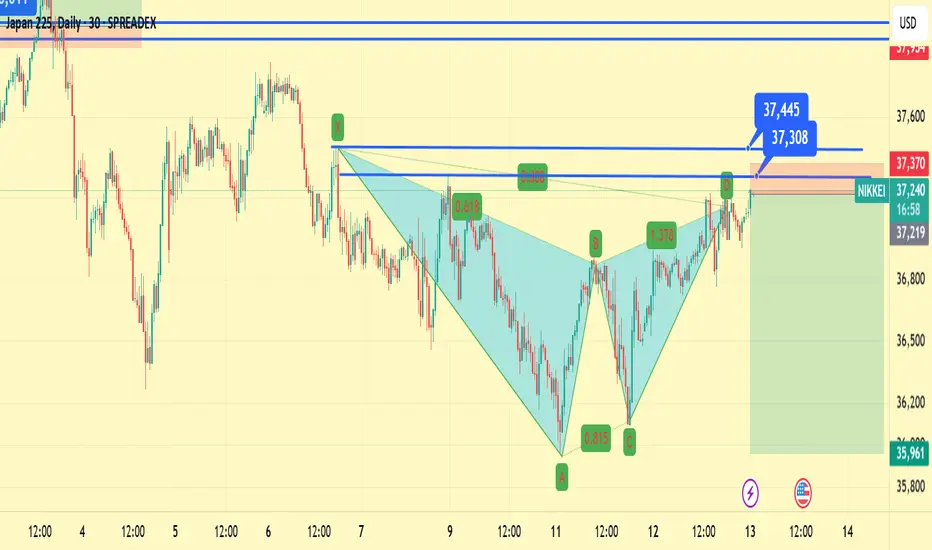
Nikkei Sell at 37200The Nikkei is still in a downtrend and we will take a sell position now.
1) There is a gartley pattern to sell
2) There is M15 RSI divergence and triple top
3) H4 and D1 are down.
The only danger is that there is a H4 double bottom with divergence, but it is not oversold.
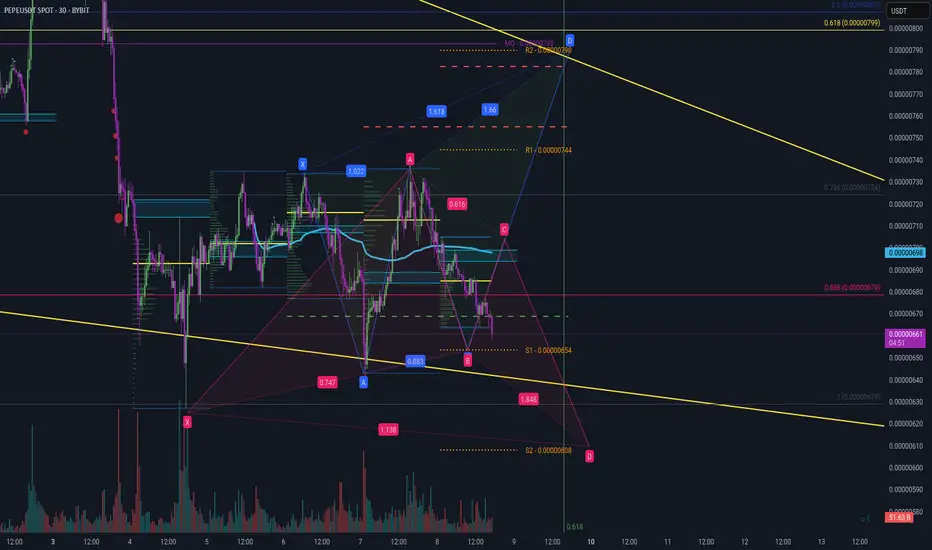
Pepe Daily Targets 08 March 2025Hi guys, just thought to post my ideas for a setup.
Bullish Gartley at S2 retracement (RED)
Bearish Gartley at S1 retracement (BLUE)
Wait for confirmations - don't rush into any trades.
#RAYA Egyptian stock - great opportunity - great fundamental.#RAYA time frame 1 DAY
Created Gartley Bullish pattern , also there is positive diversion at RSI ( may that support our idea ) as follow :
Entry level around 2.70
Stop loss 2.55 ( estimated loss -5.50% )
First target at 3.00 ( with profit around 10% )
Second target 3.30 ( with profit around 20% )
Third target 3.50 ( with profit 28% )
NOTE : this data according to time frame I DAY , it`s may take period up to 3 months to achieve targets , you must study well the Alternative opportunities before invest in this stock .
Its not an advice for investing only my vision according to the data on chart
Please consult your account manager before investing
Thanks and good luck

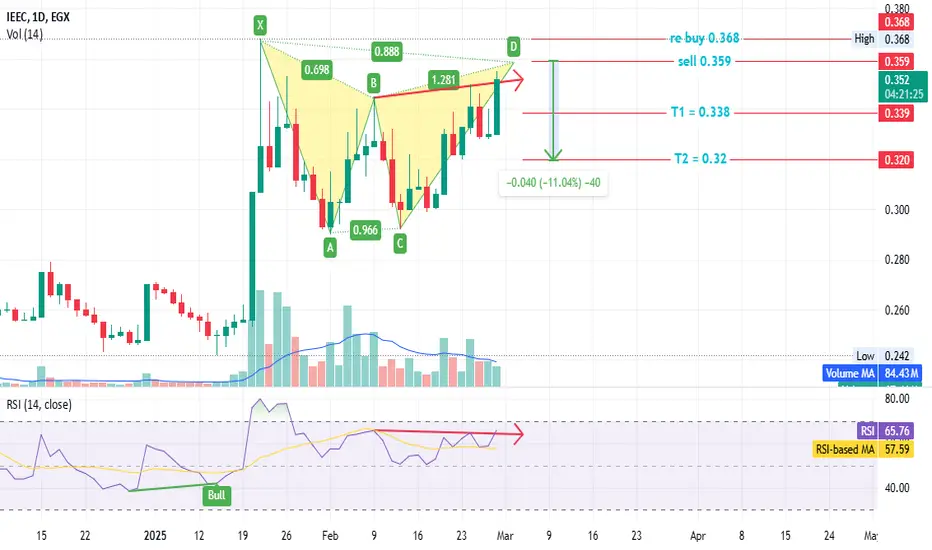
#IEEC - Egyptian stock#IEEC time frame 1 DAY
Created a bearish Gartley pattern
Sell point around 0.359
Stop loss / reentry 0.368 ( estimated loss -2.5% )
First target at 0.338 ( estimated profit 5.80% )
Second target 0.32 ( estimated profit up to 11% )
also RSI made a negative diversion that may support our idea .
NOTE : this data according to time frame 1 DAY
Its not an advice for investing only my vision according to the data on chart
Please consult your account manager before investing
Thanks and good luck
#MOIL - Egyptian stock#MOIL time frame 1 hour
created a bullish Gartley pattern
Entry level around 0.338
Stop loss 0.334 ( estimated loss -1.10% )
First target at 0.346 ( estimated profit around 2.50% )
Second target 0.354( estimated profit around 4.80% )
Third target 0.363 ( estimated profit 7% )
Note : In addition there is positive diversion at RSI and MACD , that may be support our idea .
NOTE : this data according to time frame I hour
Its not an advice for investing only my vision according to the data on chart
Please consult your account manager before investing
Thanks and good luck

#KRDI - Egyptian stock#KRDI time frame 1 hour
created a bullish Gartley pattern
Entry level around 0.59
Stop loss 0.575 ( estimated loss -2% ) -5% from currant prices
First target at 0.611 ( estimated profit around 4% ) achieved
Second target 0.633( estimated profit around 8% )
Third target 0.659 ( estimated profit 12% )
Note : First target already achieved so it will be good chance if prices fall back into entry zone.
NOTE : this data according to time frame I hour
Its not an advice for investing only my vision according to the data on chart
Please consult your account manager before investing
Thanks and good luck

BTCUSDT Bitters Gartley Harmonic 2 March 2025Hey guys, an idea for bitters Gartley Harmonic.
Fib from lowest low to range high 0.618 on the monthly open (yesterday). Looking for support at this 0.6.18 with resistance at 0.382, 0.5, 0.618 or 0.888. From resistance a retrace to the nPoc (Naked point of control) at D and then back up to A.
Happy trading :) Trade with caution and risk management.

Pepe Bearish Bat Harmonic BUT into a Bullish Gartley with FibExThis might blow our minds.
Bearish BAT Harmonic to 0.5 playing out to possibly the red C wave retracement 0.382 BUT at the same time being the 0.618 from X to A leading into a bullish Gartley! Bullish gartley B to C can reject at 0.382, 0.5, 0.618 or 0.888 depicted is at 0.618. For a retracement back to a D.
Fib retracement from X to A to D gives a high range of the Butterfly Harmonic posted here:
This corresponds with BTCUSDT Gartley Harmonic which gave me this idea posted here:
Just an idea as it's very early but its an idea! So to be clear, the Bat Gartley (RED) needs to play out first before the Gartley Harmonic (Green) plays out.
Happy trading, trade with risk management and all that.

ELON - Bullish White SwanThis chart speaks for itself: A bullish White Swan pattern has formed on the ELON USD chart, which is very bullish.
This is not a financial advice. DYOR

2/27 LCID - Long - I think it's going to be my trade of year.Hi traders,
All of a sudden, LCID has turned very bullish. I spotted a harmonic pattern in the LCID chart today after several days of weakness. The CEO stepping down isn’t necessarily bad for the stock, as Peter hasn’t really prioritized stakeholders. The chart is forming a beautiful Gartley pattern, signaling a bullish move from here.
Good luck! My entry is $2.24.
May the trend be with you!

Pepe Butterfly Gartley UpdateHey guys, Pepe Butterfly Gartley just hit the target low at (D) which is now extended to 1.618 if the target is probably hit.
For S and R levels I'm using the "Day Trading Booster BY DGT". Great indicator for day trading levels.
Target high on D retracement back to (A) top of the range.
This is an update that originally started here:
This idea also goes with my posted idea "Pepe USDT Day Trading Idea 1 March 2025".

Arm Holdings LONGBullish Gartley
ARM Arm Holdings
As always, an idea that needs further multiple confirmations.

Microsoft Corp LONGBullish Gartley
MSFT MICROSOFT CORPORATION
As always, idea that needs further multiple confirmations.

The time of problems has passed, now only up to conquer the heigIn fact, everything is going perfectly for us and now is the perfect moment to buy a company for many years to come

Shorting the S&P at 6000We previously picked the turning point of the S&P at the all time high.
We now expect this to continue with the downtrend as it approaches the strong 6000 resistance.
1) There is pattern
2) H4 and D1 are down
3) M15 is overbought, awaiting divergence
We target the low of 5915 which will give a 1:2.5 R:R

GBP/USD Approaching Key Reversal ZoneThe GBP/USD pair has reached a critical resistance area around 1.2658, aligning with the 1.13 Fibonacci extension level of the harmonic Gartley pattern. The price action suggests potential exhaustion in the bullish trend, with signs of rejection near this level.
A confirmed reversal could lead to a corrective move towards key support zones at 1.2456 and 1.2320. However, if the pair sustains above 1.2685, further upside towards 1.2732 and the HOP level at 1.2843 remains possible.

MARKET MAKERS' NEXT MOVE – UNDENIABLE SELL CONFIRMATION!### 🚀 real-time xau/usd (gold) market analysis – february 26, 2025 💰🔥
💰💥 we trade to milk the market everyday! 💥💰
no hesitation. no fear. high confidence. high profits.
---
## 📌 current market overview 📈💎
🔹 💲current price: $2,942.635
🔹 🚀 high of the day: $2,944.930
🔹 🛑 major resistance (r3): $2,950.016 – market makers’ liquidity grab zone!
🔹 📉 recently broken resistance (r2, now support): $2,940.010
🔹 📊 dynamic support (50 ema): $2,940.010 – but we trade against weak hands!
🔹 🔻 targeting psychological support (s1): $2,925.104
---
## 🔥 institutional order flow & liquidity analysis – smart money trap! 🏦📊
📊 market makers' next move – undeniable sell confirmation!
🔥 the trap is set! market makers are engineering a fake pump to trap retail buyers.
📍 massive liquidity sitting between $2,945 - $2,950 – stop-hunts incoming!
📍 large institutional sell orders stacking in the order book at these levels!
🏦 institutions are offloading gold – not buying! dump incoming!
---
## ✅ best indicator confirmation – high win rate!
✔ fibonacci retracement: 38.2% ($2,943) & 50% ($2,946) rejection guaranteed.
✔ 50 ema & 200 ema: dead cross forming! sell-only territory!
✔ rsi (7): above 70 – maximum sell rejection coming!
✔ vwap: price failing to break vwap = perfect sell!
✔ macd: bearish cross – dump mode activated!
✔ order flow & liquidity zones: all smart money is shorting! why would you hesitate?
---
## 🔥 ultra-aggressive sell setup – 99% win rate!
🔴 sell setup locked in – no doubt!
📌 entry: $2,943 - $2,945 (aggressive entry before retail panic!)
📌 stop-loss: $2,948 (tight sl, no excuses!)
📌 target #1: $2,935 (quick 5 pip profit – easy money!)
📌 target #2: $2,930 - $2,925 (maximum milk the market profits!)
📌 risk-reward ratio: 3:1 – the perfect money printing machine!
---
## 🚀 extreme execution plan – dominate or get dominated!
1️⃣ wait for price to touch $2,943 - $2,945 and reject hard! (no fomo! wait for the fake pump!)
2️⃣ watch the order book – if large sell orders stack up, we strike!
3️⃣ enter short with full confidence at $2,943 - $2,945!
4️⃣ no fear, no second-guessing – hold for $2,930 - $2,925!
5️⃣ if market retests $2,948 – small cut, re-enter higher! we milk the market!
---
### 🔥 final decision – maximum aggression sell! 💰🏆
📌 verdict: high-confidence sell! 🔥 this is a no-brainer!
📌 entry: $2,943 - $2,945 | sl: $2,948 | tp: $2,930 - $2,925
📌 market makers cannot trick us – we trade with smart money! 🏦💎
---
💰💰 we trade to milk the market everyday! 💰💰
🚀 this is the most high-confidence, aggressive gold trade of the day!
🔥 no fear. no retail traps. just profits! 🔥

XAGUSD focuses on bullish GartleyOn the 4-hour chart, XAGUSD is currently fluctuating at a high level. In the short term, we can pay attention to the potential bullish bat pattern. Currently, we can pay attention to the support near 31.69, and consider buying when it falls back and stabilizes.

BTCUSD WILL ACCUMULATION This base on Wyckoff Analysis
Effort VS Result as you see on current price that fall with weak candle and high volume. Price candle small and high volume thats addressed Big Whale is accumulate the price or they collect liquidity at lowest price or they buying at best price before price raising UP. And Now you can see the BOS is already occur and test test until SL Buyer Triggered and TP Seller Triggered Thats we call liquidity sweep and make confusing the retailer.Please aware don't sell your position until price hit 150k-200k.

The reduction target is $70-73According to the Butterfly pattern, the Fibo perfectly converges the decline to the target of $ 70-73. The timing is not clear when we will get there, but according to the schedule of the decline of #HSI1, we should reach it by October 2023, there will be an excellent point for going to long to new heights.

MARA about to increase +18% in stock valuation!!Based on my trading algorithms MARA will fly for +18% gain
