Seize Trading Opportunities This Week!For those seeking a counter-trend trading opportunity, CADJPY may present an intriguing prospect. On the weekly chart, a Bearish Shark Pattern checkback is in play. For those desiring a more precise entry, waiting for the Gartley Pattern confirmation on the daily chart could provide a strategic shorting opportunity.
I'm eager to know your trade plans for CADJPY. How do you intend to navigate this setup? Share your insights below!
Gartlypattern
BRITISH POUND VS SOUTH AFRICAN RAND Posting because at the moment, being South African, one of my favourites technically. Given the sad current bad state of affairs with corruption within South Africa, being recently Grey listed, the current almost collapse of Energy (Electricity) with Eskom in almost collapse whereby the country is facing daily energy cuts of up to 6-8 hours a day. How will this Gartley play out? Supposedly a Bearish Garltley. Realistically, looking at a bounce at the 0.5 fib. And noticably the Trend line to the upside has not yet to be broken.
Harmonic Gartlay Pattern for traders can apply on any time frameThe “perfect” Gartley pattern has the following characteristics:
Move AB should be the .618 retracement of move XA.
Move BC should be either .382 or .886 retracement of move AB.
If the retracement of move BC is .382 of move AB, then CD should be 1.272 of move BC. Consequently, if move BC is .886 of move AB, then CD should extend 1.618 of move BC.
Move CD should be .786 retracement of move XA
FTMUSDT - Bullish Gartley Harmonic Retracement from X to A using Fib Retracement, price hit 0.618 at 0.4553 price. Looks like a classic Gartley Harmonic forming. More info on Gartley www.investopedia.com
Will be interesting to see the volume profile as and if price moves to the down side target at D. That being, Volume, Value Area Low, and Point of Control.
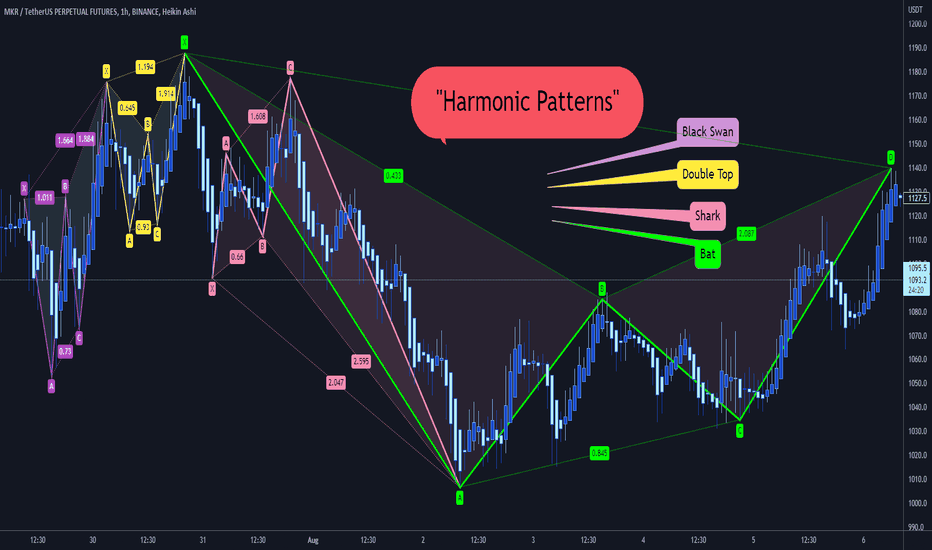
Harmonic PatternsHarmonic Patterns
we have so many kinds of “Harmonic Pattern”:
Black Swan
Bat
Crab
Butterfly
Gartly
White Swan
Shark
Zero_Five
Cypher
Double Top
Double Bottom
📚👌🏻 Each one of them has its unique Fibonacci levels.
⚡️ Do you want to know them?
😍 Happy to see what you find in the charts, please share yours with us
USDCAD W1 Interesting future route Hello traders this is my analysis about USDCAD W1 .This analysis made by Harmonic Elliot and Harmonic pattern
as you see after completion of wave e from 4 ( small price rising in daily time frame ) I expect a sharp down trend as wave a from 5 until determined target that it is PRZ from our assumed Gartly Harmonic pattern too ! I hope this analysis would be helpful for you
EURUSD Price movement prediction 12-10-2020Using the triple trap strategy, these are opportunities I see for this pair. In daily, EU broke the 50 SMA and we can see lower time frames above 50 too, so good opportunity for buys, waiting for retest to the golden zone for buys, we also have another confluence of harmonic pattern that it may retest to golden zone. if it breaks the green zone downside, and retest looking for sells.
the triple trap strategy is trapping price between a channel, SNR and a possible trendline opposite to channel. In this way we can predict the next movement of the price by seeing the price respecting either one of the traps( a channel, SNR and a possible trendline)
EURUSD HARMONIC IN HARMONIC , LAST STRAWHello guys
As we say in last analysis of EURUSD we had harmonic pattern of gartly but after some days we seen that we are making an another gartly pattern in last straw , we are hope to complete this pattern and take some amazing and easy profit from the market
Dont forget stop loss and please use your own Capital management for position
Good Luck
Abtin


