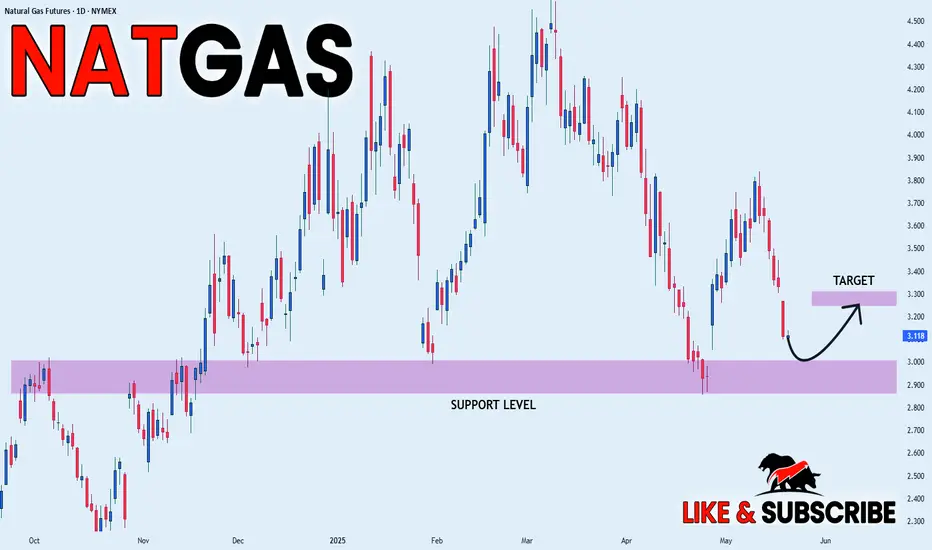
NATGAS Support Ahead! Buy!
Hello,Traders!
NATGAS keeps falling but
A strong horizontal support
Level is ahead at 3.00$ so
After Gas retests the support
We will be expecting a local
Bullish rebound
Buy!
Comment and subscribe to help us grow!
Check out other forecasts below too!
Disclosure: I am part of Trade Nation's Influencer program and receive a monthly fee for using their TradingView charts in my analysis.
GAS

NATGAS REBOUND AHEAD|LONG|
✅NATGAS is going up now
And the price made a bullish
Rebound from the horizontal
Support level around 3.50$
So we are bullish biased and
We will be expecting a
Further bullish move up
LONG🚀
✅Like and subscribe to never miss a new idea!✅
Disclosure: I am part of Trade Nation's Influencer program and receive a monthly fee for using their TradingView charts in my analysis.
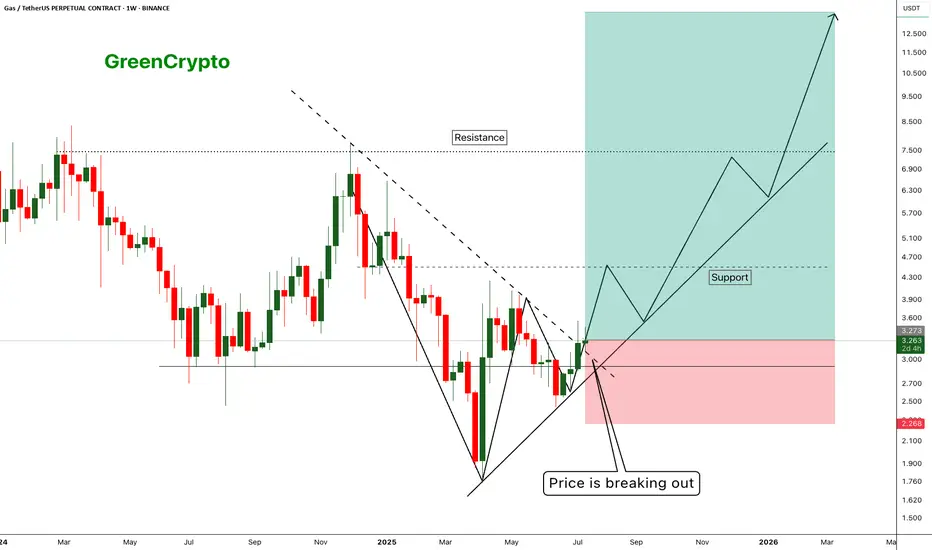
GAS - Huge Risk:Reward Trade 1:10 - Is there any Gas Left ?- Gas has finally managed to breakout from the resistance trendline and now trading just above the resistance
- I'm expecting this trend to continue along the support line shown in the chart.
Entry Price: 3.281
Stop Loss: 2.271
TP1: 3.944
TP2: 4.589
TP3: 6.775
TP4: 8.412
TP5: 13.512
Max Leverage 5x.
Don't forget to keep stoploss.
Support us by Liking and following.
Thanks and Cheers!
GreenCrypto
XNGUSD POSSIBLE LONG OPPORTUNITY
Us natural gas has been falling since June 20th and stopped a decline nearby the 3.3900 level with minor false breakouts of it. Currently we observe the reversal bullish wedge pattern, which is supported by a divergency on rsi on 4-h timeframe. Yesterday natural gas trading session opened with a gap downside, however, later, closer to the American session we observed buying volumes and the asset managed to hold above the 3.3900, which makes it interesting to go long.
If the price breaks above the MA50 at 3.4824, would be nice to set a
🔼buy stop order at 3.5144 with a
💰take profit at 3.8000 and a
❌stop loss at 3.2494, below the trendline.
The risk-reward ratio is 1:1.08.

NATGAS Support Ahead! Buy!
Hello,Traders!
NATGAS keeps falling but
The price will soon hit a
Horizontal support of 2.90$
From where we will be expecting
A local bullish rebound
Buy!
Comment and subscribe to help us grow!
Check out other forecasts below too!
Disclosure: I am part of Trade Nation's Influencer program and receive a monthly fee for using their TradingView charts in my analysis.

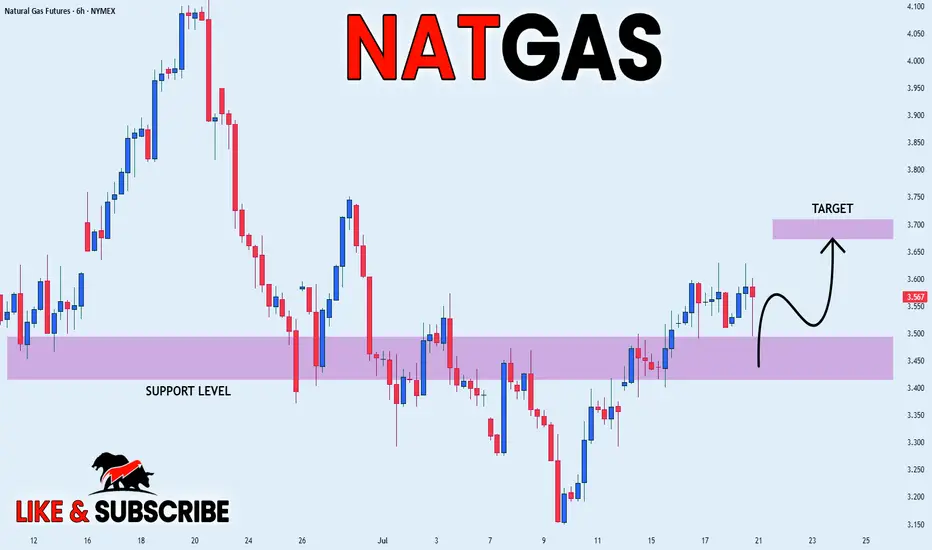
NATGAS SUPPORT AHEAD|LONG|
✅NATGAS is going down now
But a strong support level is ahead at 3.450$
Thus I am expecting a rebound
And a move up towards the target of 3.600$
LONG🚀
✅Like and subscribe to never miss a new idea!✅
Disclosure: I am part of Trade Nation's Influencer program and receive a monthly fee for using their TradingView charts in my analysis.

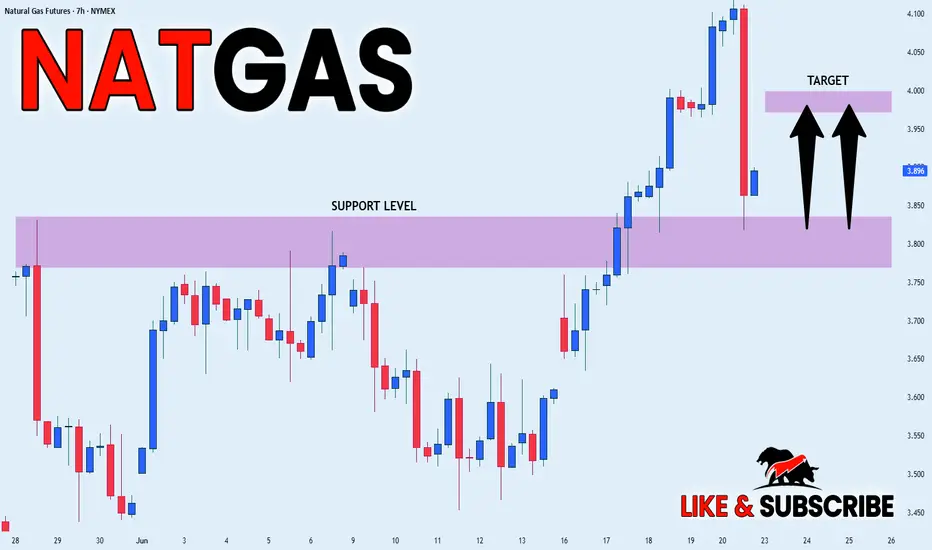
NATGAS REBOUND AHEAD|LONG|
✅NATGAS went down to retest
A horizontal support of 3.820$
Which makes me locally bullish biased
And I think that a move up
From the level is to be expected
Towards the target above at 3.984$
LONG🚀
✅Like and subscribe to never miss a new idea!✅
Disclosure: I am part of Trade Nation's Influencer program and receive a monthly fee for using their TradingView charts in my analysis.
Navigating a Pullback in Natural GasNatural gas prices have been on a wild ride lately, with a recent pullback raising questions about the future of this energy source. This video provides insights into navigating this market volatility, offering actionable strategies for live trading in the midst of uncertainty.
Current weather forecasts for the U.S. show neither extreme heat nor cold—limiting heating or cooling demand. This typical spring-to-summer lull supports low prices .
Although rig counts in the U.S. are falling—the latest count shows an 8‑week decline—production remains ample. Storage levels remain healthy, and oversupply worries persist .
Natural gas rallied earlier today but faced resistance at the $4/mmBtu mark—a major psychological barrier. After hitting that ceiling, prices gave back gains, a typical sign of "rally exhaustion"

NATGAS STRONG RESISTANCE AHEAD|SHORT|
✅NATGAS has been growing recently
And Gas seems locally overbought
So as the pair is approaching
A horizontal resistance of 4.256$
Price decline is to be expected
SHORT🔥
✅Like and subscribe to never miss a new idea!✅
Disclosure: I am part of Trade Nation's Influencer program and receive a monthly fee for using their TradingView charts in my analysis.
Strait of Hormuz risk priced in—or not yet?Iran has repeatedly threatened to block the Strait of Hormuz during periods of heightened tension with the U.S., notably in 2011, 2018, and 2020. The Strait is considered the world’s most critical oil chokepoint, with nearly 20 million barrels passing through daily.
Several banks warn that a full closure could push crude prices above $120–$150 per barrel, or higher if the disruption is prolonged. Still, most analysts view a complete shutdown as unlikely, since Iran also depends on the Strait to export its own oil.
Technically, recent WTI candles suggest that the risk premium may be fading. Price action near $74 shows hesitation, raising the risk of a developing double top—particularly if support at $70 fails. Unless tensions escalate materially, such as the U.S. becoming more directly involved, WTI may consolidate between $70–$74.

NGAS - UniverseMetta - Signal#NGAS - UniverseMetta - Signal
D1 - Formation of the 3rd wave in continuation of the uptrend + price upper border of the triangle. It is better not to increase risks. Stop behind the minimum of wave D.
Entry: 3.8428
TP: 4.0289 - 4.4307 - 4.7987 - 5.4246
Stop: 3.4453

MGY: Technical Breakout + Fundamental Momentum = Quiet Winner?Magnolia Oil & Gas (MGY) is showing one of the cleanest technical breakouts in the energy sector — and the market hasn’t priced it in yet. After months of pressure, price has broken above both the 50-day and 200-day moving averages with rising volume, signaling a clear phase shift from distribution to accumulation. Recent candles confirm control shifting to the buyers, with a tight structure, rising lows, and bullish momentum building underneath resistance.
The fundamentals back the technical setup. In the latest earnings report, MGY delivered a 9.7% revenue increase, $110M in free cash flow, and continues to pay dividends with low leverage. UBS upgraded the stock with a $29 target, which aligns precisely with the post-breakout projection. Operationally, the company is expanding in key U.S. basins like Eagle Ford, while seeing growing demand from Australia and Latin America.
With oil prices pushing higher and geopolitical tensions rising, MGY stands out as a stable energy play in a volatile world. Holding above the $24.00–$24.30 zone keeps the breakout valid, with $29+ as a natural magnet for price. Most investors are still asleep on this name — but the structure is already telling a very different story.

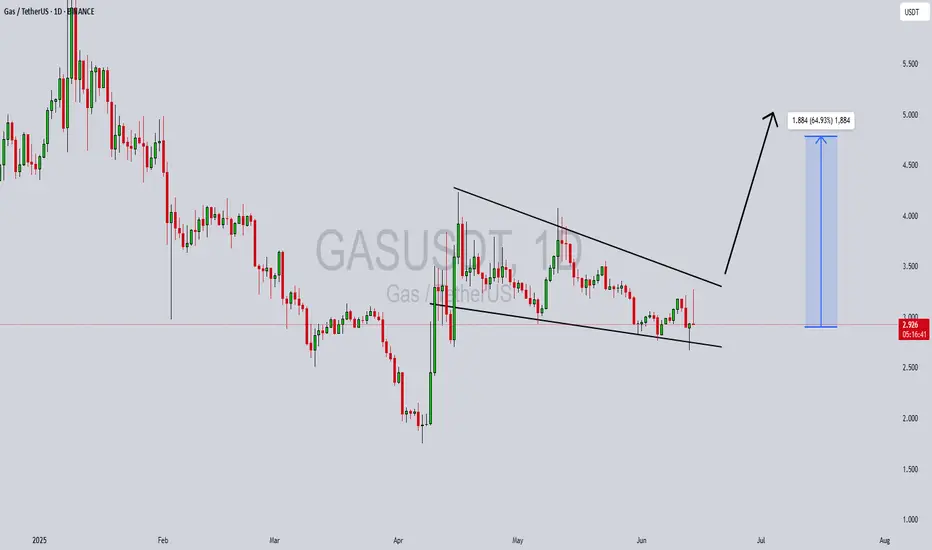
GASUSDT Forming Strong Bullish ReversalGASUSDT is currently presenting a classic falling wedge pattern, a historically strong bullish reversal signal in technical analysis. This structure often precedes significant upward breakouts, especially when accompanied by increasing volume — which we’re seeing here. The price action suggests accumulation is underway, and with investor sentiment turning optimistic, a move to the upside appears increasingly likely. The expected gain ranges from 10% to 50%, with solid risk-reward potential for swing traders and mid-term holders.
Volume analysis confirms a healthy increase in interest, which often precedes momentum-driven rallies in crypto pairs like GASUSDT. The falling wedge has formed after a sustained downtrend, and now with a breakout on the horizon, the bullish case is further supported. GAS, the utility token for the NEO blockchain, remains a key asset in smart contract execution, and renewed activity on the NEO network could add fundamental strength to this technical setup.
From a macro perspective, GASUSDT is gaining traction as investors look to capitalize on undervalued altcoins with real utility and strong development backing. The project’s underlying use case — fueling transactions and resources on the NEO blockchain — continues to hold relevance in the broader smart contract ecosystem. As blockchain infrastructure plays come back into focus, GAS may benefit from both a technical breakout and a fundamental narrative shift.
In summary, GASUSDT is aligning both technically and fundamentally for a bullish phase. The falling wedge breakout potential, rising volume, and ecosystem utility create a compelling opportunity for investors looking to gain exposure to a medium-cap crypto with solid upside potential.
✅ Show your support by hitting the like button and
✅ Leaving a comment below! (What is You opinion about this Coin)
Your feedback and engagement keep me inspired to share more insightful market analysis with you!
NATGAS Short From Resistance! Sell!
Hello,Traders!
NATGAS went up sharply
But the price will soon hit
A wide horizontal resistance
Of 3.809$ from where we will
Be expecting a pullback and
A local move down
Sell!
Comment and subscribe to help us grow!
Check out other forecasts below too!
Disclosure: I am part of Trade Nation's Influencer program and receive a monthly fee for using their TradingView charts in my analysis.

NATGAS LOCAL SHORT|
✅NATGAS has retested a key resistance level of 3.50$
And as the pair is already making a bearish pullback
A move down to retest the demand level below at 3.30$ is likely
SHORT🔥
✅Like and subscribe to never miss a new idea!✅
Disclosure: I am part of Trade Nation's Influencer program and receive a monthly fee for using their TradingView charts in my analysis.

NATGAS SWING LONG|
✅NATGAS is set to retest a
Strong support level below at 2.90$
After trading in a local downtrend from some time
Which makes a bullish rebound a likely scenario
With the target being a local resistance above at 3.26$
LONG🚀
✅Like and subscribe to never miss a new idea!✅
Disclosure: I am part of Trade Nation's Influencer program and receive a monthly fee for using their TradingView charts in my analysis.
GASUSDT 1D Analysis GAS ~ 1D Analysis
#GAS Buy gradually after successfully breaking through this resistance line with a short-term target of at least 10%+.

#GAS/USDT#GAS
The price is moving within a descending channel on the 1-hour frame, adhering well to it, and is heading towards a strong breakout and retest.
We are experiencing a rebound from the lower boundary of the descending channel, which is support at 3.55.
We are experiencing a downtrend on the RSI indicator that is about to break and retest, supporting the upward trend.
We are looking for stability above the 100 Moving Average.
Entry price: 3.58
First target: 3.74
Second target: 3.83
Third target: 3.96

NATGAS SWING SHORT|
✅NATGAS has been growing recently
And Gas seems locally overbought
So as the pair is approaching a
Horizontal resistance of 3.80$
Price decline is to be expected
SHORT🔥
✅Like and subscribe to never miss a new idea!✅
Disclosure: I am part of Trade Nation's Influencer program and receive a monthly fee for using their TradingView charts in my analysis.

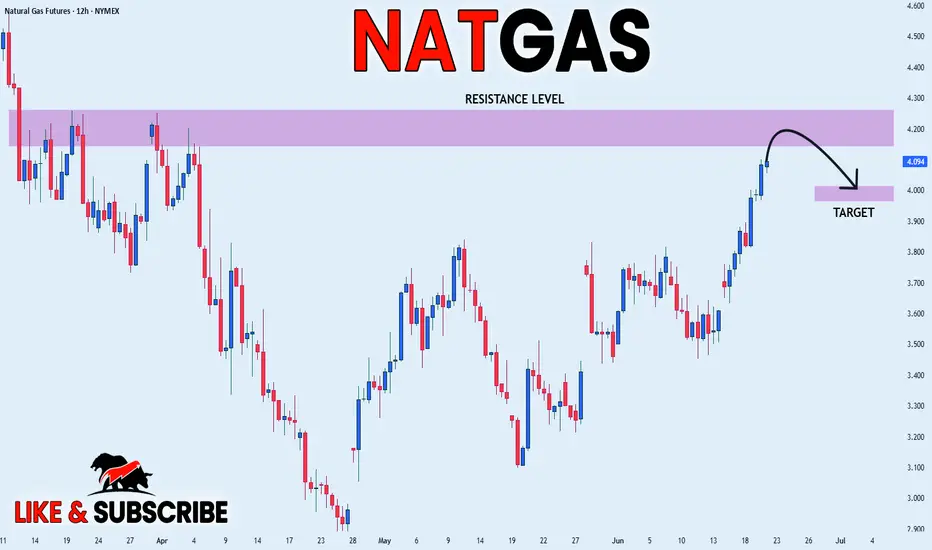
NATGAS Resistance Ahead! Sell!
Hello,Traders!
NATGAS is growing sharply
But the price is nearing a
Strong horizontal resistance
Around 3.80$ so after the
Retest on Monday we will be
Expecting a local bearish
Correction as Gas is already
Locally overbought
Sell!
Comment and subscribe to help us grow!
Check out other forecasts below too!
Disclosure: I am part of Trade Nation's Influencer program and receive a monthly fee for using their TradingView charts in my analysis.

Potential Decline of Natural Gas Prices to $2.43–$2.74Brief Overview of Events and News Explaining the Potential Decline of Natural Gas Prices to $2.43–$2.74.
➖ Weather Forecast and Reduced Demand
On April 23, 2025, the U.S. National Weather Service forecasted milder-than-average weather across the U.S. for late spring and early summer 2025, particularly in key gas-consuming regions like the Northeast and Midwest.
Warmer weather reduces the demand for heating, a primary driver of natural gas consumption. This led to a 2.5% decline in Henry Hub natural gas futures, settling at $3.05 per MMBtu on April 24, 2025.
Source: Reuters
➖ High U.S. Natural Gas Inventories
The U.S. Energy Information Administration (EIA) reported on April 17, 2025, that natural gas inventories increased by 75 billion cubic feet (Bcf) for the week ending April 11, 2025, significantly exceeding the five-year average build of 50 Bcf. Total U.S. inventories are now 20% above the five-year average, indicating an oversupply that pressures prices downward.
Source: EIA, "Weekly Natural Gas Storage Report," April 17, 2025
➖ Weak Global LNG Demand
On April 22, 2025, Bloomberg reported a decline in demand for liquefied natural gas (LNG) in Asia, particularly in China, due to an economic slowdown and a shift to cheaper coal alternatives. China’s LNG imports in Q1 2025 dropped 10% year-over-year, reducing export opportunities for U.S. gas producers and adding pressure on domestic prices.
Source: Bloomberg, "China’s LNG Imports Fall as Coal Use Rises," April 22, 2025
Technical Analysis
Natural gas futures (NYMEX) are currently around $3.15 per MMBtu as of April 28, 2025, following a recent decline from a peak of approximately $4.90 in 2025.
Fibonacci retracement levels indicate correction targets at 38.2% ($2.74) and 50% ($2.43).
Fundamental factors, such as oversupply and reduced demand, support a bearish scenario that could drive prices to these levels in the near term.
Nearest Entry Point Target:
• $2.74
Growth Potential:
Long-term:
• $10
Screenshot:

Very likely x's on alpacaAlong with the pda and vin, alpaca may show good growth in the upcoming bullish cycle. This month, the token was not included in the delisting announcement, and an active set of positions began because it is in an extremely oversold position. Previously, many signals were left with attempts to return to 0.15, and this month there is a possibility of working out this goal under an optimistic scenario. At the moment, the main goal is an attempt to consolidate above 0.075, from where an increase in volatility is likely. When a new week or the second half of the month opens above the level, the reaction will not take long. I would like to draw your attention to the fact that, unlike vib and pda, this token has already changed the trend on the daily chart, which can lead to fairly stable growth.

NeoGas: The Altcoins Market Bull Market Is Here Pt.2The dynamics here are the same as with STRAXUSDT. A very strong bullish bias is developing. NeoGas is growing and has grown by 142% since 7-April. The bottom is in, this means that only higher prices are possible now and long-term. This is the meaning of the bottom, it cannot go any lower.
The pattern that came up as the bottom is the classic rounded bottom, it is very easy to spot on the chart. After the bottom was established, the action quickly followed to move above long-term support, which is above the July and August 2024 lows.
Trading volume is high. Signals are bullish all across. This is only the start.
The bottom is set and a bullish breakout takes place. This bullish breakout leads to the development of an uptrend. This uptrend can least 3 months just as it can last 6 months, 12 months, 18 months or more. It can for years for all we know.
Once the bottom is in... Leave a comment and follow.
The only place left to go now is up!
» The Altcoins market Bull Market is here, it is still early though. These pairs have the potential to grow by 1,000% or more.
Namaste.
