Energy Natural gas idea (25/08/2022)Natural gas during the day. The correction in wave (2) may be over, as the rise in the third wave has already started, and it may target a new above 9.78, But this height depends on trading remaining above the bottom of 5.325 as well, if trading remains above the bottom of 7.525, we may witness an increase in prices.
Our current expectation is to continue the correction before completing the rise agen
GAS

Energy Natural Gas idea (23/08/2022)Natural gas during the day. The correction in wave (2) may be over, as the rise in the third wave has already started, and it may target a new high above 9.78, but this rise depends on trading remaining above the bottom of 5.325. Also, if trading remains above the bottom of 7.525, we may witness an increase in prices.

LONG CRUDE - Trading with COT dataCOT Data is pointing to Crude Oil ( NYMEX:CL1! or AMEX:USO ) being primed to pop after it's seasonal downturn
This is a great example where money management is key as well as not blindly using the COT data as the sole reason for entry. Personally, I have a proprietary daily chart indicator I use to enter trades where COT data is giving signals. Crude Oil has been declining all the way down since June despite COT data that is telling us it is ready to go up (My proprietary indicator did not once provide a buy signal throughout that time period). I'm looking closely for a short-term signal to enter off of this week
Notes on My Trading Methodology and What I'm Even Talking About
COT Definitions:
- COT: Commitments of Traders Reports - A weekly report published by the government (CFTC) that shows long and short positions of the below 3 groups (As well as much more data I don't look at). We look at the NET positions of these 3 groups and compare them to historical levels to signal trade opportunities
1- Commercials: Hedgers - We want to trade with them when they're at extreme levels (Think Tyson, Cargill, General Mills, etc)
2- Large Speculators: Hedge funds and large institutions - We want to fade them when they are at max positions (Think suits in NYC and commodity funds)
3- Small Speculators: People/institutions trading small lot sizes not big enough to report to CFTC - We want to fade their max positions as well since they represent the public (Think dude in his PJs trading and small trading firms)
Indicators on Chart:
- The first indicator shows the net positions of the 3 groups above plotted over time
- The second indicator is an index of the relative buying/selling of commercials over a certain lookback period. Anything above 95 is looking for buy, look to sell when it hits 0
- Note: Just because the Commercial's net position is negative doesn't mean it can't be relatively net long and signal a buy (same in the opposite scenario)
Trade Setup - Both Must Happen:
- When commercials are at max levels we are alerted to buy or sell (Depending on the criteria above)
- On a daily chart , use technical indicators, candlestick patterns, news, etc to enter the trade (not shown here)
- Added bonus when the trend is your friend (I use a Multiple Moving Averages indicator to visualize)

BOIL Leverage 3X Natural Gas ETF Cup and Handle LONG AMEX:BOIL
BOIL is showing a cup and handle pattern at present
lending increased probability of a bullish continuation
that could yield a 50% price rise over the 45-day width of
the cup. Macro and fundamental factors support ongoing
natural gas price escalations including the supply issues
in Europe, the heat wave from climate change causing
and so on. The cup and handle on a relatively long time
frame increases both its reliability and the time period
for which the pattern to play out.

NG1! - Long - Futures - Cup and handleNatural Gas Futures from NYMEX has formed a cup and handle pattern.
We recommend a long position where, entry is at the breakout of the cup´s handle if, it is accompanied by a volume increase in trade of the natural gas futures.
Exit point is also shown in the chart.

Commodities are back, $UNG near breakoutThe natural gas ETF is forming a cup & handle with pivot buy at $31.60. This behavior signals a comeback for stocks in the gas industry.
Some of them are NASDAQ:NFE , which I was stopped out in June. NYSE:VET and AMEX:LNG . These 4 are in the top of my watchlist.
All are in confirmed uptrends and leading the sector. Several oil stocks also look good but I think that they are just following the gas stocks. I say this as the oil ETF AMEX:USO isn't as near of a new high as AMEX:UNG .
Look for stocks with gas exposure.

$LRS Latin ResourcesLRS is currently using the range high of that consolidation block weekly range marked on the chart. this range is important as this range was the last range before the market had a huge bull run march.
I have targets market on the chart, I will Cut if we get back and close below that weekly important range.
lets see.

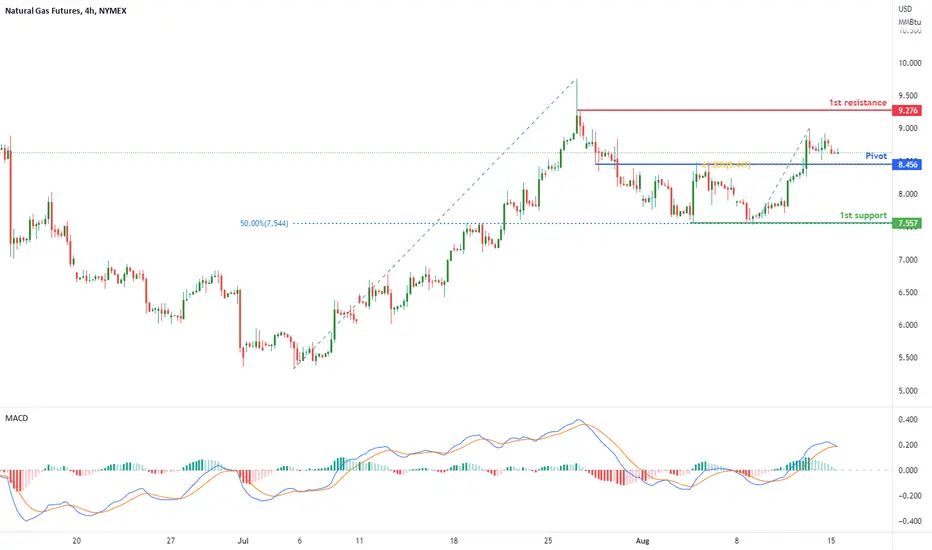
Natural Gas Futures (NG1!), H4 Potential for Bullish MomentumType : Bearish Drop
Resistance : 9.276
Pivot: 8.456
Support : 7.557
Preferred Case: On the H4, as the DIF is crossing the signal line and MACD histograms are shrinking above zero, we have a bearish bias that price may drop from the pivot at 8.456 where the 61.8% fibonacci retracement is to the 1st support at 7.557, which is in line with overlap support and 50% fibonacci retracement.
Alternative scenario: Alternatively, price could rise to 1st resistance at 9.276 where the swing high is.
Fundamentals: Western sanctions against major exporter Russia squeezed an already under-supplied global market causing a surge in crude and natural gas prices. Therefore, from fundamental view, the price of gas is rising, we should take note of this confliction with technical view.
NATURAL GAS Bearish Bias! Sell!
Hello,Traders!
NATURAL GAS is going up agian
And the price will soon retest
A horizontal key level
From where I think we will see
A pullback and a local correction
Sell!
Like, comment and subscribe to boost your trading!
See other ideas below too!

✅NATGAS SWING SHORT🔥
✅NATGAS is going up now
But a strong resistance level is ahead
Thus I am expecting a pullback
And a move down towards the target
SHORT🔥
✅Like and subscribe to never miss a new idea!✅

Looks like GAS prices will rise again!This chart shows how USOIL has been trending between this parallel channel ever since the covid crisis. the chart does showed some breakouts around the parallel channel yet its mainly within in. As per how the economy in America is going & more rise of inflation I can see another rise in gas prices over the coming months. I hope I'm wrong & it breaks to the downside. Stay safe investors & traders!

$RRC, cup & handle with a explosion gap pivot play Range Resources Corp is in the exploration and production of AMEX:USO and AMEX:UNG in the US.
It was recentlty feature in IBD and got me interested because its good looking cup & handle. Today managed to breakout with a gap. This gap should act as resistance.
As the market still needs to prove itself, I won't buy this breakout but the breakout from today's high with a stop loss just below yesterday's high. This strategy is called Explosion Gap Pivot. It uses the gap range as support.

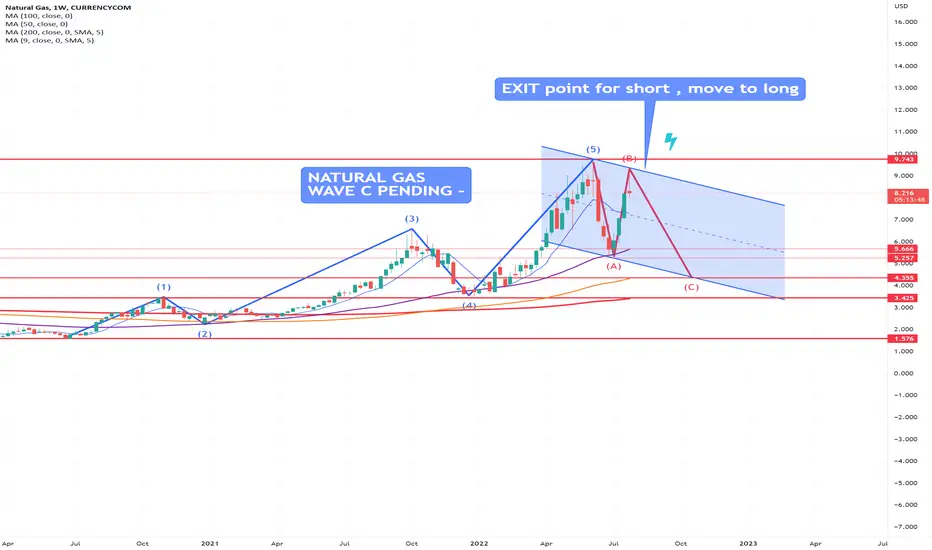
One final drop for natural gas and then a massive bull runWe're looking for one final drop in natural gas prices to complete a wave C for wave 2 before we will start accumulating positions to go long for the next bull run in natural gas. There's an energy crisis that isn't going to disappear anytime soon, there's plenty of fundamental reasons for this huge move we're expecting in wave 3. But in the mean time we're short on natural gas until this wave C is complete.

Gasoline almost back to pre-war levelsGasoline in the US has been trending lower and lower, now down 30% from its ATH. It hasn't filled the breakaway gap yet, but I think it will do so in the next few weeks, and that could be an excellent opportunity to go long in the short term.
Oil has filled the gaps and chopped at support for a while but is looking weak. What is strange is how supply is limited, the spot market is strong... yet the paper market (futures, etc.) is invalid. Maybe the weakness is due to broadly slowing growth and economic activity, though I am not sure the REAL recession is here yet. The energy crisis isn't over, especially not in Europe... and this could get worse before they get better.
Most issues remain the same, and there is very little progress. There are no new refineries; few nuclear plants are active again, Russia is still limiting gas flows to Europe, sanctions make oil flows harder, and OPEC+ cannot increase capacity fast. Our energy needs constantly grow, yet our production has plateaued. Very little can be done now to ease our problems, and our problems will become even worse if the SPR is drained and the US stops supplying the world with oil from its reserves. Most solutions require time, and politically many of these are not welcome by the green movement. Essentially, we have energy producers and green activists colluding to increase energy prices so that the first make more money and the second to make themselves feel good while simultaneously destroying people's lives and the environment.
I believe crude oil could get down to 75$ and even 55$ in the short term but ultimately will go much higher once the Fed and other central banks are forced to cut rates and print money. It's all about managing your positions until we get to that point, as a big recession could cause oil and gas prices to tank. Oil and gasoline prices rose so fast that it is almost impossible for such a move not to cause a recession and consequently demand destruction.
If we look at Gasoline prices in terms of other fiat currencies, we can see that they went 70% higher than their 2008 peak, which is a lot. I multiplied the RBOB with DXY to get a better picture of the actual cost of gas for everyone outside the US, as the US is less than 25% of the global economy. That means that for almost 90% of the population and 75% of the worldwide economy, gasoline costs 70% more than in 2008. This will have tremendous consequences, especially given the rate at which prices increase.
In conclusion, although I don't think prices have bottomed, and we could see a sharp decline in the next few months, I believe gasoline and oil prices will go much higher, and dips are for buying.

NATURAL GAS testing the 1D MA50 support.It has been almost 1.5 month since we last updated our Natural Gas (NG) thesis:
As you see the symmetry within this long-term Bullish Megaphone worked perfectly and our sell hit the 1D MA200 (orange trend-line) - 1D MA300 (green trend-line) Support Zone and rebounded. If you took that last buy and you haven't booked profits already, it may be a good time to do so if the current Support on the 1D MA50 (blue trend-line) breaks. The reason is the Double Top formation created on the July 26 rejection. If the 1D MA50 breaks, target again the 1D MA200 at least. This long-term pattern has been very consistent and there seems to be no reason to change that until it breaks either direction.
--------------------------------------------------------------------------------------------------------
Please like, subscribe and share your ideas and charts with the community!
--------------------------------------------------------------------------------------------------------

E-mini Natural Gas Futures (QG1!), H4 Potential for Bearish DropType : Bearish Drop
Resistance : 8.055
Pivot: 7.665
Support : 7.340
Preferred Case: On the H4, with price breaking the ascending trendline, we have a bearish bias that price may drop from our pivot at 7.665 where the overlap resistance is to the 1st support at 7.340, where the 50% fibonacci retracement is.
Alternative scenario: Alternatively, price could rise to 1st resistance at 8.055 where the 38.2% fibonacci retracement is.
Fundamentals: The Nord Stream gas pipeline has been the recent headline news with Gazprom halting an engine, and the Kremlin commenting that there were ‘some problems’ with another Nord Stream turbine. As the news develops significant volatility in energy prices is expected as uncertainty over gas supply to Germany and the Eurozone intensifies.

Gas futures down 7 of the last 9 weeksFirst of all, I used to always use CL1 as my main source of oil & energy. That measures Crude Oil futures. I think now is also an important reminder about the differences between Crude Oil futures and Gasoline Futures.
Before I really get started, let me say I am a big believer in new energy sources. I just don't think it makes sense to dig something up from the ground, burn it once, and then it's gone forever. Especially when it's possible to find sources of energy that are continually producing, no questions asks, no input or output required, just going at all times. The sun is one example.
Anyways, let's get back to the chart above that RB Gasoline Futures. This means reformulated gasoline, which is a cleaner type of fuel that is used in most cars and automobiles. So the chart is interesting because you can get feel for the price of gas, the cost to fill up a car, at any given moment. However, keep in mind that gasoline futures involve the delivery of 42,000 gallons of gasoline per contract. That's a lot! I don't know many traders who have enough space to store 42,000 gallons of gasoline. That's true for all futures contracts... they are huge quantities.
So if you look at RB1! you will see an interesting double bottom. That looks playable. But then again, 42,000 gallons per contract. Oil is coming on globally, cars are getting more efficient, and new energy sources are emerging.
My takeaway from all of this simple: a tradeable bounce is here. Quick swing trade. But I am not so sure that bounce will blast off quickly to the moon.
So this entire chart and energy market is in a strange situation. Did the bull rally come and go that fast? More importantly, what does that mean for all other markets from stocks to crypto?
I would add this chart to your Watchlist...

BTC Bull CaseThese are my quick plans on how i plan to trade BTC short term
Option 1 is a break above the Mid range and hold I will long with stops below Mid and targets to range high and above,
Option 2 is a break down and show signs of support at that Range low, if it holds i will look for entries to target mid and range high.
Do i care which way it goes , NO, am i predicting what way it goes NO.. these are plans, if this do this... It might well god candle up and not give any trigger to get in and that is ok.
My bear plan will follow where if it show certain Characteristics i will look for shorts.

MPC - Earnings play. Expected to increase Q/Q by a wide margin1 1/2 month H&S bottom bullish pattern. Pull backs light and normal. Today's print is a hammer candle.
You don't need to know what's going to happen next to make money ~Mark Douglas
Lose like a pro and keep trading, or lose like a novice and quit ~Mark Ritchie

$DXY onward 👁🗨*This is not financial advice, so trade at your own risks*
*My team digs deep and finds stocks that are expected to perform well based off multiple confluences*
*Experienced traders understand the uphill battle in timing the market, so instead my team focuses mainly on risk management
!! This chart analysis is for reference purposes only !!
If you want to see more, please like and follow us @SimplyShowMeTheMoney


Natural Gas NATGAS wave C is pending - Elliot Wave AnalysisNatural Gas NATGAS wave C is pending - Elliot Wave Analysis
NATURAL GAS - BAT PATTERN IN MAKINGNATURAL GAS is printing a bullish bat pattern. It is still in early stage as point C has defined its place. Pattern will complete at point D which is projected at 4.
The price has already been rejected at the key resistance on the daily chart, and RSI is headed downwards. There has also been a continuous decrease in volume from the first time the price tested the key resistance.
This may confirm that the price doesn’t have enough momentum to break through the resistance and is now set for a correction. There are a lot of contributing factors pointing to a bearish scenario for natural gas. Although the price might be bearish, watch out for relief pumps, especially on the support levels.
What do you think of the idea?
