$NTI NTI
--1 year accumulation/consolidation range
--Potential bull pennant forming.
--Hidden Weekly divergence
watch list for now.. looking for a break in direction A or B what direction do you have and why ??
-Landmark study into paediatric ASD (autism spectrum disorder) has now progressed to the to pivotal drug registration stage.
-NTI164 is one of NTI’s proprietary cannabis strains, and is said to be the world’s first full-spectrum medicinal cannabis product (less than 0.3% THC) to be successfully studied in children with ASD.
GAS

$CVX CHEVRON WYCKOFF plus INVERSE HEAD and SHOULDER Pattern$CVX Chevron Corp
This is one of my favorite charts because it had a clear UPTHRUST WYCKOFF DISTRIBUTION PATTERN and I was able to short the full measured move down without a sweat and share that with my friends, yay money!
Chevron has completed the full measured move down on the WYCKOFF distribution pattern and is showing signs of accumulation. A few things to note below:
1. Warren Buffet loaded on Chevron.
2. Supply on oil is still low and the demand is high. The government policy on oil refineries doesn't help the supply.
3. The Russia War on Ukraine is still in full effect. (prayers)
4. Their earnings lag, however, this stock will move significantly on news that directly effects these headlines.
5. It is a dividend paying stock, I believe the news will try hard to beat it down so hedge funds can load up.
Like I mentioned above, $cvx appears to be in accumulation, it has formed a decent consolidation pattern.
If you zoom into the 4 hour timeframe you will find a beautiful INVERSE HEAD & SHOULDER pattern developing (flip from bars to line chart for a different view).
The left shoulder shows the highest selling volume bar and checks the box of a textbook inverse H&S.
However, if this pattern fails, I have setup some support levels below.
This one will be on the top of my watchlist next week!

$SPY Bear Flag or Diamond Pattern? $SPXThe S & P 500 is showing mixed technical analysis, while the bear flag is the most obvious in the chart. The bullish price action near support could turn this into a diamond reversal bottom if we continue side ways and print CPI showing positive signs that inflation is slowing. It could also move upwards if CPI prints stagnant proving the increase of rates and QT (quantitative tightening is working). However I don't believe that will last long, IF it even occurs (more of a initial reaction). Continued stagflation will send consumers into panic and saving mode as supply remains low and demand remains high.
Top 3 categories to follow for stagflation/inflation:
1. FOOD
2. OIL/GAS/ENERGY
3. HOUSING
Jerome Powell admits that the FED underestimated inflation.
Always check the essentials that humans need to survive daily. The materialistic stuff will naturally decrease if we lack supply in essentials.

NATGAS RSI in 4hr time frame showing a positive sign. Chart structure looks good for a relief bounce. First target would be 6.7

Gas Natural Gas - 5 Elliot Waves CompletedGas price followed rules of an Elliot Wave and after 5 rises first Correction drop of ABC correction is visible

oil 6\23 update~i recently discussed the possibility of oil topping out,
but after diving a little deeper into the charts (specifically the energy sector) -
i've come to the conclusion that it wants to move higher.
---
i'm going to be looking for some chop in the days ahead, which can take oil down to anywhere between $99~$96
followed by a pretty nice move up to $156.
it can go higher theoretically, and i almost would expect it to, but that's my conservative upside target.

NATGAS Has a bit of up side before major breakdownI was recently short on NATGAS and made a good profit...now I am willing to risk some of that profit to go long for a short term.
This can come down a bit more but has a bit of upside, before major collapse to 5$ level of before war time.

✅NATURAL GAS SWING LONG🚀
✅NATURAL GAS has been falling recently
And the pair seems locally oversold
So as the pair is approaching a horizontal support
Price growth is to be expected
LONG🚀
✅Like and subscribe to never miss a new idea!✅

OIL still has headroom UPIf you missed buying earlier in year, now is great discount on OIL. Inflation & stagflation will be here for at least another full year, so the trend will still continue up. When gas price lowers significantly at the pump, then the party is over. Not sooner.

$DXY gap fill? 👁🗨*This is not financial advice, so trade at your own risks*
*My team digs deep and finds stocks that are expected to perform well based off multiple confluences*
*Experienced traders understand the uphill battle in timing the market, so instead my team focuses mainly on risk management
!! This chart analysis is for reference purposes only !!
If you want to see more, please like and follow us @SimplyShowMeTheMoney

$EQX gold setup 👁🗨*This is not financial advice, so trade at your own risks*
*My team digs deep and finds stocks that are expected to perform well based off multiple confluences*
*Experienced traders understand the uphill battle in timing the market, so instead my team focuses mainly on risk management
My team entered gold mining company Equinox Gold Corp $EQX today at $5.75 per share. Our take profit is $9.50. We also have a stop less set at $5.15
OUR ENTRY: $5.75
FIRST TAKE PROFIT: $9.50
STOP LOSS: $5.15
If you want to see more, please like and follow us @SimplyShowMeTheMoney

Natural Gas is overbought. Time to go for a quick shortNatural Gas is extremely overbought. I am now short at 9.3$ with 3% portfolio and will add around 9.8$ another 6% of portfolio

Huge bearish divergence on NATGASI am keeping my shorts and will add to shorts if we get above 9.8$
The chart says it all, negative divergence shows it is just the retail traders who are bullish and chasing. The big guys will dump their gas on the retail and its gonna stink so bad

$CRK oil hedge 👁🗨*This is not financial advice, so trade at your own risks*
*My team digs deep and finds stocks that are expected to perform well based off multiple confluences*
*Experienced traders understand the uphill battle in timing the market, so instead my team focuses mainly on risk management*
Today my team entered oil company Comstock $CRK at $20 per share. Take profit is unknown but the set-up looks very promising.
Entry: $20
If you want to see more, please like and follow us @SimplyShowMeTheMoney

Oil price the same so why is gas higherOil is the same price it’s been since 2008 so who wants to explain to me why gas is triple priced? I think I know why because the corporation knows they can price gouge us with this moron in office who is also getting himself rich; they know he can’t and won’t do anything about the crashing and rip off of our economy because he is doing it to. 40 billion they gave ukraine would have given every homeless American 557,000 of them over $70,000 each we literally could have ended American homelessness instead of this fake war sending our hard earned money while we suffer in poverty here we need to unite and do something about this

NatGas: It´s not over, yet!Yesterday´s massive sell-off of natural gas sparked many discussions about what is going to happen next. Well, we expect the price to drop further and reach the turquiose zone between $6.482 - $5.858. Here, we believe that the correction will end and turn into a big upward trend. However, if the course drops below this zone, further sell-offs will be triggered.

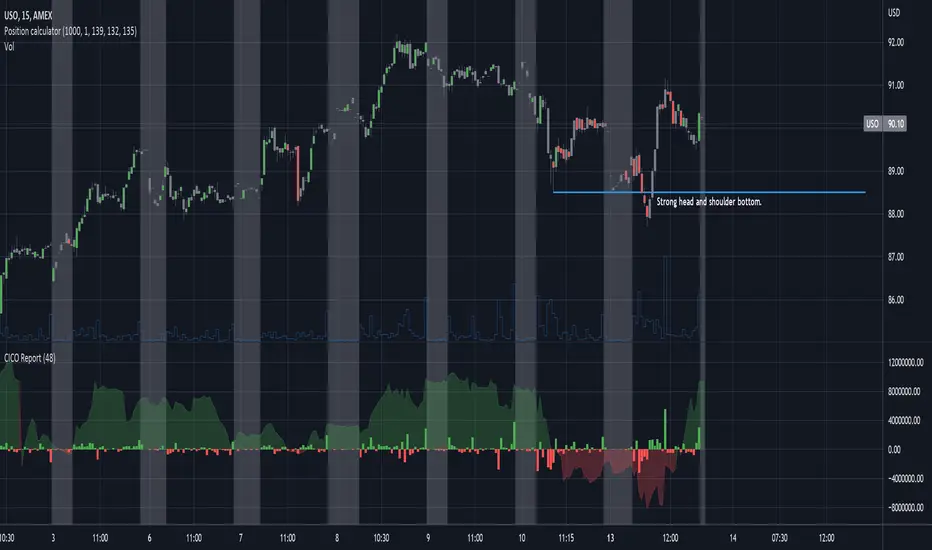
Strong head and shoulders bottom. This is the Cash in/cash out report (CICO) set to 48 user input on the 15 minute chart. The CICO is a running 12 hour estimated sum of cash going into and out of a commodity. I see a strong head and shoulders bottom. Summer gas prices are here!!!! <--- sarcasm.
Apply the CICO report to your charts and give me feedback! The CICO is a free open source indicator here on tradingview.com I am trying to turn this idea into an app!
GASS high demand for its services soon!!!The U.S. will supply 15 billion cubic metres of LNG (liquefied natural gas) to the European Union this year to help it wean off Russian energy supplies. And this looks like the beginning of a long term business plan.
GASS StealthGas provides seaborne transportation services to liquefied petroleum gas (LPG) producers and users internationally, including various petroleum gas products in liquefied form, including propane, butane, butadiene, isopropane, propylene, and vinyl chloride monomer, also refined petroleum products (gasoline, diesel, fuel oil, and jet fuel, as well as edible oils and chemicals).
GASS has a fleet of 50 vessels!
Market Cap of only 90.493Mil
I think this stock can easily double soon!
Looking forward to read your opinion about it.

Oil and Gas at it again $FTXNThis ETF is the one a chose to play the new trend. I made a good profit from it and today is signaling another pivot buy. With today's breakout out of an ascending triangle the price may be posed to continue its trend up.
I'd be very cautios and start with small positions or go with a full position but taking profits quicker.
Remember to always use STOPS!

Excelerate Energy $EE still holdingNYSE:EE is a company that provides liquefied natural gas and energy solutions in Texas, USA. They recently signed a FSRU (Floating Storage Regasification Unit) Charter Agreement with Gasgrid Finland to provide "energy security and supply diversification to Finland while also serving more broadly the needs of the Baltic Sea region".
I bought an initial position at the breakout from a "low cheat", it had a good follow through but then the outside bar erased it.
Now I just tightened my stop below the $28.75 zone because the selling has been in light volume and its a good resistance line.
If the price makes a new high above $31 I'll be buying it. For now I'll wait.

Gas prices to rise 5-10%Due to the lack of supply from the OPEC and the US' production slowdown and the Russian invasion of Ukraine, the prices of gas have increased significantly.
In the next couple of weeks, the prices of gas are expected to increase by 5-10%. This will continue to increase throughout the summer of 2022. China's demand for crude oil is expected to rise as the Covid Lockdowns come to an end.
Crude Oil Prices are likely to remain above $115 for the rest of the year.

This Won’t End Well……….It may seem pretty obvious when looking at this chart, but every time oil has spiked rapidly like this, it follows with a massive downturn. It will be interesting to see what happens in the next couple months with crude.

Less Liquidity In Summer Months Could Lead To More VolatilityThe Memorial Day weekend is the start of the summer season. In many markets, seasonal factors can impact prices. The old saying, “sell in May and go away,” may not be applicable in the stock market as stocks have been on a rocky path lower in 2022. In commodities, gasoline, meats, grains, and other raw material prices often increase as demand peaks. Heating oil and other winter commodities often move to the downside. However, 2022 is anything but an ordinary year in markets.
Thin markets are more volatile than liquid markets
Market participants are tired and frustrated in 2022
Lockdowns over the past years could lead to extended summer vacations
Lots of head-fake moves on the horizon
Expect the unexpected- Volatility leads to opportunity
Over the past two years, the global pandemic distorted prices. Stocks rose as artificially low interest rates made the stock market the only alternative with fixed income yields at historical lows. Rates are rising in 2022, with a hawkish Fed and falling bond market. Supply chain bottlenecks continue to plague commodities, and the war in Ukraine has only exacerbated pricing and availability issues. Mid-term elections in the US, and a Presidential contest in Brazil, a leading commodity-producing country, are on the horizon later this year. The geopolitical bifurcation between nuclear powers is another issue facing markets that reflect the economic and geopolitical landscapes.
Market participants are exhausted as 2022 has brought a new set of concerns. We could see liquidity in markets dry up over the coming weeks and months as the summer has arrived, and vacations will limit participation in markets across all asset classes.
Thin markets are more volatile than liquid markets
Liquidity is a critical ingredient for smooth-running markets. Liquidity tends to reduce price variance as more market participants increase buying and selling interests at various levels.
Commodities tend to be more volatile than other assets, sans cryptocurrencies, but some raw material markets experience far more volatility than others. Lumber and crude oil are two highly volatile commodities, but one has minimal liquidity while the other experiences far more participation.
The daily chart of CME lumber futures shows that daily volume tends to be well below 500 contracts. Open interest at 2,293 contracts makes lumber an illiquid market. Daily historical volatility at over 62% is a function of the lack of volume and open interest, leading to price gaps and limit-up and limit-down price moves where buying disappears during bearish periods and selling evaporates when the price moves higher.
Meanwhile, on a typical trading session, NYMEX crude oil futures trade well over 400,000 contracts, with open interest at above 1.81 million contracts on June 2. Daily historical volatility at below 20% reflects that the highly liquid oil market has buyers and sellers at all price levels.
The bid-offer spreads in liquid markets are far tighter than in illiquid markets. As liquidity declines, markets tend to experience far more price variance.
Market participants are tired and frustrated in 2022
In early 2022, market participants were breathing sighs of relief as the global pandemic was beginning to fade in the rearview mirror. Health concerns may have declined, but financial woes increased with prices.
Monetary and fiscal policies planted inflationary seeds that have caused prices to explode higher, while supply chain bottlenecks continue to exacerbate inflationary pressures. Meanwhile, the Russian invasion of Ukraine is another crisis following on the heels of two years of pandemic panic. Sanctions and Russian retaliation exacerbate inflation. Moreover, Russia’s “no-limits” cooperation with China creates a geopolitical bifurcation of the world’s nuclear powers.
We live in interesting and exhausting times, with people tired and frustrated with the events since 2020.
Lockdowns over the past years could lead to extended summer vacations
Lockdowns ended in the US as vaccines went into arms. People have returned to work and school. In China, the COVID-19 restrictions appear to be easing. In early June 2022, the coming summer months offer the opportunity to rest, relax and recharge internal batteries for the second half of 2022. The demand for travel, hotel rooms, and other vacation-related consumer products has soared. Inflation and supply chain bottlenecks have only increased prices, but the demand is robust.
As market participants take a few weeks off over the coming months, they are likely to turn off their screens and ignore the market action that could interfere with good times with friends and family. Increased vacations may bolster earnings for travel-related businesses, but it will reduce market liquidity as a vacation for many includes a rest period from watching or participating in markets across all asset classes.
Lots of head-fake moves on the horizon
As liquidity declines because of a lack of participation, markets will likely become a lot bumpier over the coming weeks and months. Selling could lead to downdrafts and buying may create rip-your-face-off rallies. These events cause head-fake moves that can cause even the most experienced traders and investors more than a bit of indigestion.
A decline in liquidity could dramatically increase price variance. The geopolitical and economic landscapes will not take any vacation during the summer of 2022.
Expect the unexpected- Volatility leads to opportunity
Expecting the unexpected will reduce the stress-related with sudden market volatility. Moreover, higher price variance increases opportunities for nimble traders and investors with their fingers on the pulse of markets.
Approach markets with a sold risk-reward plan that avoids open-ended risks. Even though declining liquidity can cause markets to rise or fall to irrational price levels, always remember the current price is always the correct price because it is the level where buyers and sellers meet in a transparent environment, the marketplace. Do not be afraid to take small losses and remember to take those profits or adjust risk levels to protect them when markets reach targets. Trading or investing with a plan and sticking to it avoids the ego-related mistakes that cause us to believe we are always right, and the market is wrong. The market price is never wrong.
Meanwhile, combinations of put and call options can protect the downside, hedging portfolios while allowing for upside participation that will enable you to enjoy your time off from the daily grind. Enjoy the summer but keep your eyes open for opportunities. Adjust your mindset to expect the unexpected and embrace the higher volatility that comes alongside lower liquidity. Price variance is a nightmare for the passive, but it creates a world of opportunity for the dynamic.
--
Trading advice given in this communication, if any, is based on information taken from trades and statistical services and other sources that we believe are reliable. The author does not guarantee that such information is accurate or complete and it should not be relied upon as such. Trading advice reflects the author’s good faith judgment at a specific time and is subject to change without notice. There is no guarantee that the advice the author provides will result in profitable trades. There is risk of loss in all futures and options trading. Any investment involves substantial risks, including, but not limited to, pricing volatility, inadequate liquidity, and the potential complete loss of principal. This article does not in any way constitute an offer or solicitation of an offer to buy or sell any investment, security, or commodity discussed herein, or any security in any jurisdiction in which such an offer would be unlawful under the securities laws of such jurisdiction.
