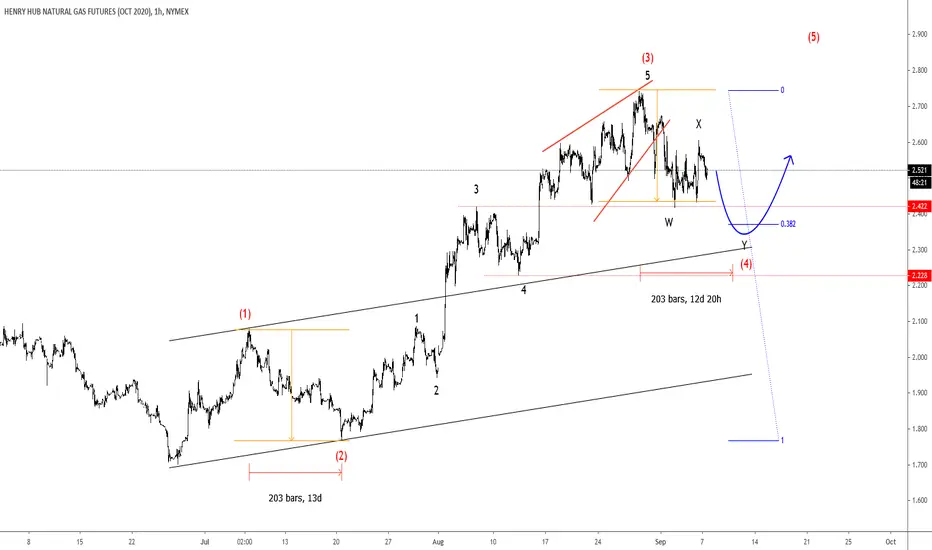
Natural Gas At Support - Elliott wave analysisHi traders,
Looking at natural gas, we are still tracking a correction in wave (4). Currently it is trading at 2.4 support level, which can be first potential turning point zone, however, in case of a deeper corrective W-X-Y, price can retest 38.2 Fibo. retracement and the base channel line (2.2 area), where support can also be seen.
GAS
#GAS BTC ( Long Term ) For long-term investments we expect an increase in the coming months
Stop loss : 0.0001390 satoshi
Don't forget about risk management

GASBTCGASBTC
Purchase in the area of 0.00017 - 0.000151
1 - 0.000210
2 - 0.000260
3 - 0.000313
4 - 0.000400
Fixation below the green trend line, the price may turn into accumulation
f you like what I do, put 👍 and subscribe
Waiting for your comment, what do you think about this?
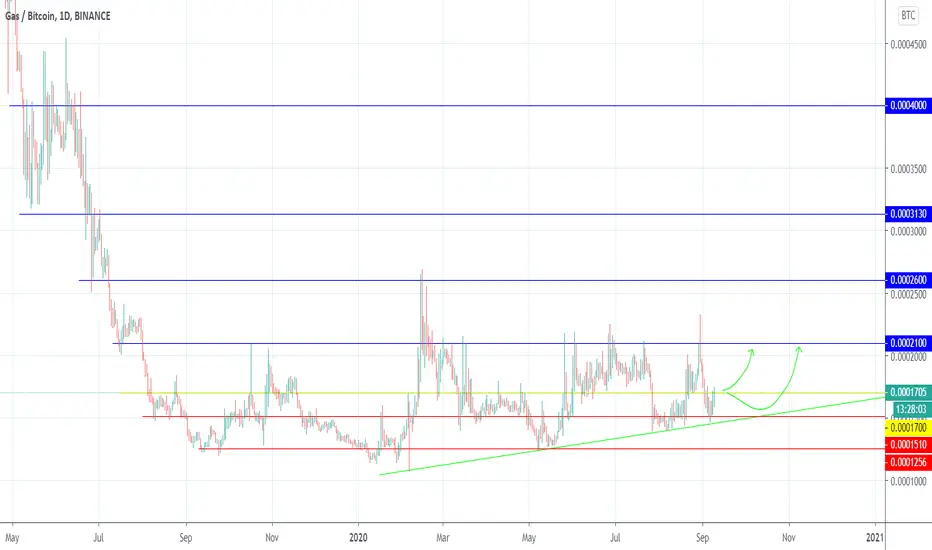

GAS/BTC - a map for the futureGAS/BTC - a map for the future
Gas retraced more than 98% against BTC, which is quite a lot, and started what seems an accumulation phase after 11th September 2019
The green line will be a strong support, and the first RED line will be a possible Target at 2777.
If it will b able to close a weekly candle above it, the other long term goals could be 4440.
Lastly, if it would be able to close a weekly candle above 4440, it could aim to 6111
As you can see 4440 and 6111 are less colored because are less probable.
The Pink dates could be a moment where the price tend to bounce up or slow any eventual fall.
In the short term, it is possible that the price could be rejected by the red eye.
LS MASTER TRADING SYSTEM


GASBTC | Accumulation about to breakGASBTC is attempting a breakout.
If broken out next resistance is 120% away.
Dont miss this one


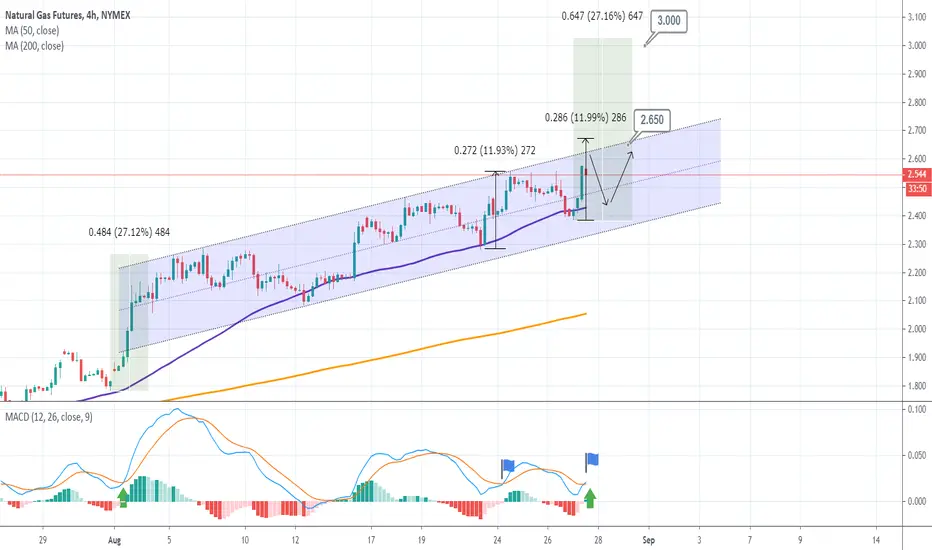
NATURAL GAS Trading PlanPattern: Channel Up on 4H.
Signal: Bullish on the 4H MA50 or if the Channel Up breaks upwards.
Target: 2.650 and if 2.680 breaks (+12% from low) potential extension towards 3.000 (+27% from low).
** Please support this idea with your likes and comments, it is the best way to keep it relevant and support me. **
!! Donations via TradingView coins also help me a great deal at posting more free trading content and signals here !!
NOG is worth a gambleNOG is a oil and gas company in Minnesota, which is an interest stock that poped up on r/pennystocks and think it might be worth to toss in some money into it. It hasn't perform well at all, yet the reason for this gamble is that the election is coming up and Republicans are pro oil and gas as further green technology is being developed, yet the Democrats want to go full green with their green new deal which could destroy the oil and gas and company.
News
-Elections are coming up this November for the US and Minnesota is a key battleground state. It was Democrat in 2016, yet this year its classified as a battleground state and following 2016 Democrats won with a 1.5% margin. Pretty dam close. Current polls shows that biden was winning by 18, yet now only 2.
Source: projects.fivethirtyeight.com
-ER wasn't great, yet could be due to fact of the covid 19. According to USAtoday as of 8/25, Minnesota is growing in the number of cases.
TA
-Now the upside potential out weights the downside with .6377 being on the table which is a 8.6% drop in price. The upside ranges from 5.7%-50% in the short term from tagets of .742, .8515, and 1.0494.
-This stock is in a long term downtrend, yet high vpvr shows a range of .742-.8515 would be in the realm of possibilities and could be a nice short term trade.
-MACD is rising which is bullish
-RSI is just overbought, yet could be overcome with sideways movements or extreme volatility coming soon.
Final Thoughts
My political view has no affect, yet I would assume a Trump victory would push this stock higher or lower. Whatever party you are a small gamble in a small oil and gas stock from a battle ground state wouldn't be a bad idea. I took a position in this stock today just to see where it goes when we get close to the election/debates/ and after the elctions. If movement starts going up showing massive buys you could suspect the oil sector will being pushing up rapidly. So in the meantime watch the polls, if they are even worth to watch after 2016, to see who Minnesota favors and watch tweets from Trump about Oil and Gas.

NG: UNG: BOIL: Natural Gas Chart Forming a Top?Bullish factors: NG Natural gas price has been rallying for the past month reaching $2.5 level on increased consumption during summer months, improving LNG flows reaching 5.1 bcf/d in mid-August, and two tropical storms in the Gulf area threatening natural gas production. The fundamentals remain bullish going into mid September.
Bearish factors: Production is steady at about 92 bcf/day, while consumption has been declining to 83 bcf/day lately on cooling temperatures. Two tropical storms, Marco and Laura, are not expected to produce substantial disruption to natural gas production, but may produce loss in demand due to cooling temperatures and power outages.
Technical analysis: Divergence between price and volume is pointing toward a potential top. On a daily chart , RSI is above 70, approaching overbought territory. We have an unclosed gap at $2.77 level, which may be the next top.
National demand is expected to be cooling going into September. Overall demand will be driven largely by LNG exports, which are expected to remain steady at around 5 bcf/day, 10-20% below levels seen in the fall of 2019. The forward curve seems to be pricing in a more robust recovery in demand than actually observed.

Natural GasExperimental probability of breaking 13/07/20 high (2.9756) > 80%
Expected reward: High (Targets highlighted on chart)
Entries: Discount zones highlighted on Chart
Note: discount zone are invalid if price broke the high.

NG: UNG: BOIL: Natural Gas Chart is Forming a TopBullish factors: NG Natural gas price has been rallying for the past month reaching $2.5 level on increased consumption during summer months, improving LNG flows reaching 5.1 bcf/d in mid-August, and two tropical storms in the Gulf area threatening natural gas production. The fundamentals remain bullish going into mid September.
Bearish factors: Production is steady at about 92 bcf/day, while consumption has been declining to 83 bcf/day lately on cooling temperatures. Two tropical storms, Marco and Laura, are not expected to produce substantial disruption to natural gas production, but may produce loss in demand due to cooling temperatures and power outages.
Technical analysis: Divergence between price and volume is pointing toward a potential top. On a daily chart, RSI is above 70, approaching overbought territory. We have an unclosed gap at $2.77 level, which may be the next top.
National demand is expected to be cooling going into September. Overall demand will be driven largely by LNG exports, which are expected to remain steady at around 5 bcf/day, 10-20% below levels seen in the fall of 2019. The forward curve seems to be pricing in a more robust recovery in demand than actually observed.

USDWTI H4 - Long Trade SetupUSDWTI H4 - Waited for this breakout last week but we never saw it. Many rejections from just shy of $43/b, ideally looking to break upside of this and retest in the region of $42.85, from here, looking to jump involved with the long move.

GUSH may have a bullish week. BUY SET UPthis is a trade idea on GUSH the s&p oil and gas index. This week looks like it MAY be bullish but this index seems to gap often and drop quickly. it appears that the down trend in the long term has worn out but the goal is always to get the pieces out of the market and not overhold trades. the entry and exits are shown on the chart. the risk and reward is nice BUT this is not to be considered long term analysis this is a trade set up and analysis only for this week. all my trade ideas are influenced by the elliot wave principles if you find my charting helpful please follow.


NATGAS Update and New Trading SuggestionMidterm forecast:
2.200 is a major support, while this level is not broken, the Midterm wave will be uptrend.
We will close our open trades, if the Midterm level 2.200 is broken.
Technical analysis:
The RSI downtrend #1 is broken, so the probability of continuation of uptrend is increased.
While the RSI uptrend #2 is not broken, bullish wave in price would continue.
A trough is formed in daily chart at 1.640 on 07/20/2020, so more gains to resistance(s) 2.500, 2.700, 2.950 and more heights is expected.
Price is above WEMA21, if price drops more, this line can act as dynamic support against more losses.
Relative strength index (RSI) is 74.
Trade Setup:
We opened 10 BUY trade(s) @ 1.94 based on 'previous Forecast' at 2020.07.29 :
Total Profit: 313 point
Closed trade(s): 109 point Profit
Open trade(s): 204 point Profit
Closed Profit:
TP2 @ 2.00 touched at 2020.08.03 with 6 point Profit.
TP3 @ 2.10 touched at 2020.08.03 with 16 point Profit.
TP4 @ 2.25 touched at 2020.08.04 with 31 point Profit.
TP5 @ 2.50 touched at 2020.08.04 with 56 point Profit.
6 + 16 + 31 + 56 = 109 point
Open Profit:
Profit for one trade is 2.45(current price) - 1.94 (open price) = 51 point
4 trade(s) still open, therefore total profit for open trade(s) is 51 x 4 = 204 point
New Trading suggestion:
. There is still a possibility of temporary retracement to suggested support line (2.330) again. if so, traders can set orders based on Price Action and expect to reach short-term targets.
Take Profits:
TP5= 2.500
TP6= 2.700
TP7= 2.950
TP8= 3.350
TP9= 3.700
TP10= Free
❤️ If you find this helpful and want more FREE forecasts in TradingView
. . . . . Please show your support back,
. . . . . . . . Hit the 👍 LIKE button,
. . . . . . . . . . . Drop some feedback below in the comment!
❤️ Your Support is very much 🙏 appreciated!❤️
💎 Want us to help you become a better Forex trader?
Now, It's your turn!
Be sure to leave a comment let us know how do you see this opportunity and forecast.
Trade well, ❤️
ForecastCity English Support Team ❤️


NATURAL GAS Rallye haussier du natural gas après avoir casser la résistance des 1.962, celui ci pourrait continuer a faire des plus haut dans ce long canal haussier qui vient de se former.
Notre vue est plus du côté des bull mais nous nous attendons a une légère correction du marché avant de retrouver une hausse plus importante.
Voici nos objectif , nos zone de risques , ainsi que notre prix d'entrée.
NATURAL GAS SIGNAL ALERTE⚠️ ⚠️
BUY / ACHAT🟡 : 2.298
STOP LOSS🔴 : 2.178 TP 1🔵 : 2.592
TP2 🟢 : 2.888
POTENTIEL PROFIT : + 25,61%📈
POTENTIAL LOSE : - 5.06%
@FOREXONOMIE

Time is Running Out for NG Bears 8/14/2020Natural gas at the daily view.
Natty is currently in a giant bull flag right now. Bears had nearly 2 weeks and every chance to take NG down. However, it didn't happen, yet. Unless that happens, Natty is consolidating for another leg up.
The 300 DMA is at 2.08. The 400 DMA is at 2.24. That's why Natty has been bouncing between those two prices.
Here is why bears are running out of time. The 20 DMA just crossed upwards to the 200 DMA. Normally, that's a bullish sign. The 50 DMA will be doing the same within less than 2 weeks. When that happens, the measured move for the next leg up is around 2.48.
My bias at this point is becoming increasingly bullish. Personally, I'll start scaling in next week.

NATURAL GAS Sell SignalPattern: Bullish Megaphone on 1D.
Signal: Sell as the price is testing the Higher Highs trend-line of the pattern. RSI also close to a top.
Target: 1.950 (potential Golden Cross).
** Please support this idea with your likes and comments, it is the best way to keep it relevant and support me. **
!! Donations via TradingView coins also help me a great deal at posting more free trading content and signals here !!
Shout-out to TradingShot's top TradingView Coin donor this week ==> @scheplick
