Crudoil on accumulation to pierce the weak resistance pointCrudeoil is to test the weak resistance zone soon.
GAS


Natural Gas (NATGASUSD): Catching a Pullback
Natural gas is approaching a rising trend line on a daily.
on 1H the price has formed a double top with a lower high breaking and closing below 1.62 minor support.
now the price may go lower.
target levels:
1.576
1.550

UNG: NG Natural Gas Declining Through Summer on Low DemandNG Natural Gas August futures contract has been declining on cancelled LNG shipments and low national demand. US supply keeps steady outpacing demand. US demand started improving on June 21st due to reopening of NY-NJ-PA economies. However, Texas extended its lockdowns, counteracting positive effect of the East Coast. Seasonal heat is high. But with 40-50 August LNG shipments cancelled, the market may remain in oversupplied state for months to come.
August 24th may be a potential turning point for natural gas. Prices are likely to continue decline under current oversupplied conditions. Analysts see target support at $1.25, 1995 low, and then at $1.00, all-time low. Resistance is seen at $1.52, and $1.60 levels.
Technicals: Daily chart is pointing to a neat-term bottom with potential upward move within declining channel. NG rolled into August contract, which was trading higher than July contract, which could explain a Friday pop. There is a possibility for a near-term price improvement to $1.65- $1.75 level (tentative), between July 1st and July 17th, with continuing decline after mid July.

Natural Gas: Excellent Buy Opportunity for Long-term Investors.Natural Gas is trading within a Channel Down (on the log scale) on the 1W chart (RSI = 45.584, MACD = -0.111, ADX = 31.401) since 2009. This pattern provides very accurate Cycles, bullish when a Lower Low is made (green arrows) and bearish when a Lower High is made (red arrows).
At the moment the price has just made contact with the Lower Low trend-line, making Natural Gas an automatic long-term buy opportunity for the next 2-3 years. Keep a few reserves for the lower slope dotted Lower Low trend-line for one last buy if needed. Depending on your risk tolerance book the profit just above the 1W MA200 (orange trend-line) and re-buy on the test of the 1W MA50 as support. This pattern took place on the previous two Cycles.
** If you like our free content follow our profile to get more daily ideas. **
Comments and likes are greatly appreciated.

MTDR was a top gainer, rising +270.64%. Expect Uptrend reversalMatador Resources (MTDR, $8.71) was one of top quarterly gainers, jumping +270.64% to $8.71 per share. Tickeron A.I.dvisor analyzed 95 stocks in the Oil & Gas Production Industry over the last three months, and discovered that 90 of them (95.24%) charted an Uptrend while 5 of them (4.76%) trended down. Tickeron A.I.dvisor found 227 similar cases when MTDR's price went up 15% within three months. In 139 out of those 227 cases, MTDR's price went down during the following month. Based on these historical data, Tickeron A.I. thinks the odds of an Uptrend reversal for MTDR are 61%.

NBLX was a top gainer, rising +204.09%. Expect Uptrend reversalNoble Midstream Partners LP - Unit (NBLX, $8.99) was one of top quarterly gainers, jumping +204.09% to $8.99 per share. Tickeron A.I.dvisor analyzed 40 stocks in the Oil & Gas Pipelines Industry over the last three months, and discovered that 40 of them (100%) charted an Uptrend while none of them (0%) trended down. Tickeron A.I.dvisor found 169 similar cases when NBLX's price went up 15% within three months. In 106 out of those 169 cases, NBLX's price went down during the following month. Based on these historical data, Tickeron A.I. thinks the odds of an Uptrend reversal for NBLX are 63%.


4HS Bearish Scenario + Trade idea on NATGAS by ThinkingAntsOkMain Items we can see on the chart:
a) The price has broken a major support zone
b) Before that happened we observed a consolidation of 150 days
c) Now we can see a bearish breakout and this is the way we will trade it
d) Based on the previous scenario we had a breakout and then a pullback, that's the same logic of what we will be waiting
e) If the pullback happens we will set orders below the structure and our Target will be the 2nd support zone.

MCF Stochastic Oscillator left the oversold zone on June 24This is a signal that MCF's price trend could be reversing, and it may be an opportunity to buy the stock or explore call options. Tickeron A.I.dvisor identified 63 similar cases where MCF's stochastic oscillator exited the oversold zone, and 57 of them led to successful outcomes. Odds of Success: 90%.

AM, ($5.41) was a top quarterly gainer, rising +151.95%Price = $5.41
Daily change = -$0.31 (-5.42%)
Daily volume = 5.7M
3-month price change = +$3.26 (+151.95%)
Capitalization = $2.6B
Tickeron AI shows that Antero Midstream (AM, $5.41) was one of top quarterly gainers, jumping +151.95% to $5.41 per share. Tickeron A.I.dvisor analyzed 40 stocks in the Oil & Gas Pipelines Industry over the last three months, and discovered that 38 of them (94.12%) charted an Uptrend while 2 of them (5.88%) trended down.

Natural Gas - trend to levels belo 1.00As predicted in our post of April 22, Natural Gas grew more than 10% when completing minor wave 2 and is running minor 3 down that should push its price to levels below 1.0 If price crosses up 1.79, this analysis should be reviewed. FOLLOW SKYLINEPRO TO GET UPTDATES.

Natural Gas - correction up before new lowsNatural Gas is tracing minor wave 2 up. The most probable target is at 2.42 before going down again. If prices break down 1.78 this set up should be void. FOLLOW SKYLINEPRO TO GET UPDATES.

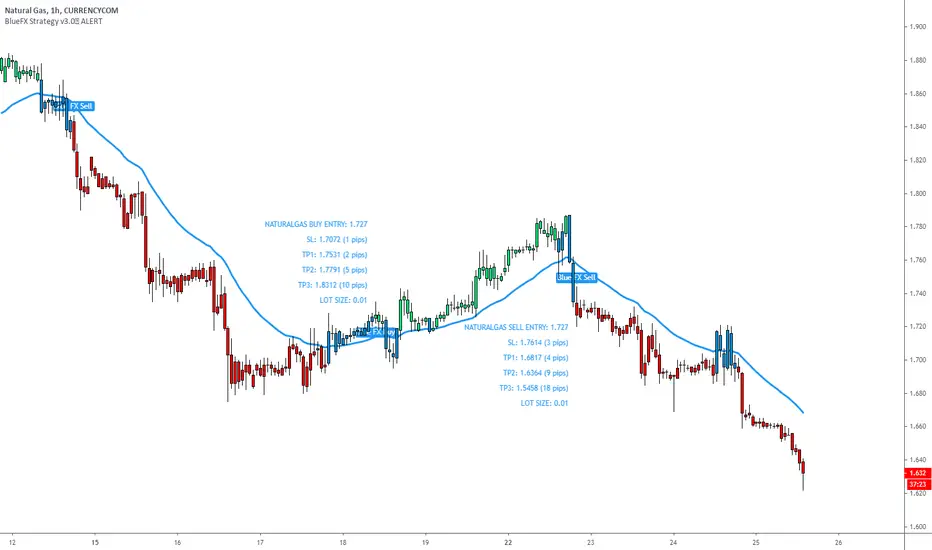
NATGAS - just a screen shot of the last 3 tradesPrice is moving down, but this is a simple screen shot showing the accuracy here with out strategy.
Simply follow the Buy and Sell entries, profit opportunities shown here.
Regards
Darren
NG final leg for 5 yearsNG is about to take the final leg down to complete cycle 3 down wave. Three Drivers pattern should be complete with that leg and the next up move will push for the breakout of the 11-years channel.

NGL Energy Partners (NGL) short.All description on the chart.
Please, don't forget to like and follow.
Thank you.

BOIL RSI Indicator left the oversold zone on June 19, 2020A buy signal is generated. This is a signal that BOIL's price could be shifting from a downtrend to an uptrend. Traders may consider buying the stock or exploring call options. I looked back and found 37 similar cases where BOIL's RSI Indicator left the oversold zone, and in 31 of them led to a successful outcome. Odds of Success: 84%.

Trade of the century! Question is are we ready yet?DONT THINK SONo no no say so! Im ready to be full on bull but itll be later next month or 2. Need a month green bar then its good to go. Look for the big boys to funnel prices down and up for a while do not get fooled yet! But dont miss out and wish you would have bought some gas instead of farting it out and having to smell that pain while watching tv!


NG: UGAZ: Natural Gas Consolidating Lower. Demand Improving.NG Natural Gas July futures contract continues declining on recent lower demand. Fundamentals are still bearish: low LNG exports, 4 Bcd vs 9 Bcd in the winter, and cooler weather over North East. The temperature is expected go higher on June 25-28, per NatGasWeather. With economy reopening on June 20-21, EIA weekly report may turn bullish in the 1st week of July.
The chart is oversold; buyers are coming in at $1.60 level. Last week build was 93 bcf. A build below 90 bcf would be a bullish sign. A short-covering rally may happen soon in anticipation of improving demand.
Lower prices are still possible, if LNG exports do not improve, or weather does not prove to be hot enough. Yet, reopening of the economy should boost demand significantly moving into July.

Trade NatGas? Down we come!All picked up with the strategy.... keep it simple.
Trade what you see not what you think, move with the market.
Regards
Darren


Trading plan for Natural Gas - Short Strategy - NGSell : 1,673
Target : 1,639
And don't forget to take your profits...
