NG: Natural Gas Further ConsolidationNatural Gas NG July futures bounced last week on warmer weather and production cuts. On Friday we saw a pullback, as weather forecasts lost some CDDs (cooling degree days). UNG fund started August contract roll on June 12 -17.
Technicals: Daily and 4 Hr chart are pointing toward lower prices; 1 Hr chart is forming a bottom. We may have a short-term bounce from lower levels, but overall direction is pointing toward lower prices, or consolidation.
Fundamentals: demand/supply balance remains bearish in the near-term; prolonged heat is required to produce a rally in prices, although the number of rigs has declined by 7. Second half of June was expected to be hotter per last week's forecast, but on Friday, weather pattern turned cooler, with lower demand for cooling. Until the next heat wave emerges, we may be facing lower prices.
Crude oil prices are declining due to high inventories build and worries about slow economic recovery, adding to the bearish picture.
On the positive note, economy is reopening in higher consumption states, NY, NJ, and PA on June 20th. Weekly EIA report capturing this period may show higher consumption two weeks from now. Until then, a strong prolonged heat wave is required to change current bearish price pattern.
GAS

June 14 Market Update | Technical, Fundamental, NewsDescription:
An analysis for the week ahead.
Points of Interest:
4-Day Island; Thursday Liquidation; Balance Area Below S&P 500 $2,975; Friday Corrective Action.
Technical:
Risk-off sentiment after equity indices erased an earlier gap that occurred on hopeful economic data. The island of balance left behind will offer resistance on any correction higher. If the market trades through that area, then sentiment has changed and the initiative activity that drove prices lower is no longer present.
Recapping last week’s action, Monday overnight traded to a low-volume area from Friday creating a ledge at $3,211 that the market later moved through, into the close. Prices above the ledge were rejected after Tuesday's overnight auctioned below the breakout point, down to resting liquidity at $3,190.
Wednesday's FOMC meeting officially ended the move higher as volatility increased and the market closed lower. Thursday displayed a rush from risk as selling was persistent and strong into the close.
Friday failed to generate continued selling below $3,000, closing above a prior balance area and VWAP.
Putting everything together, the picture points to the potential for a correction up to the coming Friday option expiration. If liquidation continues into the coming week and value moves lower, then the near-term bullish narrative is no longer intact.
Scroll to bottom of document for non-profile charts.
Key Events:
New York Federal Reserve’s Business Conditions Index; Retail Sales; Initial Claims; Industrial Production; Housing Starts; Housing Permits; Philadelphia Federal Reserve’s Business Index; U.S. Current Account Deficit.
Fundamental:
Short-term speculative derivatives activity results in more hedging and volatility. bit.ly
COVID-19 coronavirus data may have not prompted recent selling. bloom.bg
Keeping unproductive companies going lowers long-run economic growth. bloom.bg
The Congressional Budget Office sees virus relief reaching $2.2 trillion this year. bloom.bg
U.S. gasoline consumption rebounds, led by removal of mobility restrictions. reut.rs
May default volume brought YTD default volume to its highest since May 2009. bit.ly
Coronavirus obliterated the best African-American job market on record. on.wsj.com
Fed to buy as many bonds as necessary to keep yields at desired level. bit.ly
After-tax profits for retail companies fell more than expected. bit.ly
Apple Inc (NASDAQ: AAPL) to stop using Intel Corporation (NASDAQ: INTC) chips. bloom.bg NASDAQ:AAPL NASDAQ:INTC
Incoming shift to digital may grow Amazon Inc’s (NASDAQ: AMZN) AWS revenues. bit.ly NASDAQ:AMZN
The U.S. saw its largest decline in business owners between February and April. bit.ly
BP plc (NYSE: BP) to cut global workforce by 10,000. bit.ly NYSE:BP
Unrest and inequality pose fiscal and governance credit risks for states and cities. bit.ly
Airlines unlikely to fully recover before 2023, face structural changes. bit.ly AMEX:JETS
The U.S. consumer price index continues falling, sparks talk of deflation. bit.ly
Flat yield curves are a key threat to bank margins as rates stay low for longer. bit.ly
Hong Kong’s relief measures reduce pressure on bank asset quality. bit.ly
New SEC rules on crowdfunding a boost to capital raising for startups. bit.ly
Auctioneers race to unload oil equipment as drilling interest dries up. reut.rs
Senators draft plan to reform new plane design approvals. reut.rs NYSE:BA
American Airlines Group Inc (NASDAQ: AAL) to halt cash burn by year-end. reut.rs NASDAQ:AAL
Goldman Sachs (NYSE: GS), Morgan Stanley (NYSE: MS) downgrade Tesla Inc (NASDAQ: TSLA) noting current valuation underestimates risks including increased competition. reut.rs NYSE:GS NYSE:MS NASDAQ:TSLA
The Fed expects household finances to suffer persistent fragilities due to shock. reut.rs
U.S. consumer confidence rises while unemployment shadow lingers. reut.rs
Fed Chair Powell is devoted to the return of a strong labor market. reut.rs
Hertz Global Holdings Inc (NYSE: HTZ) seizes on speculation with stock sale. reut.rs NYSE:HTZ
Sentiment: 34.3% Bullish, 27.7% Neutral, 38.1% Bearish as of 6/14/2020. bit.ly
Gamma Exposure: (Trending Higher) 5,515,247,892 as of 6/14/2020. bit.ly
Dark Pool Index: (Trending Higher) 49.7% as of 6/14/2020. bit.ly
Product Analysis:
S&P 500 (ES): AMEX:SPY TVC:SPX
Nasdaq 100 (NQ): NASDAQ:QQQ TVC:NDX
Russell 2000 (RTY): AMEX:IWM TVC:RUT
Gold (GC): AMEX:GLD
Crude Oil (CL): AMEX:USO AMEX:DBO AMEX:USL
Treasury Bonds (ZB): NASDAQ:TLT
Disclaimer:
This is a page where I look to share knowledge and keep track of trades. If questions, concerns, or suggestions, feel free to comment. I think everyone can improve, especially me.
In no way should this post be construed as investment advice.


Natural Gas Futures: explosive move expectedI expect the price of Natural Gas Futures to make an explosive move pretty soon. Whether it will be bullish or bearish is not clear, the MACD and the moving averages look rather pessimistic but the 50 MA might soon cross the 100 MA upward, which would be a bullish signal. In case the price leaves the triangle bullish, we can expect it to gravitate back to 2.885. In any case, better keep an eye on this one!
VF Investment cannot be held responsible for any financial damages suffered from following our well-funded but personal opinions and trading ideas.
Please, maintain proper position sizing and risk management!

Gujarat Gas Short below gravity ControlHey hello brother my self Ravindra,
You will find me on my bio
Gujarat Gas Bearish Below 288 For Target toward 280-270-270 Sl @297
Thanks

Trading the Range on NatGas by ThinkingAntsOkMain items we can see on the 4hs chart:
a) The price is inside a Huge 4HS range
b) Both sides have been tested multiple times
c) Currently, we can see a corrective Structure in the middle of the range after bouncing from the lower zone
d) If the Corrective Structure is broken with a bullish movement, we expect a continuation of it towards the Resistance zone
e) TRADING OPPORTUNITIES: Wait for the Breakout and look for 1h corrections

UGAZ: NG Demand Rising. Positive Divergence?Natural gas demand is rising due to electric power sector demand increase. Total U.S. consumption of natural gas rose by 3.9% compared with the previous report week. Natural gas consumed for power generation climbed by 10.1% week over week. In the residential and commercial sectors, consumption declined by 5.9%. Industrial sector consumption decreased by 0.3% week over week. Natural gas exports to Mexico increased 4.8%. (Data from EIA report, last week).
Technicals are showing a positive divergence between momentum and price; MACD is showing higher bottoms (coiling) while NG prices continue to consolidate. A potential for a break to the upside? Waiting for Thursday EIA report.
This week residential demand is continuing to rise because of hot weather. Industrial sector is also picking up due to reopening. Hurricane reduced production by 1 bcf, although produced delays with LNG exports. Fundamentals are turning bullish, although we are still oversupplied. May need another 2 weeks of growing demand to overcome high storage build.

June 7 Market Update | Technical, Fundamental, NewsDescription:
An analysis for the week ahead.
Points of Interest:
ATH; Gap Above; Gaps and VPOCs Below; Absence Of Stronger Sellers.
Technical:
Risk-on sentiment in all major indices. Despite the Nasdaq-100 surpassing it’s all-time high, its moves have become more muted, signaling a rotation from the bigger technology- and innovation-driven companies to energy, transportation, financials, small caps, and so on.
Monday came after an end-of-week flush and a close at the highs. Monday’s overnight action was supported with buyers lifting into the open.
Tuesday’s open seemed exhausted, with some heavy offers developing at and above $3075. Later, the S&P 500 traded down to $3050, an area of resting liquidity, before closing higher.
Wednesday’s session squeezed higher into $3111, came down to some resting bids at $3090, and then buyers closed the range, again.
Friday opened on a massive gap, exacerbated by the May jobs report. The session ended up balancing at and around the $3200 strike.
Putting everything together, the picture points to further upside, but it’s obvious that cracks are beginning to form as indicated by the mechanical, short-term momentum-driven activity going on. As long as value shifts higher and liquidations fail to generate any follow through, then the bullish narrative remains.
Scroll to bottom of document for non-profile charts.
Key Events:
NFIB Small Business Optimism; JOLTS Survey; Wholesale Trade; CPI; PPI; Initial Claims; Import Prices; University of Michigan Sentiment Survey; FOMC Meeting.
Fundamental:
Absent a second wave and geopolitical turmoil, momentum will push markets higher. bloom.bg
Despite government measures, COVID-19 is wreaking havoc on Latin America. bit.ly
Canada adds 290,000 jobs as restrictions on business are loosened. reut.rs
The U.S. economy added jobs in May with the jobless rate falling to 13.3%. reut.rs
The Senate loosened the rules small businesses must follow when applying for PPP. bit.ly
The personal care, restaurant, entertainment, and leisure industries are recovering. bit.ly
Non-white communities realize un-equal recovery, worsened by low liquidity and savings. wapo.st
YouTube’s growth paints a bullish picture for Google parent Alphabet. bit.ly NASDAQ:GOOGL NASDAQ:GOOG
Corporate bond yield spreads reflect expectations of a business cycle upturn. bit.ly
Easing of capital outflows from ASEAN markets reduced liquidity pressures. bit.ly
China’s manufacturing returned to trend, but the consumer sector is still lagging. bloom.bg
Repression, or forced lending to the government at low rates, may be bullish. bloom.bg
By the end of 2020, earnings will be higher than they were in 2019. bloom.bg
Valuation methods pin fair value for the S&P 500 Index between $2,200 and $2,800. bit.ly
Low rates rationalize the outperformance of growth companies. bit.ly
Fed’s balance sheet expansion may slow down inflation. bit.ly
Expensive stocks have not reached levels seen during the tech bubble. bloom.bg
Eurozone corona-bonds would help euro-denominated assets outperform. bloom.bg
OPEC+ agrees to one-month extension of output cuts. reut.rs
Ford is evaluating the need for office space. reut.rs NYSE:F
Remote work to spark a housing boom in the suburbs and smaller cities. on.wsj.com
Amazon plans summer sale for June 22 to jumpstart sales after demand hit. cnb.cx NASDAQ:AMZN
‘Nuclear Option’: U.S. could cut Beijing from the dollar payment system. bit.ly
Sentiment: 34.6% Bullish, 26.6% Neutral, 38.9% Bearish as of 5/31/2020. bit.ly
Gamma Exposure: (Trending Higher) 4, 239, 083, 647 as of 6/6/2020. bit.ly
Dark Pool Index: (Trending Higher) 45.2% as of 6/6/2020. bit.ly
Product Analysis:
S&P 500 (ES): AMEX:SPY TVC:SPX AMEX:SPXL
Nasdaq 100 (NQ): NASDAQ:QQQ TVC:NDX NASDAQ:TQQQ
Russell 2000 (RTY): AMEX:IWM TVC:RUT
Dow Jones (YM): AMEX:DIA TVC:DJI
Gold (GC): AMEX:GLD
Crude Oil (CL): AMEX:USO AMEX:DBO AMEX:USL
Natural Gas (NG): AMEX:UNG
Treasury Bonds (ZB): NASDAQ:TLT
Disclaimer:
This is a page where I look to share knowledge and keep track of trades. If questions, concerns, or suggestions, feel free to comment. I think everyone can improve, especially me.
In no way should this post be construed as investment advice.

Chevron Corporation (CVX) long.All description on the chart.
Please, don't forget to like and follow.
Thank you.

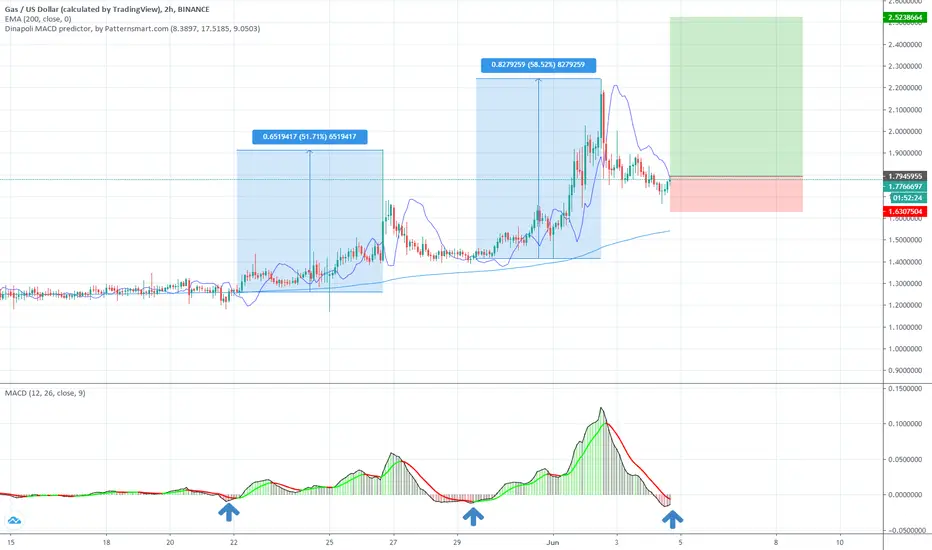
GAS about to explode? get it?The last two times the MACD retraced above the 200 EMA and crossed over it brought crazy gains.
It could be an excellent set up for a long swing trade.
Kinder Morgan (KMI) long.All description on the chart.
Please, don't forget to like and follow.
Thank you.

RPC, Inc. (RES) long.All description on the chart.
Please, don't forget to like and follow.
Thank you.

CenterPoint Energy #CNP long position
CNP CenterPoint Energy, Inc. USA, Utilities - Regulated Gas
Market Cap 9.22B EPS (ttm) -1.10
EPS this Y 81.30 %
Forward P/E 13.43 EPS next Y 3.30%
EPS past 5Y -1.20 %
P/S 0.84 EPS next 5Y -4.52 %
P/B 1.74
Dividend 3.31% Sales Q/Q -2.80 %
Insider Own 0.30% Inst Own 86.70%
Insider Trans -0.06% Inst Trans -1.52%
Short Float 4.04% Earnings May 07/b
Avg Volume 9.68M 52W Range 11.58 - 30.71

TOTALTOTAL
Today go in total and get the MAX profit, bullish Channel
IF YOU GO, IS THIS THE TIME TO GO IN!!!
See you Later

Our Trading Plan on NATGAS by ThinkingAntsOkMain items we can see on the chart:
a) The price is on a well-tested support zone
b) The price has broken the descending trendline
c) We want to see a clear impulse outside the previous descending trendline + a 10-12 days correction
d) The reason we have decided that filter is because we observed similar behavior on the Weekly Chart in previous situations
WEEKLY CHART:

UGAZ: NG Natural Gas Getting Ready For A Move Up?Chart patterns are suggesting a reversal to the upside, possibly targeting $18-$24 levels for UGAZ, as NG prices are expected to go higher into the summer heat and economy reopening by 3rd week of June in NY, NJ, PA. We may have another a couple of days of consolidation with lower prices due to bearish EIA report on Thursday. Expecting over 100 bcf in storage. However, rising demand is on the horizon.
NG price targets are: $1.8; $1.93, $2.048. UGAZ, being ETN, may not reach its recent highs in the 30s. However, it is expected to get into mid 20s, with resistance at around $26 price level.

NG: Natural Gas: UGAZ: Getting Ready For A Move Up?NG: Potential bottom is forming at $1.78 level. Natural Gas July futures contracts were trading lower on Tuesday finding support at $1.78. MACD histogram is at the crossing point pointing toward higher prices. Near-term resistance is seen near $1.978, a 38.2% Fib retracement level of the recent move down, with $2.048 being a 50% Fib retracement. RSI is also forming a bottoming pattern pointing toward higher levels. Further consolidation is possible until we have a bullish EIA report showing decline in storage.
Thursday EIA report is still expected to show a triple digit build above 100 bcf, which is bearish, but a decline in storage is expected to show next week, as consumption is rising.
Fundamentals are improving, based on June hot weather and economy reopening by 3rd week of June. This week could be a turning point for natural gas.
A longer-term bearish factor for natural gas is a potential increase in oil production. As crude oil prices are moving higher, shale producers may ramp up their production, which in turn may lead to another cycle of oversupply for both commodities.
In general, NG prices are expected to go higher from here, reaching toward $2.5 level by year end (based on forward curve), which is 40% lower than prior year, as high supply may keep a lid on the rally.
However, if we are going to get extreme heat this summer, $2.5 price level may be reached sooner, possibly moving into a month of August.

$NEO pump or sell the news? We will know soon $NEO pump or sell the news? We will know soon
News comming out in 1 hour or so

Armada, Berjaya Tak Buat New High Atau Terus Breakout.Just for Wacth/ study case..not buy call.
View H4 only High Low, New HH New HL like as ABC.
TP 1 = 0.310 - 0.325.
TP 2 = 0.350
SL = 0.205

Gas Going As Chartted, Where's The Next Target? 320%+Just a few days ago we shared a chart for GASBTC with a 100% bullish bias... This is how things are going now, the next target is marked on the chart at 325%.
This is not financial advice.
Namaste.
------
Previous analysis
Neo Gas Weekly Chart Analysis With 385%+

TUPRAS $TUPRS is breaking downtrendEntry TRY 88.50
S/L. TRY 83.90
TP1 TRY 92.10
TP2. TRY 96.15
if you find my charts useful, please leave me "like" or "comment".
Please don't trade according to the ideas, rely on your own knowledge.
Thx

GUJARAT GAS_LONG AFTER BOgujarat gas..need for day to day life ..currently stock is trading in a triangle. as the stock touches support, buyers come into role and pushes
price up (as represented by volume). i am expecting for bullish movement after Breakout. LONG TERM INVESTMENT TYPE STOCK.

Air Liquide is trying something hereAir Liquide tries to break the trend channel. It seems the gas producer did not get big hits from the corona crisis. The company is paying dividends for a long time now and is bullish in the past.
The break of the trend channel comes with an buy signal from the macd. The RSI is on a normal level but just crossed the 50. If the stock ends significantly above the trend channel today it is a clear buy for me.
